
Abstract
Emotion is a property by which human beings and machines can be differentiated as machines are emotionless while human beings are not. If the emotion of a speaker is recognized then others can interact accordingly. This paper presents a new approach for recognizing all the six basic emotions (Happy, anger, fear, sadness, boredom and neutral) from the speech signals more effectively. To recognize the emotion of a speaker, pitch value and two wavelet packet feature vectors derived from speech signals are used. Principal Component Analysis (PCA) has been applied to reduce the dimension of feature vectors. Random Forest (RF) and Support Vector Machine (SVM) classifiers are trained separately based on these reduced feature vectors. The experimental results show that the accuracy of emotion recognition with Random Forest classifier is 86.11% while with SVM classifier it is 84.41%. Experimentally, it is also found that clean speech of 1 sec duration is sufficient enough to recognize emotion of the speaker.
Introduction
Speech is a common and an easy medium for conversation among human beings. Emotions change the semantic of the speech. Emotion, gender, age etc of the speaker are sometimes necessary to be identified. Correct recognition of emotion of a speaker improves the working in many areas like human computer interaction, E-learning, call center systems, counseling and health care systems. By detecting the mental status of the drivers from their speech, monitoring systems may alert other drivers of nearby vehicles. By recognizing the mood of online students, tutors working in E-learning system may change their teaching style accordingly. During conversations counselors make use of responses received from the clients to analyze the emotional status of their clients. By detecting the angriness of client from the speech, call center representative may give priority to that call. Recognition of emotions from human speech is a growing research area mainly for better human computer interaction. It allows computers/robots to perform the task effectively by understanding the emotion of the speakers during conversations. Features extracted from speech for emotion recognition are categorized into three categories [2]- Excitation features (jitter, shimmer etc), Vocal Tract features (formant, bandwidth etc) and Prosodic features (pitch, intensity, intonation etc). Tune and rhythm of a speech are obtained using prosodic features. Information about vibrations of glottal folds of speaker are contained in the source excitation features which are generated at the time of excitation of speech signals. Information about vocal tract vibrations are contained in vocal tract features. Speech signals spoken by speaker are the convolved sum of excitation source and vocal tract information.
The state of the art approaches for emotion recognition from speech are as follows:
In 2004, Yildirim et al. [22] recognized four types of emotions (sadness, anger, happiness and neutral) by fusing spectral energy, speech prosody and vowel articulation features from speech recorded in English language with the accuracy of 67%. They also claimed that acoustic properties of happiness and anger, sadness and neutral are similar in nature. In 2005, Vidrascu and Devillers [14] classified five emotions of the speech signals taken from French database into two sets. One set contains negative emotions (fear, anger, sadness, hurt) and other contains neutral emotion. Lexical, spectral, prosodic, disflence (pauses) and paralinguistic (crying, laughter) features extracted from recorded call center conversations are combined. The recognition accuracy was 80% by using Support Vector Machine (SVM) classifier. In 2006, Hoque et al. [15] classified four emotions into two categories: positive emotions (flow, delight/happy) and negative emotions (frustration/anger, confusion/boredom) using extracted spectral and prosodic features from speech. The accuracy of emotion recognition through speech signals taken from DES speech database was 83.3% with Random Forest classifier. In 2007, M. Lugger and B. Young [16] recognized six types of emotions (anger, happiness, sadness, boredom, anxiety/disgust and neutral) using Berlin emotional database with Bayes classifier. They have used supra-segmental features (pitch, energy, duration) and segmental features (voice quality, zero crossing rate and articulation) for the said task. Maximum obtained accuracy claimed was 82% when sequential floating forward selection (SFFS) algorithm was used to select the subset of features among available feature vectors. In 2007, K.S.J. Cichosz [12] recognized six emotions (anger, fear, sadness, boredom, joy and neutral) from speech signals taken from two databases: Polish database and German database with accuracy 76,30% and 74,39% respectively. Binary tree classifier was used for classification. In 2007, Mansoorizadeh and Charkari [17] recognized emotions from speech signals by taking frames of duration 10 msec and voiced segments (10 to 12 in number) from speech signals. In frame based approach, minimum duration of speech required to recognize the emotion was 1.5 sec whereas in voiced segment based approach, 10 or more voiced segments were required to recognize emotion. In 2008, Zhang [20] recognized four emotions (anger, joy/happy, sadness and neutral) from speech signals taken from Chinese natural emotional speech corpus. By using only prosodic features the accuracy claimed was 75% while using prosodic and voice quality features the accuracy was increased to 76%. This increment was because voice quality features were added to prosodic features. In 2009, Iliou and Anagnostopoulos [23] also used prosodic features (pitch, energy and duration) for emotion recognition. They recognized seven emotions (anger, boredom, disgust, fear, happy, neutral and sad) from speech signals taken from Berlin database using Artificial Neural Network (ANN) with accuracy 51%. In 2009, Bozkurt et al. [7] recognized six emotions (anger, boredom, fear, happy neutral and sad) from speech signals taken from INTERSPEECH- 2009 emotion challenge corpus using Hidden Markov Model (HMM) classifier.They extracted spectral, prosodic and HMM based features from speech signals and accuracy claimed was 63.03%. In 2012, Dorota Kaminska and Adam Pelikant [6] extracted Fundamental frequency (F0) feature from speech signals taken from Polish emotional database. They claimed 70% accuracy with K-Nearest Neighbor (KNN) classifier. They used Plutchik’s cone-shaped 3D model to represent intensities of different emotions. In 2013, Gayatri Lokhande and K.S. Bapat [9] recognized seven emotions (anger, disgust, fear, happy, neutral, sadness and surprise) from speech signals taken from IITKGP-SESC database. They divided different emotions into three categories: fast (anger, disgust and fear), normal (happy and neutral) and passive (boredom and sad) based on experiments performed using extracted features: speaking rate, vocal tract characteristics and MFCCs. They claimed 82% accuracy with Gaussian mixture models (GMM) classifer. In 2014, Chien Shing et al. [4] extracted MFCC feature from speech signals taken from eNTERFACE and RML database with accuracy 75.89% and 68.57%. RBF Neural Network classifier was used to classify the emotions. In 2014, Farah Chenchaha and Zied Lachiri [8] extracted wavelet packet energy and entropy features and then applied extracted features on Mel, Bark and ERB scale. The maximum accuracy claimed with SAVEE database was 78.5% and with IEMOCAP database was 50.06%. In 2015, Fayek et al. [10] used DNN classifier to recognize emotion from one second frame of raw speech spectrogram. They claimed accuracy 60.53% to classify six emotions of speech signals taken from eNTERFACE database and also 59.7% to classify seven emotions of speech signals taken from SAVEE database. In 2015, Lanjewar et al. [18] extracted Spectral MFCC [19], wavelet features and pitch from speech signals to recognize six emotions (happy, angry, neutral, surprise, fearful and sad). GMM classifier was used to recognize angry emotion with highest accuracy 92% and surprise emotion with 25%. In 2015, Rajisha et al. [24] extracted Mel Frequency Cepstral Coefficients (MFCCs), Short Time Energy (STE) and Pitch features from speech signals taken from Malayalam language database. The claimed accuracy were 88.4% in the case of ANN and 78.2% in the case of SVM.
From literature survey, it is realized that pitch feature was widely used for emotion recognition. Wavelet packet transform features contain both time domain and frequency domain information. Therefore, wavelet packet transform features along with pitch are used to recognize six types of emotions (happy, anger, fear, sadness, boredom and neutral) in the proposed work. Support Vector Machine (SVM) and Random Forest (RF) classifiers are used for the recognition of emotions in theexperiments.
Rest of the paper is organized as follows: Section 2 describes the methods used for extracting features for recognizing emotions. Section 3 describes the classifiers used. Section 4 shows the proposed block diagram and algorithms. Section 5 presents the experimental results followed by Section 6 presenting comparison of results obtained from proposed approach and state of the art approaches. Section 7 concludes the paper.
Speech signal features and their extraction methods
In the literature, features like spectral energy, pitch, energy, duration, voice quality have been used for emotion recognition with ANN, HMM, SVM, Bayes, Random Forest classifiers. Pitch and wavelet packet transform features (wavelet packet energy and wavelet packet entropy) are extracted from speech signals in proposed approach. Support Vector Machine and Random Forest classifiers are also used in the proposed approach.
Features extraction
In the proposed approach, two features pitch and wavelet packet transform (wavelet packet energy and wavelet packet entropy) are extracted from the preprocessed speech signals. The size of pitch feature and wavelet packet features are 1 and 383 respectively. Figure 1 shows the details of process of forming combined feature vector of size 384.
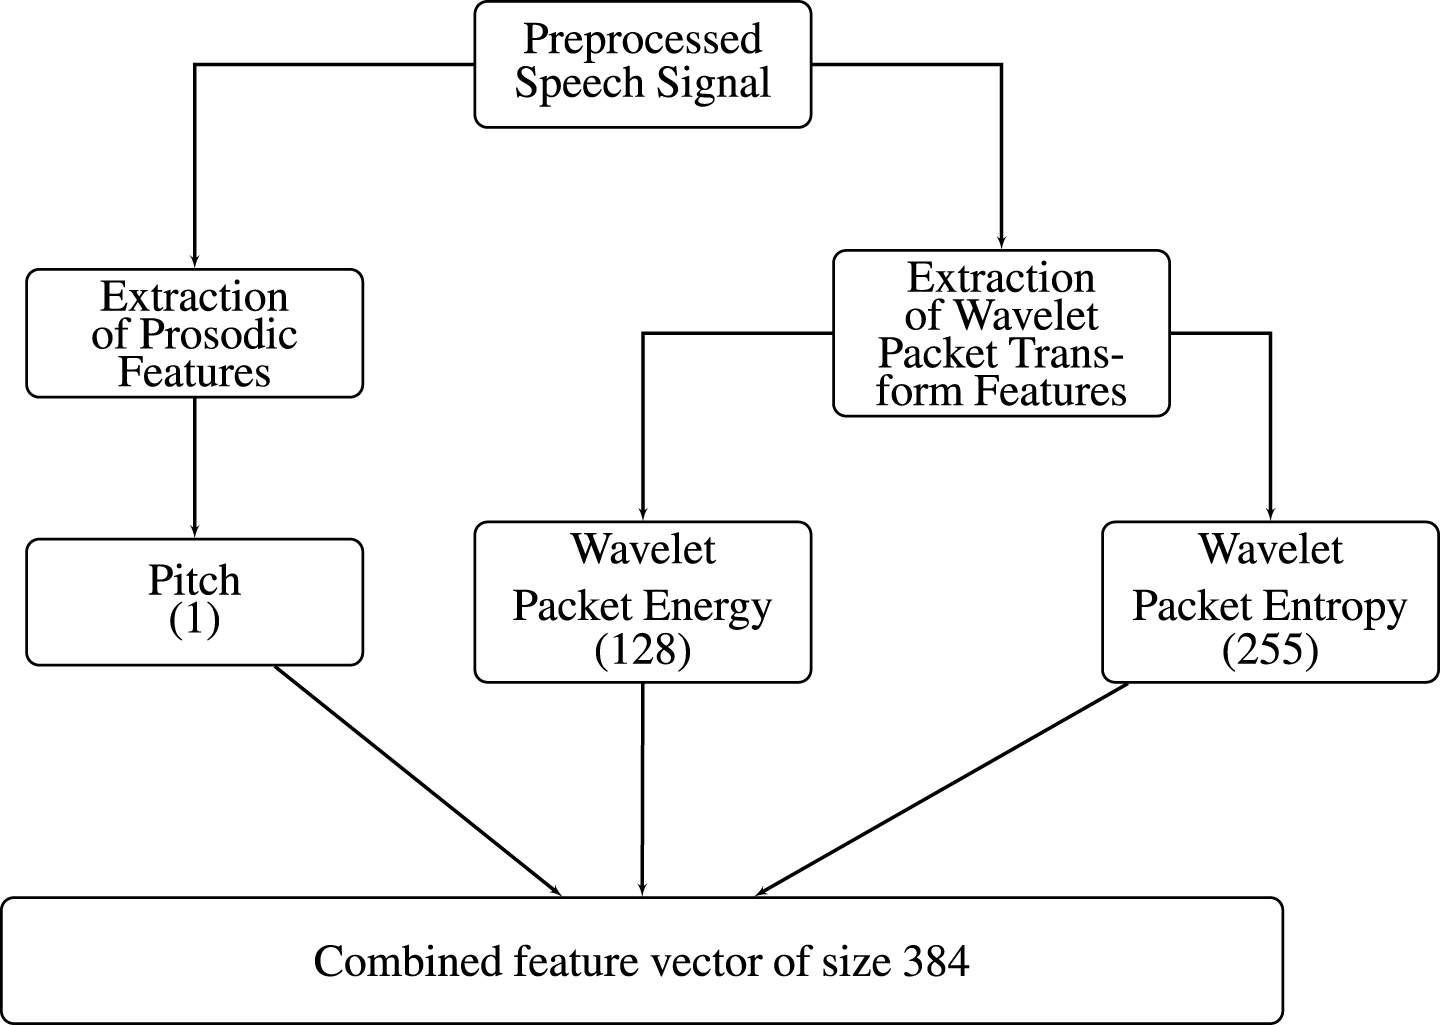
Extraction of features used for emotion recognition.
Pitch value of speech signal is determined using Subharmonic-to-Harmonic Ratio (SHR) [25] method. This method uses logarithmic frequency scale and a spectrum shifting technique to sum up the amplitudes of harmonics and subharmonics. Some emotions have high pitch value and some have low pitch value. Experimentally, it is observed that there is a correlation between pitch value with emotion.
Wavelet Packet Transform (WPT)
Wavelet Transform (WT) provides the information in both time and frequency domain. In other words, WT is localized in both time and frequency domain [26]. In case of discontinuity of signals, WT generates few significant coefficients around discontinuity as compared to Fourier Transform (FT) that generates large number of coefficients with large magnitudes. The whole process of decomposition of signal can be expressed as tree where left branch represents the low pass filtering output and right branch represents high pass filtering output [5]. In WPT, low and high frequency bands are separated.
In MATLAB, “wpdec” function is used for the decomposition of speech signal.
This function decomposes speech signal x upto depth 7 with Daubechies-3 filter (db3) and shannon entropy. T is a wavelet tree generated after the decomposition of speech signal. Following two wavelet packet features from each frame of the speech signal are extracted.
The energy associated with each frame of speech signal is calculated using MATLAB function:
For a wavelet packet tree T, “wenergy(T)” returns a vector E, which contains the percentages of energy corresponding to the terminal nodes of the tree T. The size of wavelet packet energy vector E is 128.
The wavelet packet entropy associated with each frame is extracted using MATLAB function
The allnodes returns a column vector containing indices of all nodes of tree T. The nodes are numbered from top to bottom and from left to right. The index of root node is 0.
T is the wavelet packet tree and ‘ent’ is the keyword used for entropy. The size of wavelet packet entropy feature vector P is 255.
The size of pitch feature and wavelet packet transform feature vector are 1 and 383 respectively. So there is a need to reduce the size of combined feature vector of size 384. The size of feature vector is reduced using feature reduction techniques. Here, Principal Component Analysis (PCA) is used to reduce the dimension or size of feature vector.
PCA is a technique used for reduction of dimension or size of feature vectors. It also reduces the redundancy presents in feature vectors by projecting original feature vector onto new reduced dimension sub space [11]. It is a linearly transformation process in which high dimensional data is transformed into low dimensional data with maximum variance.
In PCA, principal components (PCs) represent projection for which variance is maximum. There may be more than one PCs, but all must be orthogonal to each other and variance must be maximum among them. The objective is to get new reduced features which are uncorrelated and having maximum variance among them. The reduced features can be efficiently classified into number of classes with least misclassification errors.
Classifiers used for emotion recognition
In Literature, it is found that SVM and Random Forest are widely used for emotion recognition.
SVM
Support vector machine (SVM) is being used for classification. It efficiently handles the large number of features and also tackles overfitting in efficient manner. Overfitting occurs because of large data variations. The decision surface is the boundary among the training points. Points closest to decision surface are known as support vectors. Classification accuracy of SVM is inversely proportional to the number of support vectors. In case of non linearly separable training data sets, data sets are transformed into new transformed feature space so that the data set becomes linearly separable in new featurespace [3].
Random forest
To classify speech signals into various emotions, multiple decision trees are created at training time. Higher number of decision trees improves the classification accuracy. Random Forest (RF) takes the final decision based on weighted sum of all the decisions taken by multiple decision trees based on polling/voting approach [1]. Average weighted sum is used by random forest for classification.
Bagging technique or bootstrap aggregating [21] is used in random forest to randomly select the subset with replacement from training set. Generally the size of new subset is the 2/3 rd of the original size.
Proposed approach
The EMO-DB emotional speech database is used here for emotion recognition. This database contains speech samples in German language spoken by 05 male and 05 female speakers in six different emotions: anger, boredom, fear, happy, neutral and sad. In proposed approach total 600 speech signals are taken where 100 speech signals are of one emotion. All the speech signals are in. WAV format of varying size from 1.87 seconds to 3 seconds. A single speech signal containing only one emotion at a time. The speech signals are sampled at 16000 Hz sampling frequency. Each sampling point is represented by18 bits.
Block diagram
Block diagram for the proposed approach as shown in Fig. 2 has following steps: Preprocessing of the speech signals (removal of Differential Coefficient (DC) effect, normalization and silence removal), Features extraction (pitch and wavelet features), Features reduction (PCA), Training of classifiers with 70% of speech signals and Testing of trained classifier with 30% of speech signals.
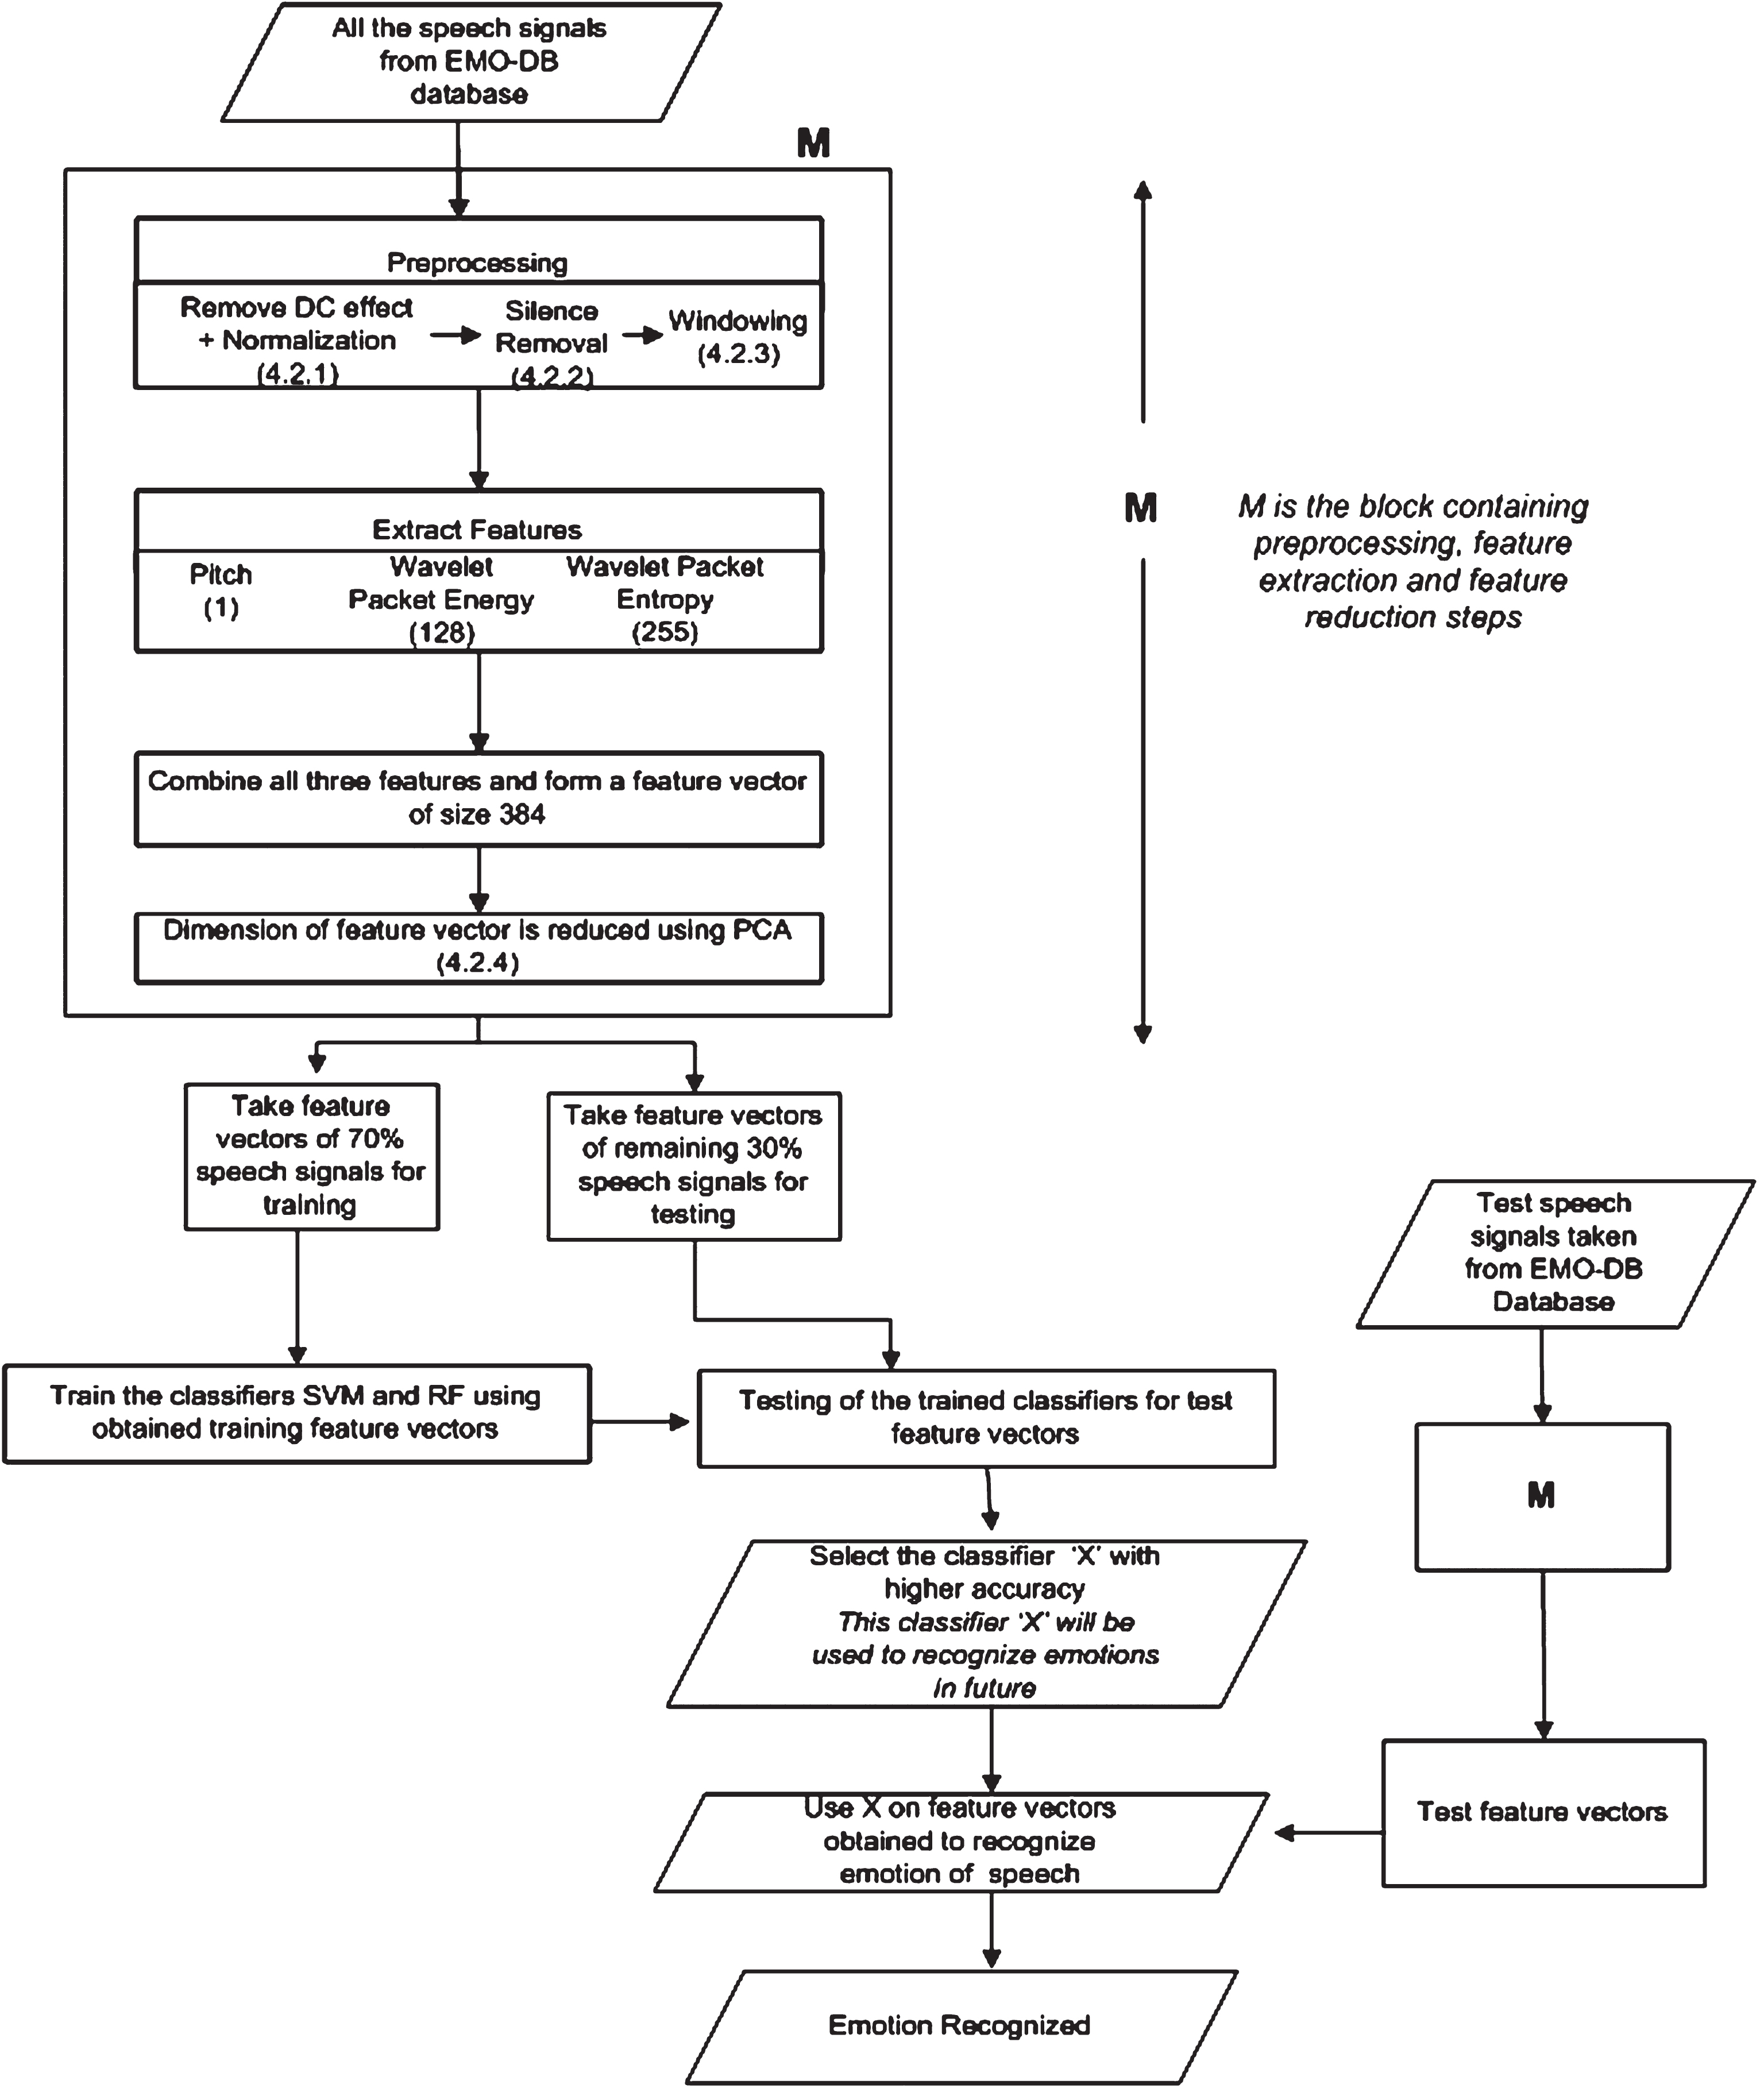
Block Diagram of proposed approach for emotion recognition.
First of all, speech signals are preprocessed using steps 4.2.1, 4.2.2 and 4.2.3 explained in block diagram. The proposed algorithm contains four sub algorithms. These four sub algorithms are explained in Algorithms 4.2.1, 4.2.2, 4.2.3 and 4.2.4.
Algorithm for Removal of DC effect and Normalization
Algorithm for Removal of DC effect and Normalization
Algorithm for Silence Removal
Algorithm for Windowing
Algorithm for PCA
It has been noticed that some speech signals are shifted from origin. This shifting is known as DC effect. After the removal of this DC effect, the waveform passes through origin. For better analysis of speech signals, the waveform must be pass through origin [13]. The removal of DC effect and normalization procedure are described in Algorithm 4.2.1. The samples of the speech signals have different range of amplitude values [6]. To analyze the speech signals they must be normalize to specific range. After normalization, the upper values of amplitudes of all the speech signals become same. The normalization procedure is also described in Algorithm 4.2.1.
Speech signal may also contains silence parts. These silence parts have no significant role in feature extraction. Silence parts are removed from speech signal using the Algorithm 4.2.2. Normalized speech signal is divided into frames of size 30 msec (480 samples). Experimentally it is found that normalized energy of silence frames are less than 2. Therefore, the threshold value for normalized energy is set as 2. Non silence frames are combined after removing of silence frames. The results are shown in Figs.3– 6. Figure 3 presents the normalized speech signal. Figure 4 presents the normalized energy of each frame. Figure 5 presents the frames having normalized energy greater than or equal to 2. Speech signal having no silence part is represented by Fig. 6. Speech signal is then multiplied by hamming window to remove the discontinuity at start and end of the waveform. Windowing is the process of multiplying the signal S (without silence part) with hammimg window of size 30 msec with overlap of 50% samples [13]. This procedure is described in Algorithm 4.2.3. The resultant signal is known as windowed signal S w .
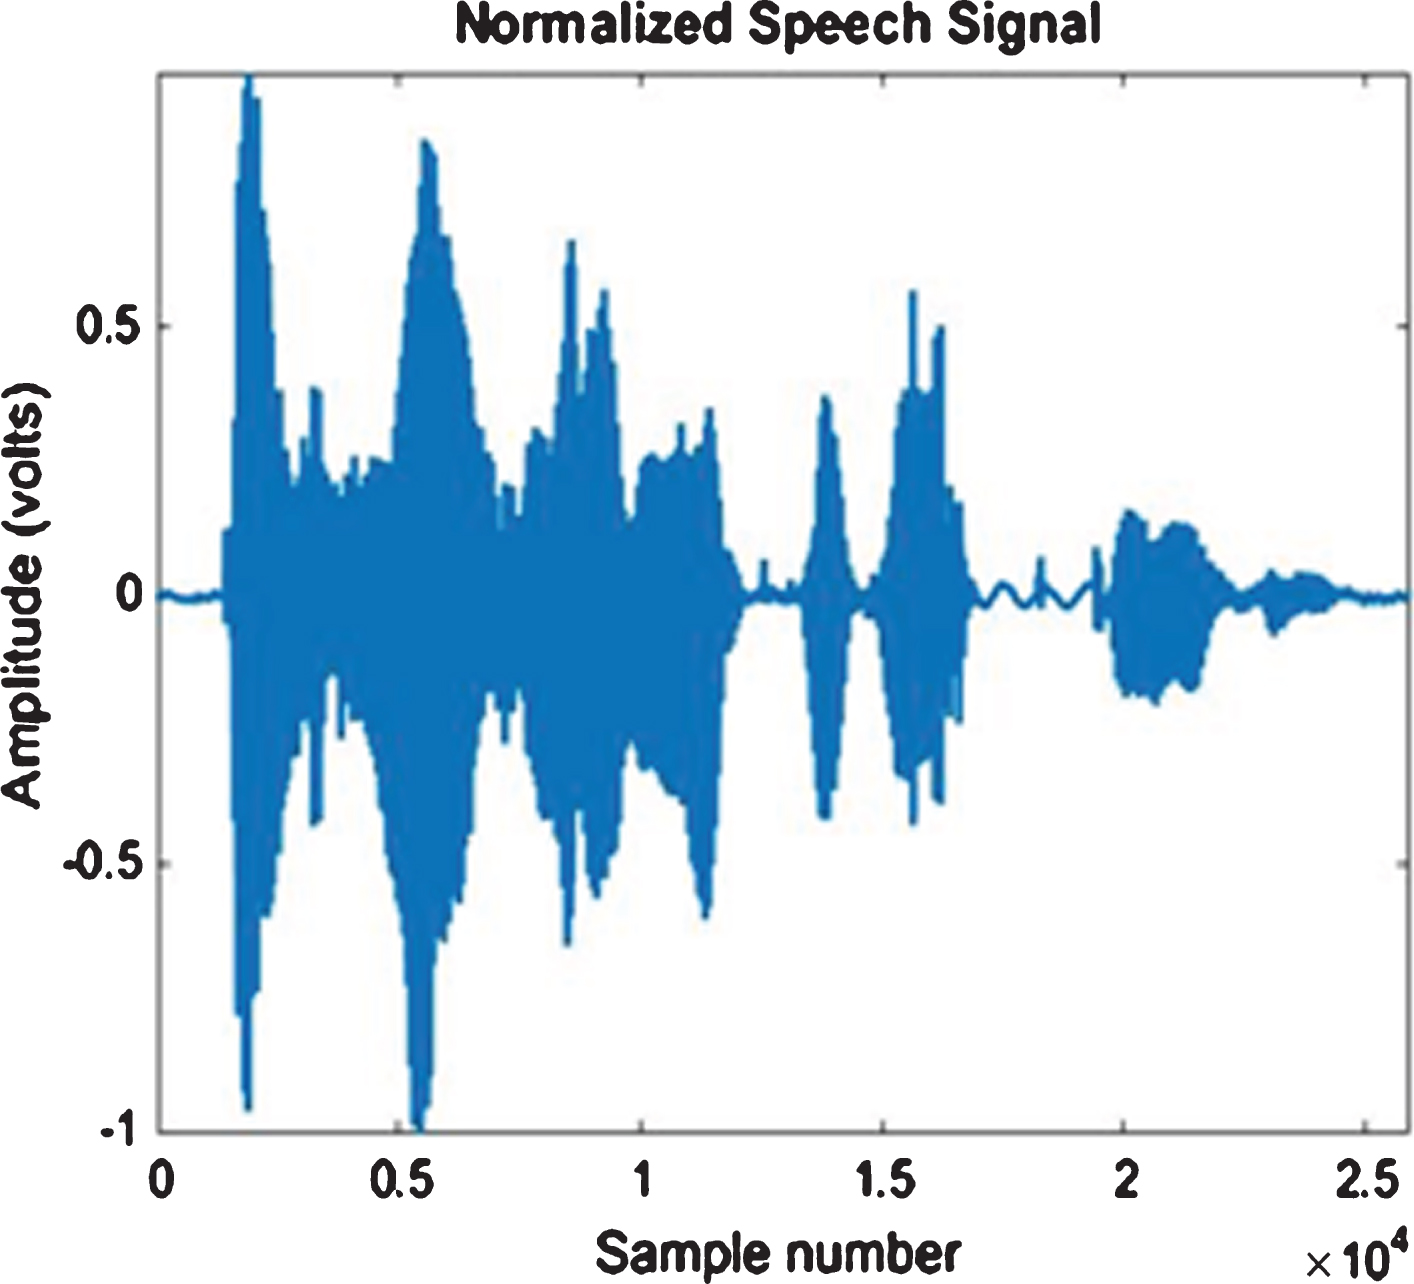
Normalized Speech Signal.
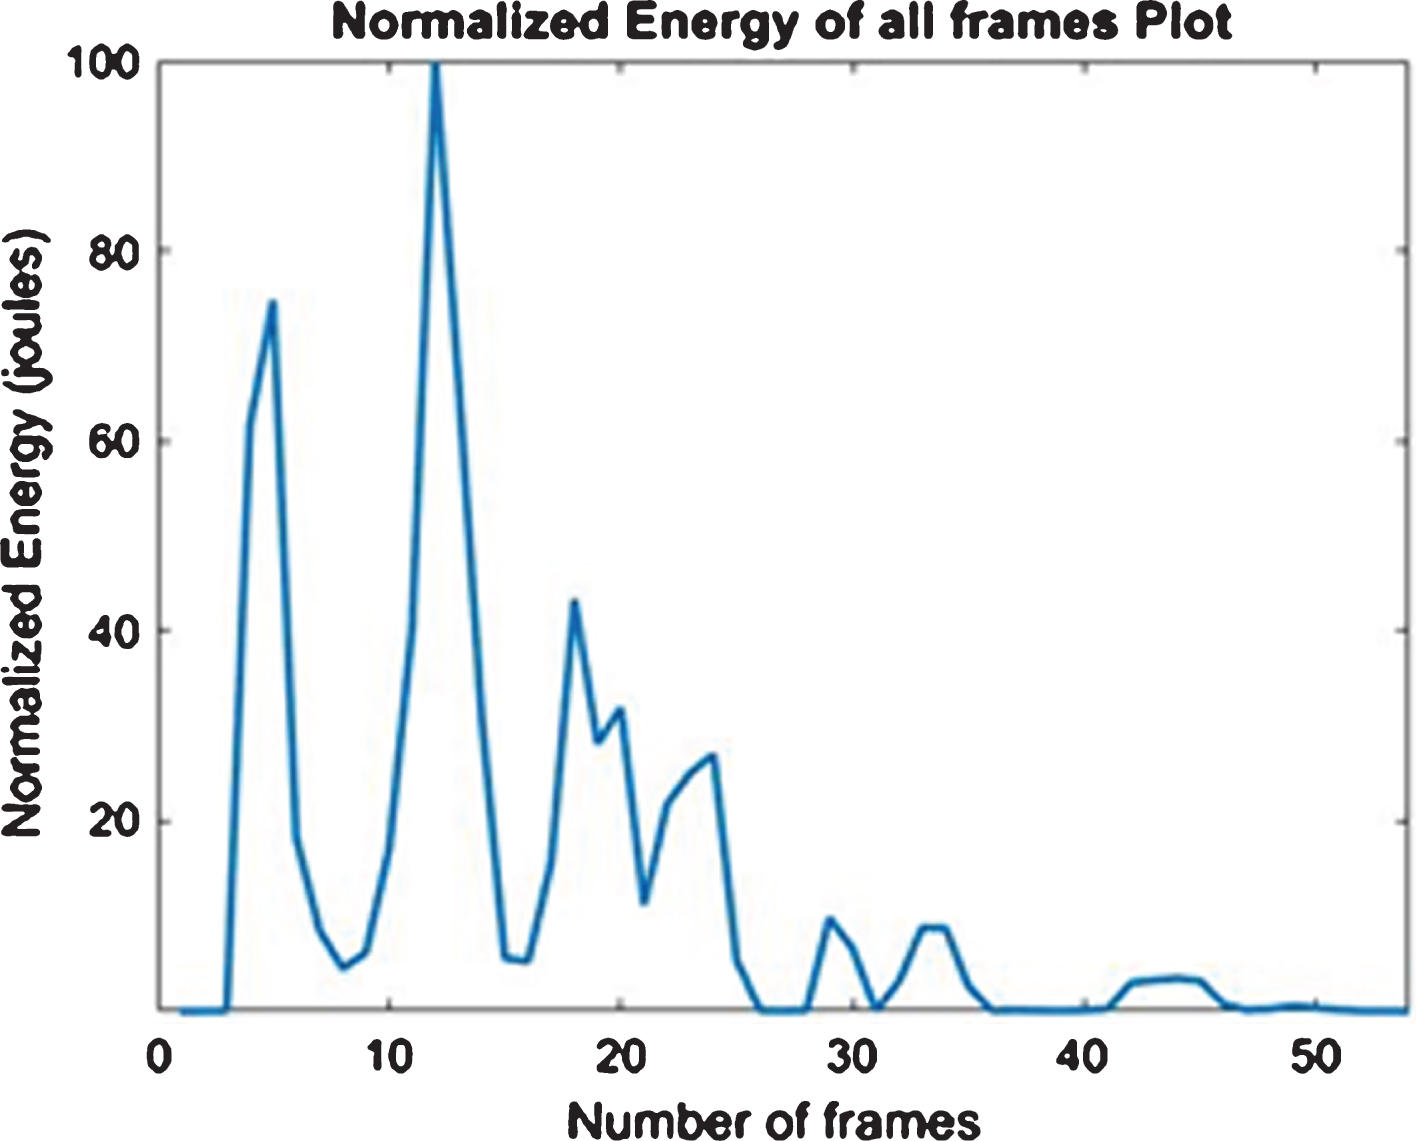
Normalized energy of each frame.
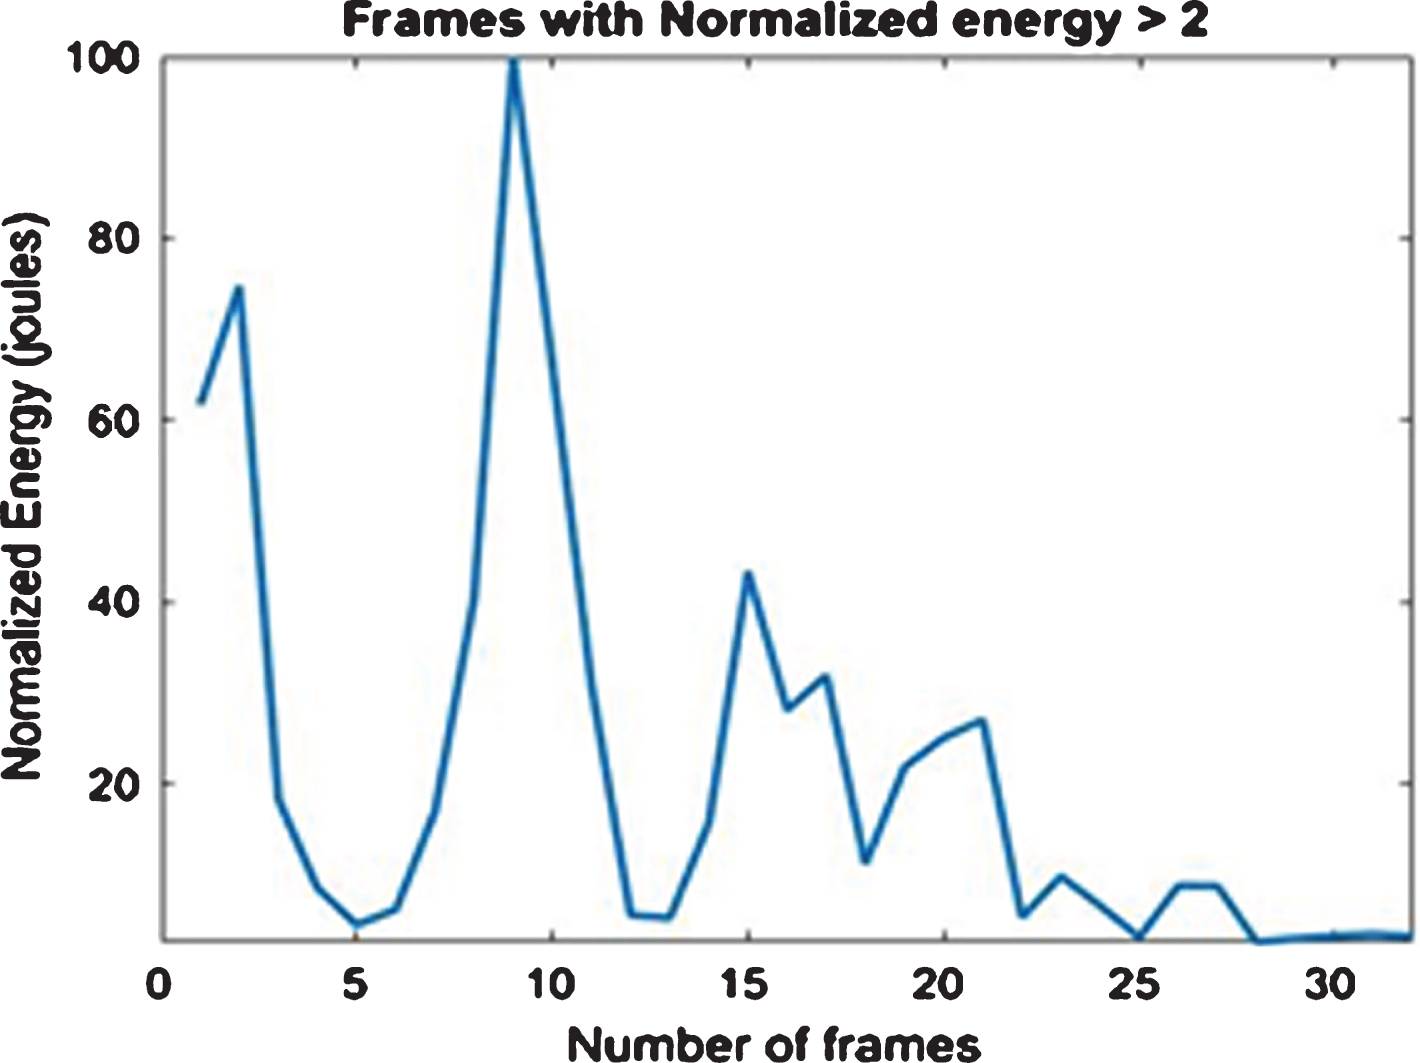
Frames having normalized energy >=2.
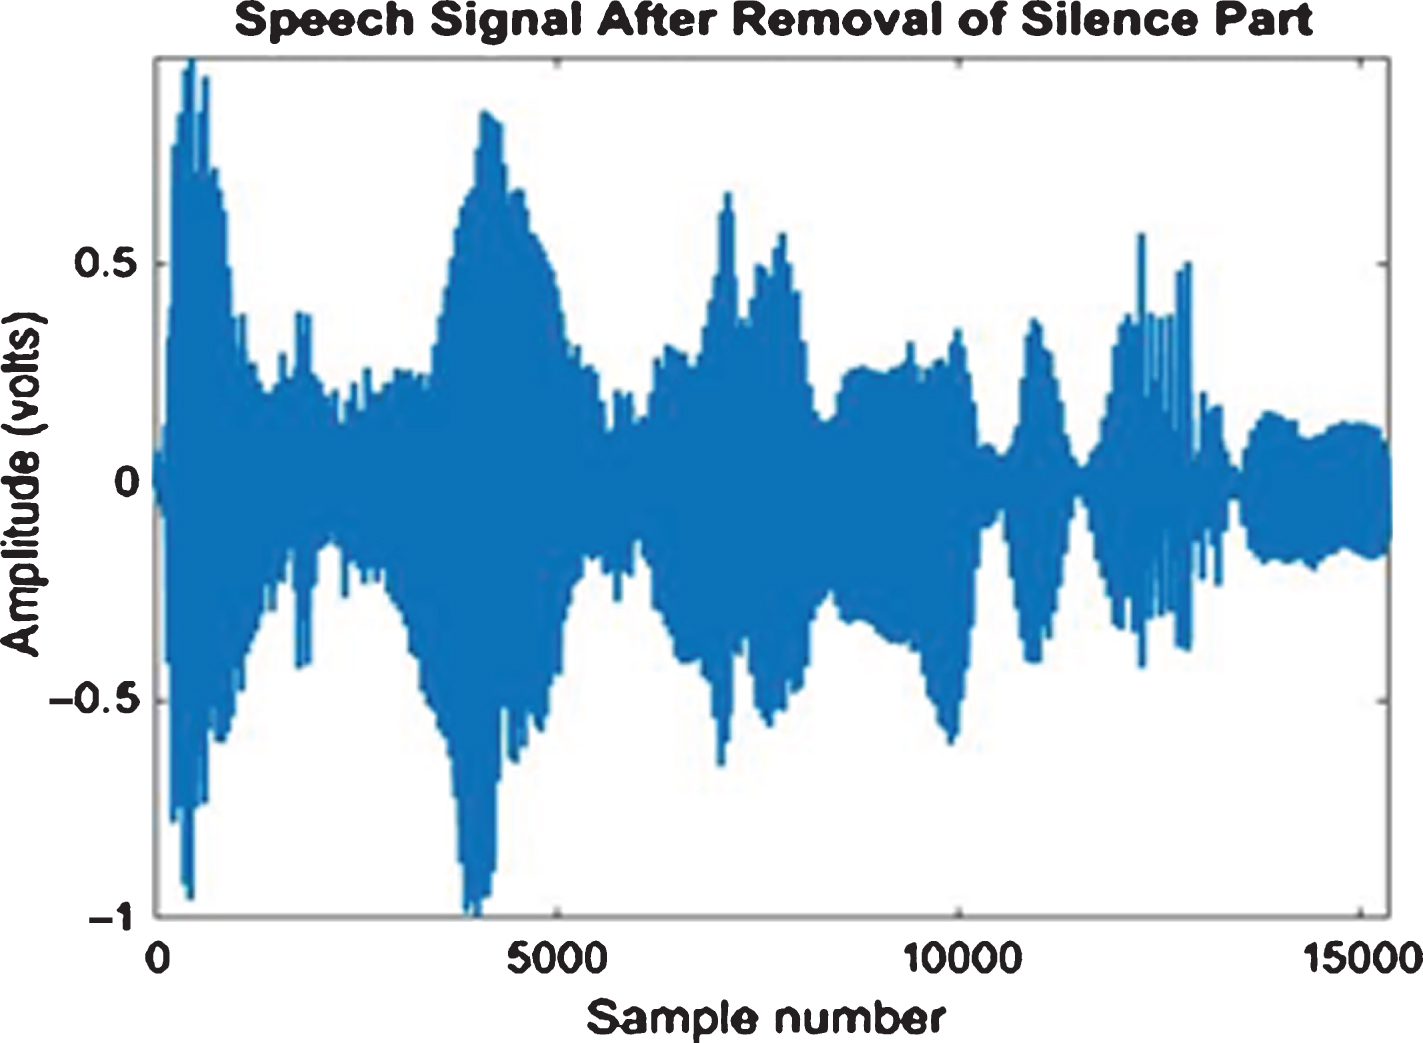
Speech signal after removal of silence part.
Pitch and wavelet packet transform features are extracted from windowed speech signal using methods defined in Sections 2.1.1 and 2.1.2. Wavelet packet transform features are wavelet packet energy and wavelet packet entropy of vector size 128 and 255 respectively. The total size of wavelet packet feature vector is 383. Pitch, wavelet packet energy and wavelet packet entropy features are combined to make feature vector of size 384. This process is applied on all the speech signals. PCA is then applied to extracted feature data sets of all the speech signals to reduce the dimension of the feature data sets. The variance among features must be greater than 99% [11] for selecting reduced dimensions with least misclassification error.
70% of all the reduced feature vectors are used for training and remaining 30% are used for testing. SVM and Random Forest classifiers are trained separately. Based upon the results obtained in experiment 2, it is found that the performance of Random Forest is better than SVM classifier. Therefore, it may be used in future.
Experiments have been performed on speech signals taken from EMO-DB database. This database contains speech signals having all six different emotions. We extract two features i.e. pitch and wavelet packet transform from all speech signals after their pre processing. The feature vector size for pitch is 1 and for wavelet packet transform feature is 383 (128 + 255). Total 600 speech signals (100 speech signals for each emotion) are taken from EMO-DB database. 70% speech signals (total 420 speech signals, 70 speech signals per emotion) are used for training the classifiers while 30% speech signals (total 180 speech signals, 30 speech signals per emotion) are used for testing the classifiers. Following experiments have been performed for testing.
Experiment-1:
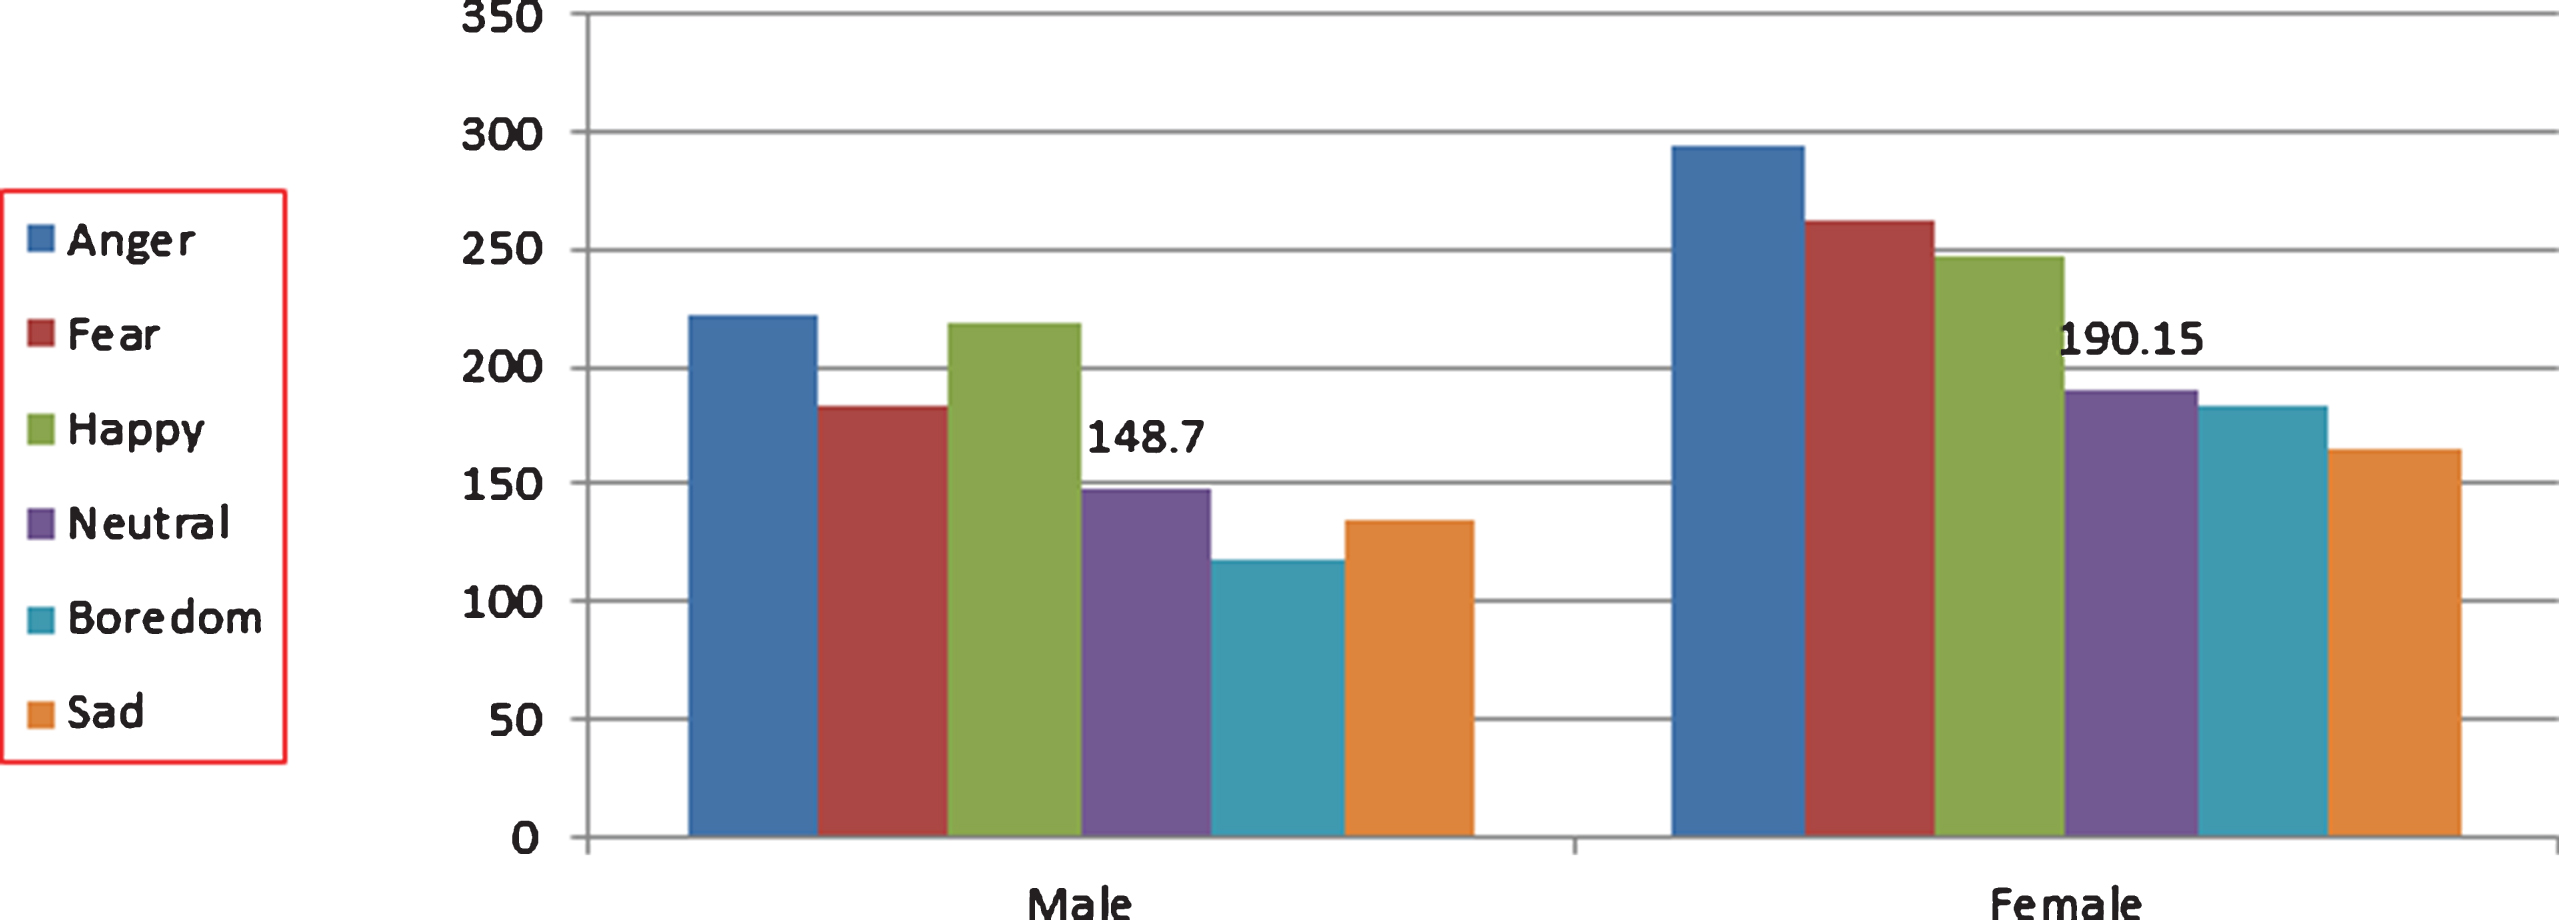
Total 180 speech signals are taken from database for testing where 30 speech signals are of one emotion. Half of speech signals belong to male speakers and remaining belong to female speakers. There are total 90 speech signals spoken by male speakers and remaining 90 by female speakers. Pitch values of testing speech signals (180 speech signals) are obtained using subharmonic to harmonic ratio method. Average pitch value is calculated for all the speech signals belonging to male and female speakers separately. Following observations are obtained:
It has been observed that with the help of pitch only the six emotions could be classified into two classes. One class contains emotions whose pitch values are higher than pitch value of neutral speech and other class contains emotions whose pitch values are lesser than that of neutral speech. Average pitch value of neutral speech thus partitions the whole set into two classes: one class containing anger, fear and happy emotions whose pitch values are greater than neutral emotion while other containing boredom and sad emotions having pitch values lesser than neutral emotion.
Table 1 shows the average value of pitch for male and female speakers. The average pitch values for anger, fear and happy emotions are greater than average pitch value of the neutral emotion while the average pitch values of boredom and sad emotions are lesser than average pitch value of neutral emotion.
Average pitch value of each emotion for male and female speakers
Average pitch value of each emotion for male and female speakers
Figure 7 shows the average pitch value of speech signals for each emotion spoken by both male and female speaker. The average pitch value of neutral speech signals for both male and female speakers divides remaining emotions into two classes. The average pitch values obtained from neutral speech of male and female speakers are mentioned in Fig. 7.
Pitch value in different emotions for male speakers and female speakers.
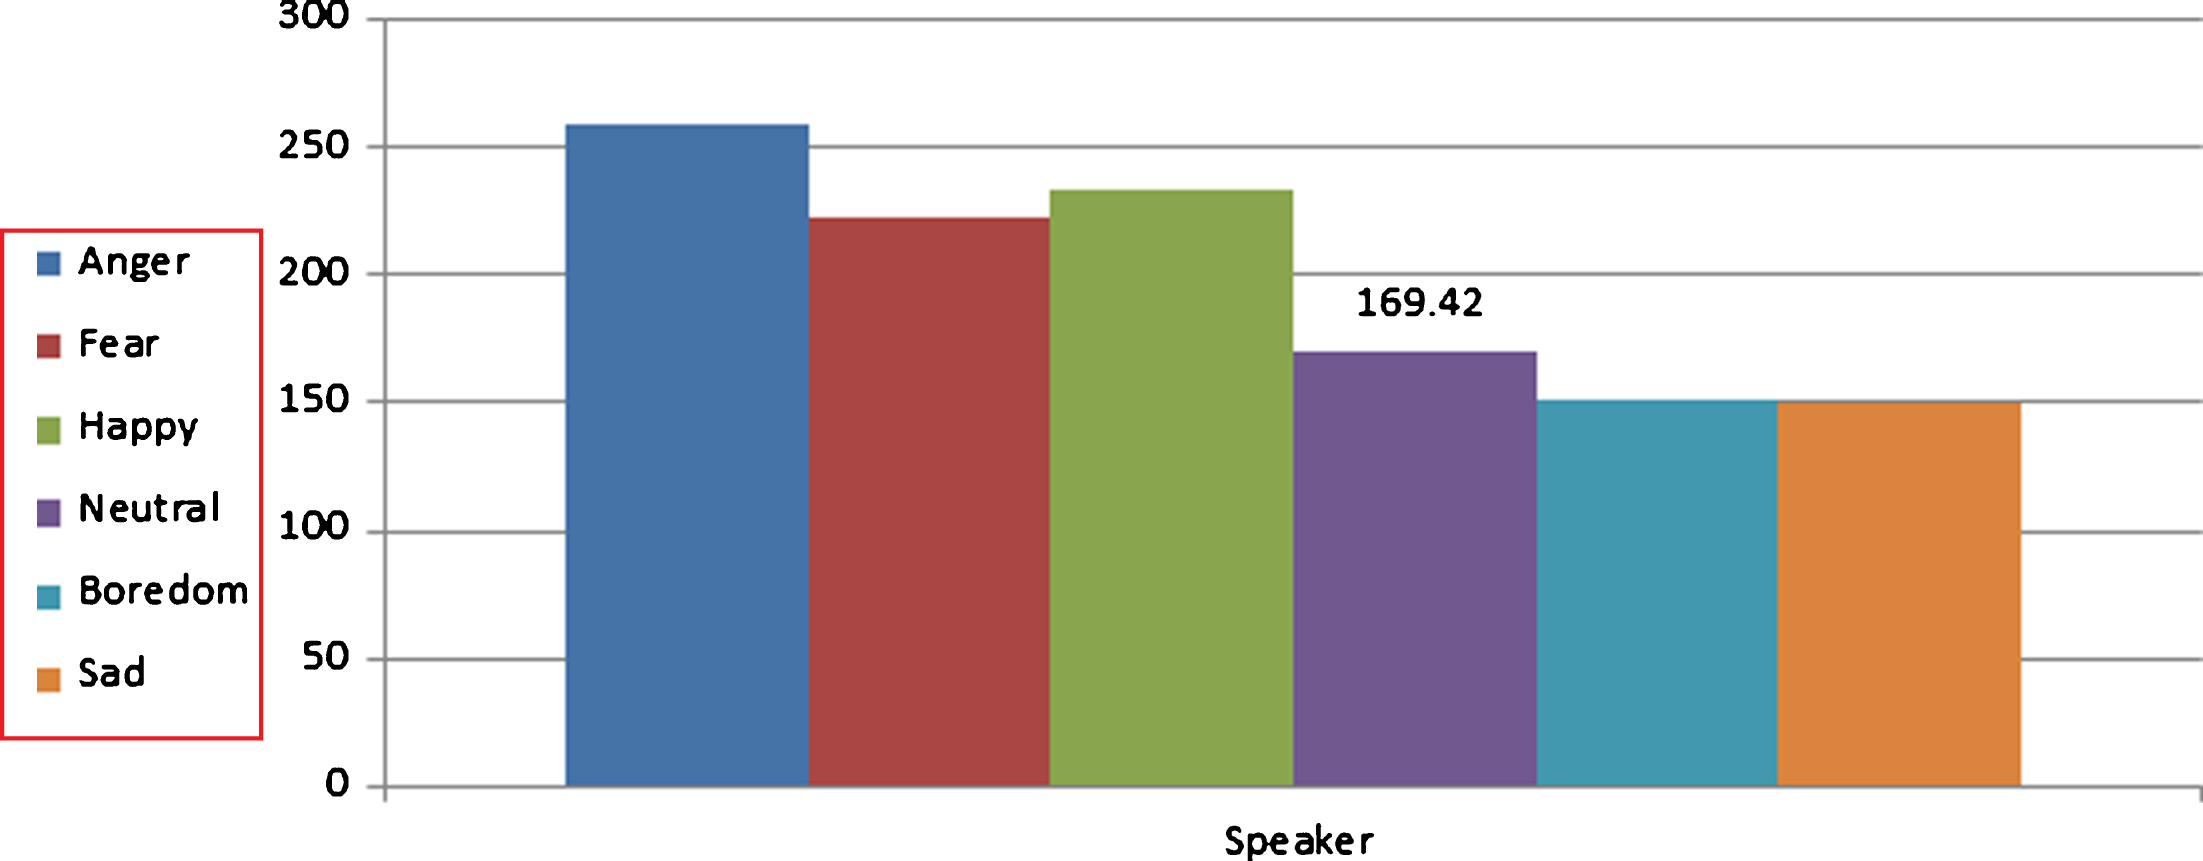
Table 2 shows the average pitch value irrespective of gender of speakers. For each emotion, average pitch value is calculated for all the speech signals. Following observations are made: The average pitch values of each of anger, fear and happy emotions are greater than average pitch value of the neutral emotion while the average pitch values of each of boredom and sad emotions are lesser than average pitch value of neutral emotion.
Average pitch value of each emotion for speakers irrespective of male or female
Figure 8 shows average pitch values of all the speech signals for each emotion irrespective of male or female speaker. The average pitch value of speech signals belongs to neutral speech is mentioned in Fig. 8.
Average pitch value in different emotions for speakers.
The results obtained from experiment 1 show that pitch value alone cannot recognize specific emotion of the speaker. Some other features are additionally required for correctly recognizing the emotions. Wavelet transform features- wavelet packet energy and wavelet packet entropy are used for recognizing the emotions along with pitch. The combined feature vector taken is of size 384 (1 for pitch, 128 for wavelet packet energy and 255 for wavelet packet entropy). Here two classifiers SVM and RF are used for recognizing the emotions from speech signals. Total 420 speech signals are used for training each classifiers. Pitch and wavelet packet transform features are extracted from all the 420 speech signals and then PCA is used to reduce the feature vectors. SVM and RF classifiers are trained using the reduced feature vectors. Remaining 180 speech signals (30 speech signals from each emotion) are taken for testing the trained classifiers. Both the trained classifiers are tested with reduced extracted feature vectors and error matrices are generated. Error matrices for both the trained classifiers are shown in Tables 3 and 5 which show how many emotions are correctly identified. Tables 4 and 6 show the recognized accuracy of each emotion with SVM and Random Forest classifier respectively. Table 7 shows the overall recognized accuracy.
Error Matrix of SVM classifier using Pitch and Wavelet Packet Transform features
Error Matrix of SVM classifier using Pitch and Wavelet Packet Transform features
Accuracy of each emotion with SVM classifier
Error Matrix of Random Forest classifier using Pitch and Wavelet Packet Transform features
Accuracy of each emotion with Random Forest classifier
Overall Accuracy Matrix
The objective of this experiment to determine the minimum duration of speech signal required to correctly recognize the speaker’s emotion. Samples in increasing order of their length are extracted from the starting point of speech signal for testing the trained classifier. The recognized accuracy with samples of different lengths are given in Table 8. Accuracy 83.95% is achieved taking 16000 samples (duration 1 sec) from starting point of speech. Accuracy in case of samples having length less than 16000 is found to be lesser than 83.95%. Hence minimum 1 second duration (16000 samples) is sufficient to recognize the emotion.
Accuracy of extracted speech samples of different length from starting
Accuracy of extracted speech samples of different length from starting
The objective of this experiment is to determine the proper location for the samples in speech signal from which emotion can be recognized correctly. Three locations are taken for the experiment at the interval of 8000 samples from starting point of speech signal. From each location, samples of size 2000, 4000 and 6000 are collected for the experiment. The results are shown in the Table 9. It is clear from table that the samples (around 6000) taken after the interval of 1 sec (16000 samples) from the start of speech gives the best result. It confirms that samples from middle part of speech signal gives better accuracy than samples taken from starting point.
Accuracy of extracted speech samples of different length from marked locations
Accuracy of extracted speech samples of different length from marked locations
The objective of this experiment is to confirm the angriness of speaker. The ratio of silence part and non silence part in any speech signal depends upon the emotion. Here we find out the relationship between ratio of silence and non silence part with emotion. Experiments have been performed on all the test speech signals taken from EMO-DB database. The equation 5 is used for calculating ratio. Speech signal with anger emotion contains more number of silence frames than speech signals of remaining emotions.
Table 10 shows the average ratio calculated from speech signals of male and female speakers for each emotion. Table 11 shows the average ratio calculated from all speakers irrespective of male or female. It is clear from above tables that the angriness is confirmed when average ratio is highest.
Average ratio of silence and non silence part for male and female speaker
Average ratio of silence and non silence part for all speakers
In 2009, Iliou and Anagnostopoulos [23] extracted prosodic features (pitch, energy and duration) from speech signals taken from EMO-DB database to recognized emotion. They recognized seven emotions (anger, boredom, disgust, fear, happy, neutral and sad) from speech signals with recognized accuracy 51%.
We have performed our experiment on speech signals having six emotions taken from same database. Prosodic feature (pitch) and wavelet packet transform features are extracted. As wavelet features contain both time and frequency domain information, when they are combined with pitch then we get more accurate results. The recognized accuracy in our experiment is 86.11%.
In 2009, Bozkurt et al. [7] recognized same set of emotions (anger, boredom, fear, happy neutral and sad) as recognized by us from speech signals. They claimed recognized accuracy of 63.03% with HMM classifier while our accuracy is 86.11% with Random Forest classifier.
Conclusion
Emotion recognition is a growing research area as it is very helpful in smooth working of many areas. In this paper, six basic emotions of the human beings are recognized from the speech signals. Recognition of emotion using information available from both time and frequency domain are analyzed taking combination of prosodic and wavelet features. Random Forest is found to be more appropriate classifier as compared to SVM. The accuracy obtained here is better than state of the art works available in the literature using the same EMO DB database and same set of emotions.
In future, we plan to use some more properties of male and female speakers to enhance the accuracy. Some properties of male and female speakers are different. For robustness of proposed system, we will test our proposed approach on database containing real life and noisy speech signals.