
Abstract
Due to the poor image quality and complex enhancement process in the current image contrast fuzzy enhancement algorithm, a multilevel image contrast fuzzy enhancement algorithm in multimedia network based on homogeneity measurement was put forward. This algorithm used the minimum fuzzy entropy to detect noise in multilevel image and remove noise through improved Shannon entropy, so as to achieve restoration of multilevel image. According to the membership degree of restored image, the local feature of image was determined to realize and the homogeneity expression of image. Then, the nonlinear transformation was introduced to optimize the image homogeneity. Thus, the multilevel image contrast fuzzy enhancement in multimedia network was realized. Experimental results show that the proposed algorithm can effectively guarantee the image quality after the contrast enhancement and reduce the computational complexity.
Introduction
With the rapid development of computer technology and Internet, the multimedia data communication technology develops rapidly [1]. The simple text and voice communication cannot meet the daily needs of people. The multimedia communication brings profound changes to learning environment, daily life and working way of people [2]. The requirement for image quality is rising. Due to the influence of scene condition, status and imaging equipment, the quality of image is reduced. Therefore, we need post-enhancement for the contrast of fuzzy image [3]. The combination of fuzzy theory and image contrast enhancement has received attention from more and more researchers [4]. The image contrast fuzzy enhancement algorithm is to input a given fuzzy image to improve the image contrast through revising some attributes of image [5]. In this process, one or more attributes of image are modified, and the selection of these attributes depends on specific requirements [6].
Reference [7] puts forward an image contrast enhancement algorithm based on histogram optimization. The histogram equalization algorithm and the adaptive histogram equalization algorithm based on limited contrast are used to equalize initial images. The image histogram with global and local enhancement feature is obtained. Based on the selection of regularization parameters, the objective function is used to obtain the optimized histogram, and the histogram specification algorithm is used to enhance the contrast of optimized histogram and obtain the final enhancement result. However, this algorithm does not process images in the application process, leading to a large number of noises in images, which affects the quality of enhanced images. Reference [8] proposes an algorithm for image enhancement based on normalized scalar weight mapping and fusion algorithm. On the basis of 2D directional deviation, the measurement model definition of contrast and brightness is defined, and a scalar weight mapping model is built. Laplacian pyramid decomposition mechanism is introduced to get hierarchical structure of image, and then calculate Gaussian pyramid of weight mapping. Two pyramid fusion rules are defined to obtain the fusion pyramid. Finally, the fusion pyramid is used to complete image reconstruction based on measurement model and weight mapping model. However, this algorithm has over-treatment for images, resulting in the image distortion. Reference [9] presents an image contrast enhancement algorithm based on multi-scale Retinex. This uses the average template to replace the Gauss convolution template for image filtering, and improves canonical gain/offset correction algorithm which maps images on the display device. Thus, the image contrast is enhanced. However, this algorithm modifies the image properties too much, resulting in poor quality of image. Reference [10] proposes an image contrast enhancement algorithm based on Shearlet. Through Shearlet transformation, the image is decomposed into low frequency component and high frequency component. After Shearlet transform decomposition, the low frequency component is adjusted with multiscale Retinex (MSR), so as to reduce the influence of light on images. For the high frequency coefficients on different scale and directions, the threshold noise suppression is used to eliminate noise, and the fuzzy contrast enhancement for reconstructed image is carried out to improve the overall contrast. But, this algorithm is relatively complex. Reference [11] proposes an image contrast enhancement algorithm based on generalized linear system and unsharp-masking image. This algorithm uses bilateral filter and generalized linear subtraction to process images, and obtain detail layer and base layer of images. Through the contrast enhancement processing and adaptation gain processing for the detail layer and the base layer of images, the generalized linear addition is used to put both of them together, so as to realize enhancement of image contrast. However, the image details are blurred with this algorithm, resulting in poor quality.
For above problems, a contrast enhancement algorithm of multilevel image in multimedia network based on homogeneity measurement is proposed. The whole structure is as follows:
The minimum fuzzy entropy algorithm is used to detect noise in image, and the improved Shannon entropy is used to reduce noise, and the restoration of multilevel image is achieved.
The fuzzy entropy is used to construct the feature measure of image edge information. According to the feature measure, the homogeneity of information in image is described, and nonlinear transformation is introduced to achieve multi-level image contrast fuzzy enhancement.
From experimental results and analysis, the feasibility and effectiveness of fuzzy enhancement algorithm of multilevel image contrast based on homogeneity measure is proved.
To present the prospect on the basis of existing researches.
Material and methods
Multilevel image restoration based on minimum fuzzy entropy
In order to improve the quality of multi-level image in multimedia network, we need to filter image. Through the combination of fuzzy entropy and filtering, a corresponding physical model is built according to characteristics of multi-level image. The fuzzy entropy which can reflect the actual situation in image [12] is constructed, and image is recovered by the principle of minimum entropy.
The detection of noise points in image is realized based on the local characteristic of pixels. The greatest feature of noise [13] is that the only a part of gray values of pixels in image are affected, and other gray values are unchanged. Moreover, this gray value has great difference with gray value of pixel in the neighborhood. The gray value is close to the maximum or minimum gray value. Whether the point is a noise point is determined by analyzing the gray values of pixel points on different directions.
A rectangle window W5 (i, j) with the size of 5 × 5 is selected. The center point is set in (i, j) and gray value of center point is x (i, j), and the noise is distributed randomly and irrelevantly in the image. But the pixels in image along the edge have similar gray. Based on edge features, noise points at the edge of image and effective point can be distinguished. Thus, the rectangular window is divided into four sub-windows, which are shown in Fig. 1.
Shape of child window.
Use the detection window for convolution operation of master plate [14], thus:
In above formulas, w1, w2, w3 and w4 denote four directions of convolution. Supposing that the minimum value of w1 absolute value is noise detection value of pixel point (i, j), it is expressed by w (i, j), thus:
If the pixel point (i, j) is not the salt-and-pepper noise or it is the edge of image, the w (i, j) value of this point in four directions is small. The threshold is set as t. If w (i, j) > t, it can be judged that this point is a salt and pepper noise point.
Shannon entropy [15] is applied in the process of noise detection, and the formula is:
x represents the noise distribution. From the above formula, the maximum of Shannon entropy is
The above formula is an improved formula of Shannon entropy. When x = m, m ∈ [0, 1], H
m
(x) reaches the maximum. When Varying curve of Shannon entropy. Modified varying curve of Shannon entropy.

From Fig. 3, the improved Shannon entropy breaks up limitation that traditional Shannon entropy gets the maximum value when
In order to break up this limitation and realize multilevel image denoising, a n × n window W
n
(i, j) whose center is in (i, j) is taken from the gray value matrix of multilevel image.
The window W is taken as the discourse domain, the elements in the window are arranged from small to big, which are divided into three groups. The average gray level of each group is a, b and c, respectively. The fuzzy membership degrees [16] of fuzzy set A, B and C are:
To calculate the fuzzy entropy measure, thus:
Three fuzzy entropy measures e a (A), e b (B) and e c (C) are calculated according to the pixels in the same window W n (i, j). The principle of minimum fuzzy entropy measure image is used to reduce noise of image. That is to say, if the minimum value is e a (A), then x (i, j) = a. If the minimum value is e b (B), thus x (i, j) = b. If the minimum value is e a (A), thus x (i, j) = c.
According to the description process, it is necessary to use the information of the regional information of window effectively in order to realize the restoration of multilevel image. If the gray value of most of pixels in a window W n (i, j) is c, e c (C) is minimum in e a (A), e b (B) and e c (C), then x (i, j) = c. So that this treatment will conform better with the real situation.
The key point to realize the fuzzy enhancement of multi-level image contrast in multimedia network [17] is to determine the relevant information measure and realize the definition of homogeneity. The fuzzy theory and the fuzzy entropy information are used to construct information measure of image with better performance of edge detection, which is used to quantitatively describe the three substantive characteristics of edge points in image characteristics: the gray level distribution in neighborhood is orderly and directional. And the grayscale mutation has structural property. The membership function can be expressed as:
In the above formula, C is a constant, which is used to ensure u m (x (i, j)) ∈ [0.5, 1]; m denotes the eigenvalue. Through the above formula, the membership degree of image pixels and their regions is calculated. The smaller the difference, the bigger the membership degree, on the contrary the smaller the membership degree.
The fuzzy entropy is used to calculate the gray value of image:
In order to measure the fuzziness of fuzzy set of image, the fuzzy entropy measure [18–20] is defined as:
The neighborhood gray values of image pixels have different distributions at the edge area and non-edge area. According to this characteristic, a fuzzy entropy measure is defined to express the orderliness of this gray distribution. The window whose center is (i, j) is selected from the gray level matrix of image, and the neighborhood consistency information measure R (i, j) is defined through this window.
From the above formula, when the center point is at the edge point, the difference of gray level of window is large, then R (i, j) is large. When it is in the non-edge point, it is small. This value reflects the characteristic of orderliness of regional gray level, which is called the ordering measure.
The gray level of image changes violently at the edge. The gray gradient is used to describe its change. In the neighborhood R = {(k, l) ||k - i| ≤ L, |l - j| ≤ L} which takes (i, j) as the center, L is the half of neighborhood length, and l
k
is a straight line passing the midpoint whose angle is ψ
k
, and this neighborhood is divided into Sk1 and Sk2, where, u
m
(x (i, j)) ∈ [0°, 180°]. Thus, the structural information measure Q (i, j) is defined as:
Where, g (p, q) denotes the gradient amplitude value, which can be calculated by following formula.
Where, E
s
k1
and E
s
k2
can be calculated through following formulas.
When Q (i, j) obtains the maximum value, it must pass the edge in the neighborhood, and the l k direction is the same as the trajectory of edge.
According to the structure nature of edge, we can know that it is in this neighborhood and edge trajectory, and gradient values of pixel points in the same direction tend to the maximum value. Then, the average gradient amplitude value Q (i, j) along the edge trajectory is approximately equal to the gradient amplitude value at current pixel point (i, j). But, it is irrelevant to the direction of l k in the smoothing region. Q (i, j) will tend to a smaller value, which is equivalent to the gradient value of corresponding point. From above characteristics, we can see that the edge information can be determined by characteristics of gradient value.
The directional information measure M (i, j) is:
If the edge of center point was existed in the current neighborhood, when the l k direction is along the edge trajectory, the value of M (i, j) is larger. If it is in the smoothing area, the value is small. This reflects the directionality of gray distribution in edge points.
According to the three measures of edge information above, the homogeneity is defined by the homogeneity definition model. The three measures R, Q and M are set. After three measures are normalized, the normalized component is between [0, 1]. R, Q and M are divided by maximum values Rmax, Qmax, Mmax obtained in the respective neighborhood, thus, R, Q and M are the normalized results.
From the above three measure components, if the gray values in the neighborhood are exactly the same, thus, the values of R, Q and M are 0. Otherwise, it is approximate to 1. The function which is made up of three measure components is used to describe the homogeneity. Thus, the homogeneity can be expressed as:
In the above formula, g
ij
denotes the pixel gray value. w
ij
denotes the window whose center point is (i, j). For the convenience of calculation, HO (g
ij
, w
ij
) is normalized. HO
ij
= HO (g
ij
, w
ij
) is set. The normalization process is as follows:
Where, HOmax = max {HO
ij
}. In order to enhance image contrast, we need to define non-homogeneity:
According to the above formula, the ψ
ij
is calculated. The value of ψ
ij
is related to the distribution in region. The larger the value, the more uneven the distribution is. According to the distribution result, the mean value of non homogeneous gray value in window is calculated.
In the above formula, g
pq
denotes the gray value of pixel (p, q). According to the above formula, the contrast is defined, thus:
For the selection of nonlinear function f (x), the influence of nonlinear transformation function on the processing effect should be considered. If |f (x) - x| is relatively small, the detail of image cannot be obviously highlighted. If |f (x) - x| is large, the noise will be highlighted. The polynomial function f (x) =4x - 6x2 + 4x3 - x4 is used, and this function satisfies f (0) =0, f (1) =1, f (x) ≥ x.
In order to achieve the enhancement of fuzzy contrast of multi-level image in multimedia network based on homogeneity measurement, it is necessary to perform the nonlinear transform and exponential transformation on the contrast. The specific formulas are as follows.
In above formulas, ξ
ij
denotes the amplification coefficient of contrast.
From the above formula, when the gray value is higher than the mean value of non-homogeneous gray value, it will be enhanced, and when the gray value is lower than the mean value, it will be weakened, so then the modified image contrast is obtained, and the effect of contrast enhancement is achieved.
In order to prove the application effect of contrast fuzzy enhancement algorithm of multi-level image in multimedia network based on homogeneity measurement, an experiment was carried out. In the process of experiment, some standard images with a size of 512 × 512 was selected for testing. These images include Aerial, Crowd, Parrot, Monarch. These images were blurred through low-pass filter. The image was shown in Fig. 4. The improved multi-scale Retinex algorithm was used to enhance the image contrast and compare enhancement effect. The PSN (dB) performance of each contrast enhancement algorithm is compared as shown in Table 1.
Blurred image. Comparison of PSNR performance for each enhancement algorithm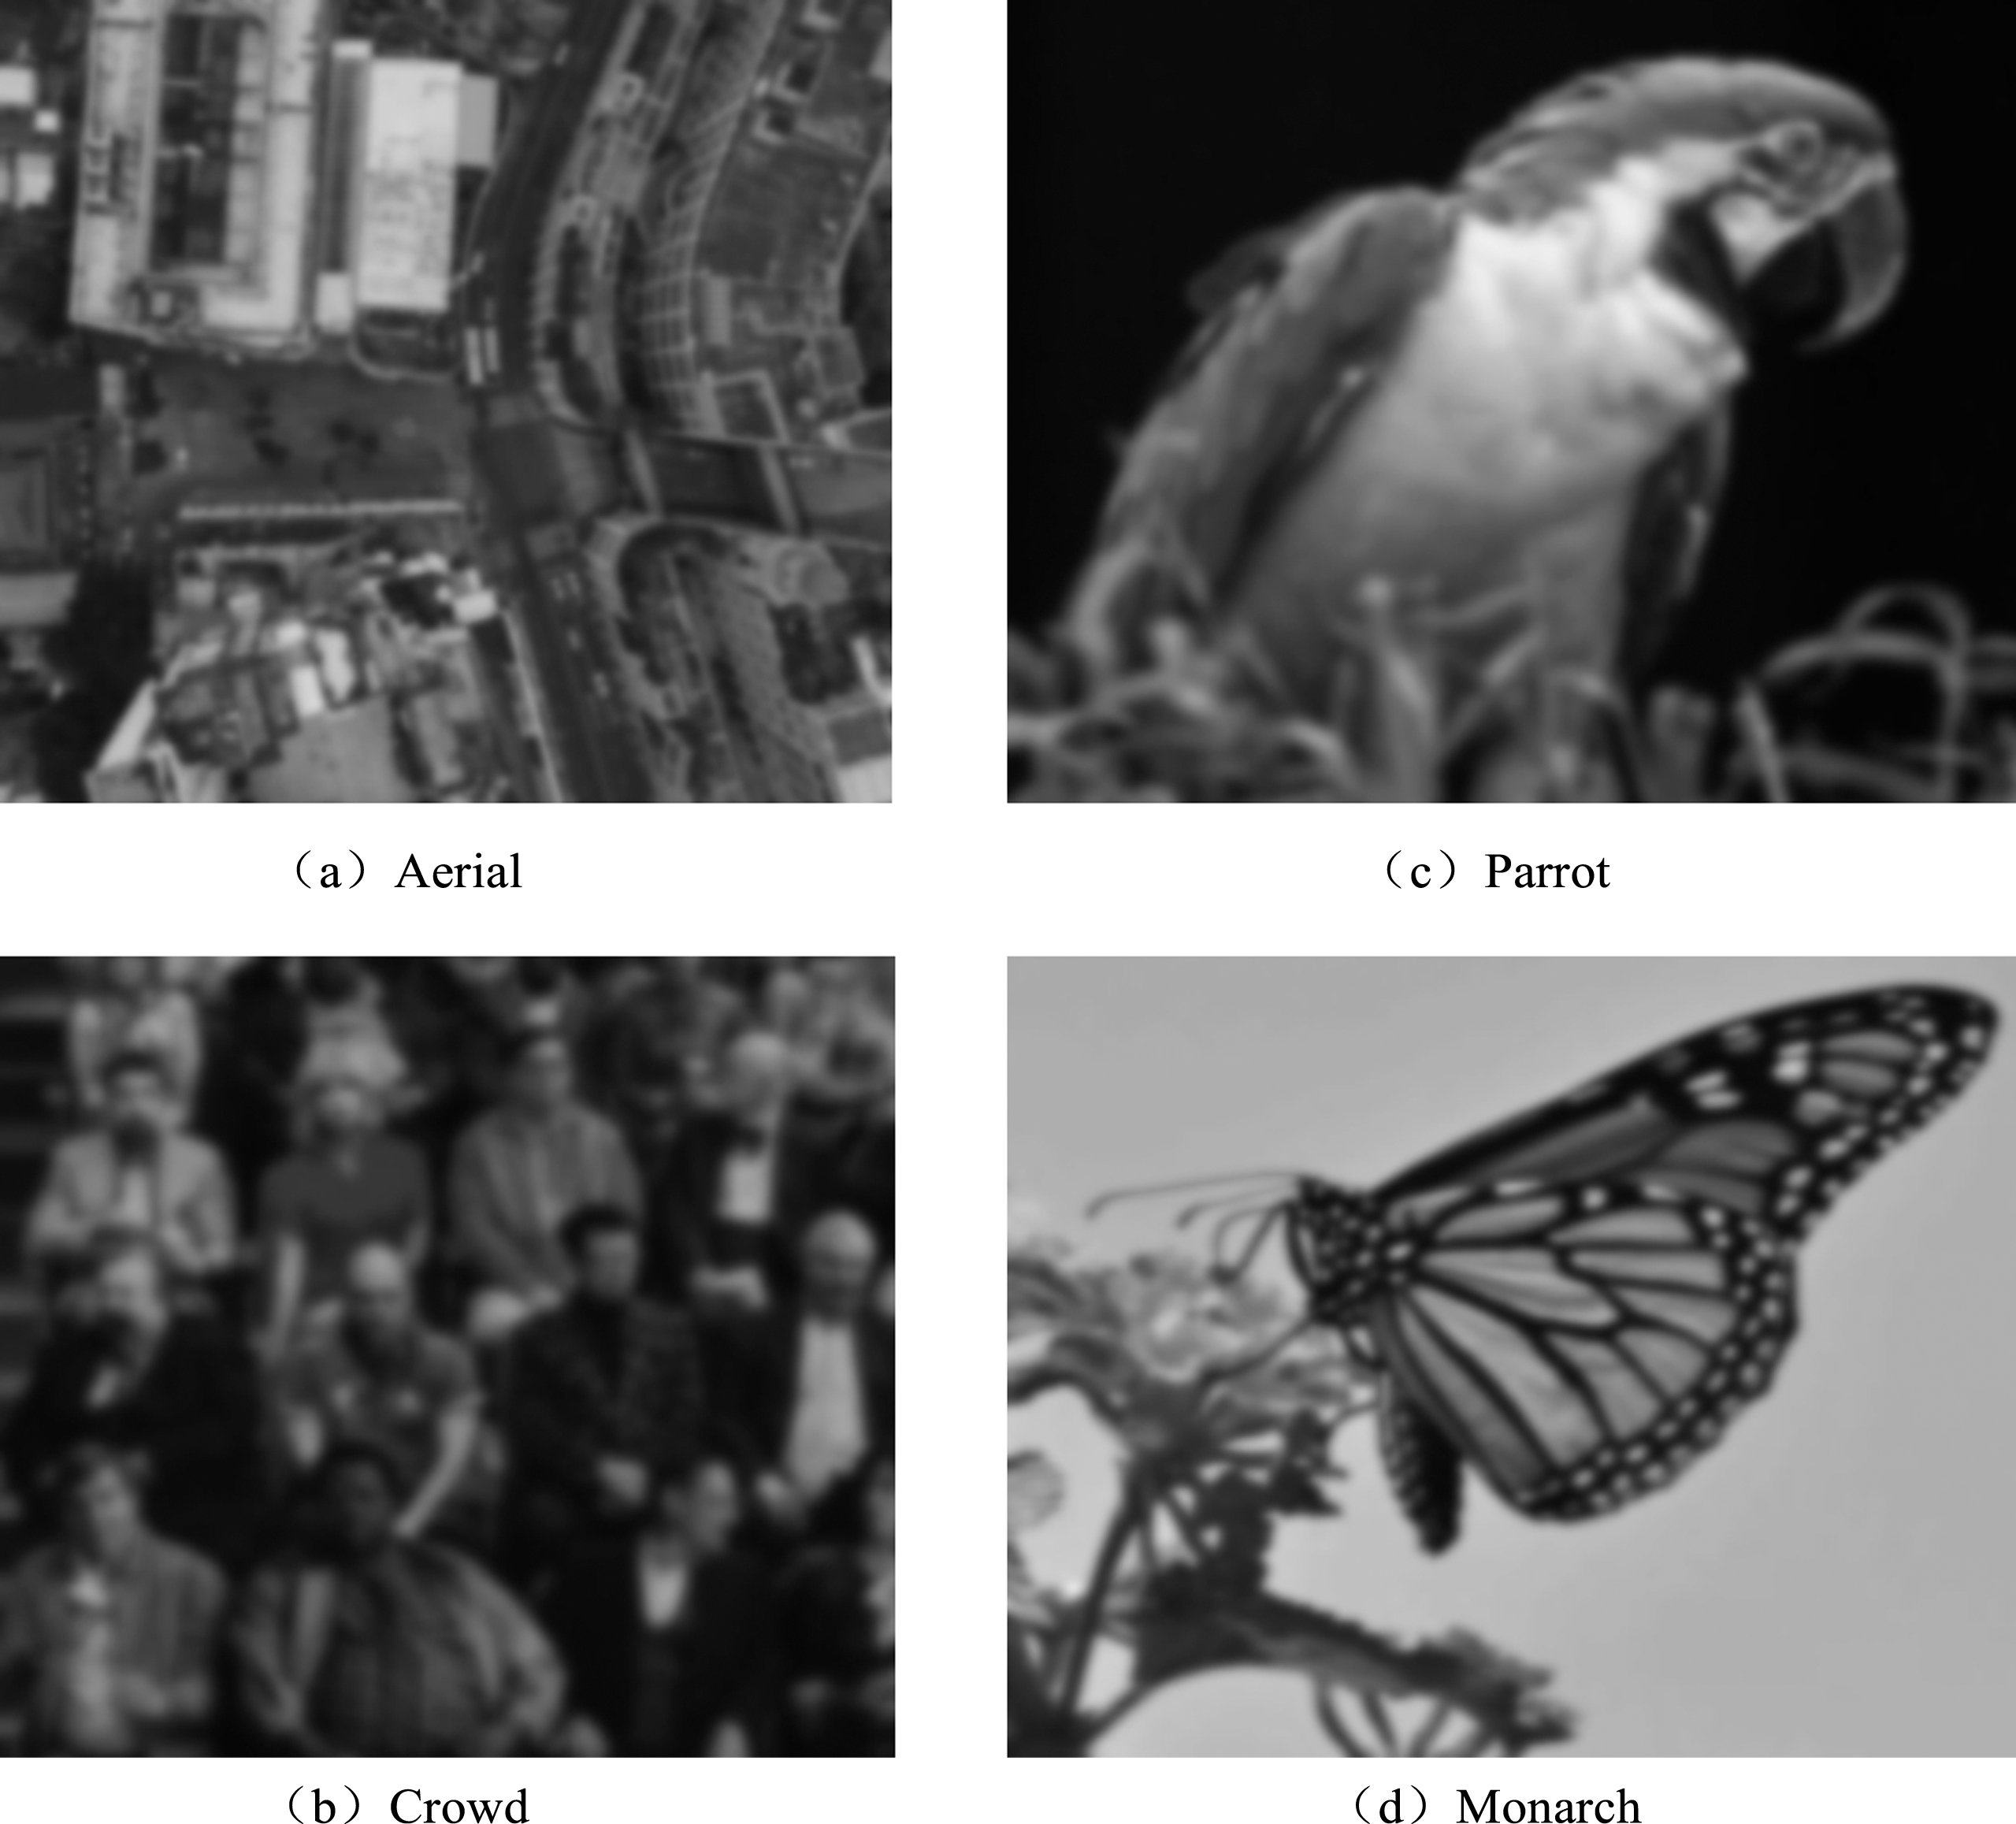
From Table 1, different algorithms were used to enhance image contrast. After the image contrast enhancement algorithm based on homogeneity measure enhances image, PSNR performance was good, and image definition was high. It showed that the image contrast enhancement algorithm based on homogeneity measure has good enhancement effect. In order to compare and observe the enhancement effect subjectively and intuitively, different algorithms were used to enhance image contrast. The result was shown as shown in Fig. 5.
From Fig. 5, after the improved multi-scale Retinex algorithm enhanced image contrast, the image definition was low. Combined the normalized scalar weight mapping with fusion pyramid algorithm, image contrast enhanced, and the image detail was fuzzy, which was not conducive to the collection of information details. However, using the image contrast enhancement algorithm based on homogeneity measure, the image definition was high, and the image quality was good, which was conducive to the collection of image information.
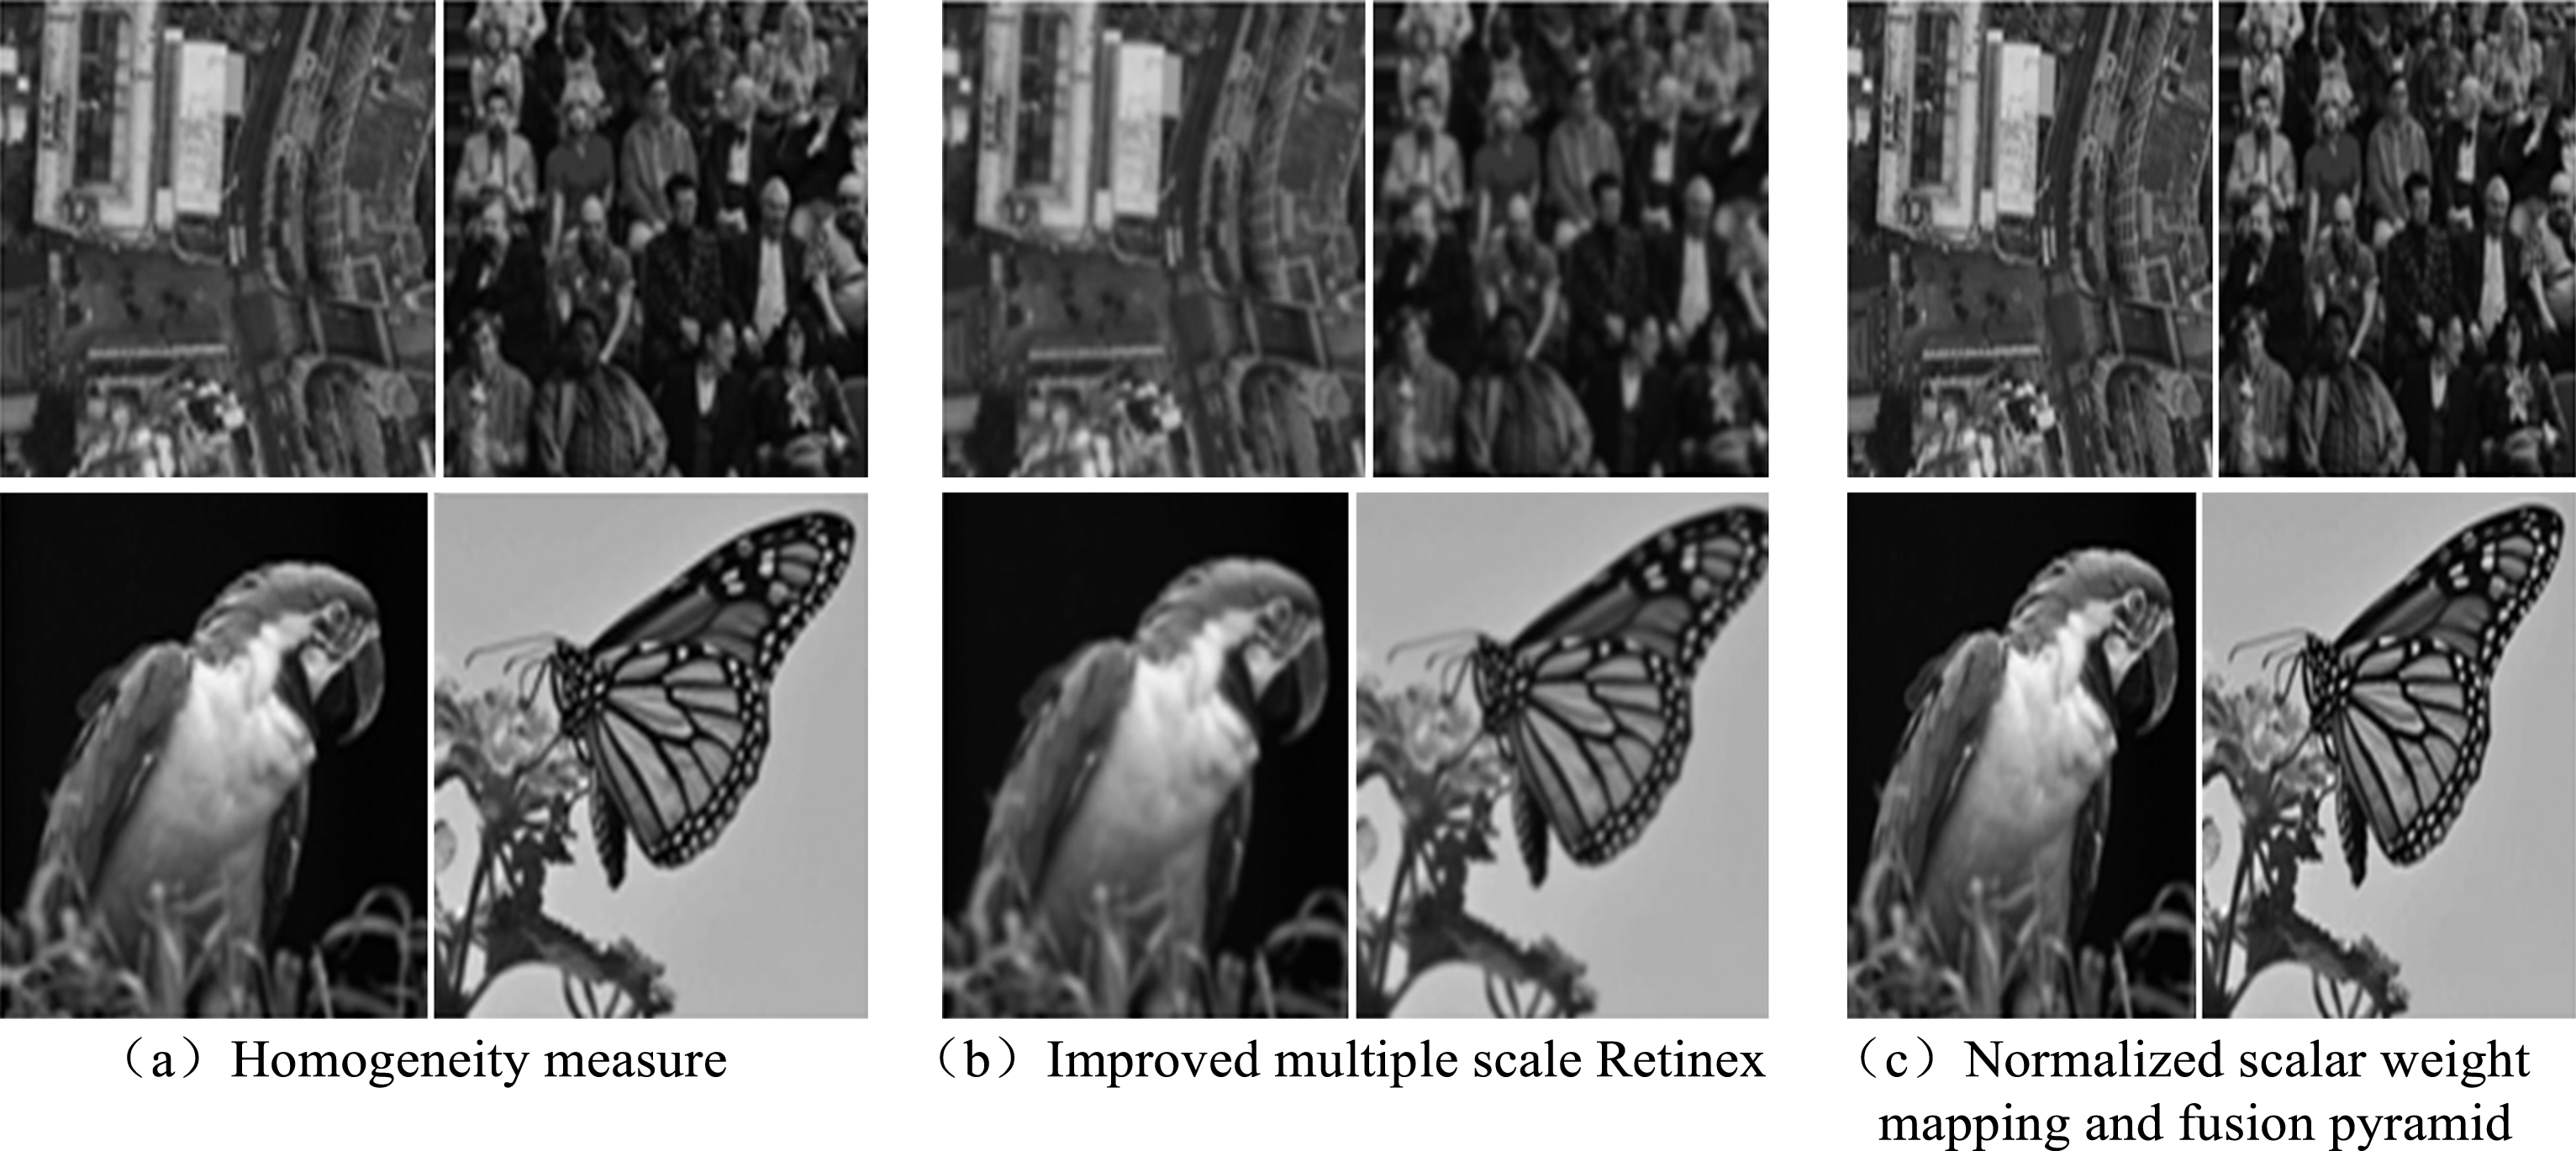
Comparison of contrast enhancement results with different algorithms.
Comparison of entropy values after contrast enhancement
From Table 2, after the image contrast enhancement algorithm based on homogeneity measure enhances the image, the entropy value was maximum, respectively, the value was 7.5415, 6.7358, 6.0154 and 7.1574. Through the percentage calculation, compared with the entropy values of four original fuzzy images, the image entropy value enhanced by image contrast enhancement algorithm based on homogeneity measurement of the degree of homogeneity measurement increased 23.38%, 46.47%, 73.93% and 67.03%, respectively, which showed that the image contrast enhancement algorithm based on homogeneity measurement has the good effect of contrast enhancement.
In the experiment, the execution time (s) of image contrast blurred enhancement was obtained by different algorithms. Then, the execution time was used to compare computational complexity of algorithm. In the process of experiment, the contrast enhancement of different images was realized through different algorithms, and the execution time (s) was determined. The result was shown inTable 3.
Comparison of execution time with different algorithms
With the increase of images in multimedia network and requirement of image quality, more and more experts and scholars pay attention to the research of image enhancement in multimedia network. As an important content of image enhancement, the research on multilevel image contrast enhancement is deepen constantly. For the problems of the complexity of image enhancement and the poor quality of image enhancement, this article proposes a multilevel image contrast fuzzy enhancement algorithm based on homogeneity measure. Experimental results show that using the proposed algorithm, the image quality is good and the enhancement process is simple. However, there are many problems about multilevel image contrast enhancement algorithm in multi-media network to be studied and explored.
The self-adaptation problem of image contrast enhancement. The color of object is influenced by the light source color, the human eyes have the self-adaptability. No matter in the sun or thick weather, or in the indoor lighting condition, they can see white objects as the white. For image contrast enhancement, most of enhancement algorithms are designed for specific applications, which cannot adaptively adjust the parameters in the algorithm. Combining the working principle of visual characteristics of human eyes with image enhancement technology, the adaptive problem of image will be solved in a certain extent, and the enhancement effect will be better. The image contrast enhancement algorithm based on self adaption is a developing trend.
The use of additional information. For the image contrast enhancement algorithm which has developed a certain degree a certain extent, to change algorithm parameters and even adjust the structure of algorithm cannot improve the image contrast enhancement effect. It is necessary to introduce the prior information of image and use it effectively to improve the image contrast enhancement effect.
The use of many mathematical tools. When the image contrast enhancement is carried out, with the exception of space domain and frequency domain enhancement algorithm, many new mathematical tools, such as neural network, genetic algorithm, partial differential equation, mathematical morphology, theory of fuzzy set, theory of convex optimization and image fusion are applied to image enhancement algorithm.