
Abstract
Market Segmentation has been a key area of implementation of soft computing techniques in E-commerce applications. Various techniques have been used to achieve maximum results in the classification of the ecommerce market. From stochastic techniques to neural networks, there is a plethora of techniques that have been applied. In this paper, we use self organising Maps (SOMs) an unsupervised learning technique to study the various factors which can be used to segment the market. On the other hand supervised learning techniques such as Nearest Neighbour (NN) and Support vector machine (SVM) are used to quantitatively classify the purchase behaviour based on various factors. The better classification technique is identified through appropriate measures. Further, evolutionary algorithms are used to augment the performance of these classification techniques. Analysis of the results and various factors affecting it is also performed.
Keywords
Introduction
Market segmentation is a marketing strategy which involves dividing a broad target market into subsets of consumers, businesses, or countries that have, or are perceived to have, common needs, interests, and priorities, and then designing and implementing strategies to target them. Market segmentation is critical for a good marketing and customer relationship management program [1–5]. A fundamental task of market segmentation is to group customers based on similarities in their needs and preferences, and clustering is a common tool for such purpose [6]. The paper proposes a visualization approach based on SOM to be applied to market segmentation. This has advantages over other clustering methods such as easiness to understand and ability to reveal mutual relationships among different customer’s characteristic variables.
Over the years, with the advent of internet and new media channels, there has been a shift from mass marketing to direct marketing. Thus, instead of applying the same strategy for the masses, specialised and targeted marketing has come into picture [7–9]. Direct marketing necessitates the need for identifying various groups and hence market segmentation will be the first step in formulation of market related strategies or development of a new product.
Various factors can be used to segment the market such as demographics, purchase behaviour information, consumption behaviour information, age, gender and occupation. It must however be noted that for each market, different characteristics may be used to effectively characterise a group [10, 11]. For example, the things that need to be kept in mind while segmenting the market for drugs to doctors may be entirely different to that needed to segment say the smart phone market. We thus see that for different markets different characteristics of its customers need to be exploited.
With the internet penetration increasing at a break neck speed, the Indian e-commerce market can only grow. India, although has a very low internet penetration rate, it still is one of the market leaders in terms of the number of internet users [12, 13]. Thus, Indian e-commerce market is very lucrative. Artificial intelligence can help provide a better user experience and good recommendations based on user buying history, user buying capacity, etc. [14, 15]. The mobile phone and smartphone market is of particular interest in the e-commerce marketplace due to the increasing prevalence among all user groups [16–22]. In this paper, the characteristics of both the general e-commerce markets as well as the smartphone market are analysed.
The paper is organized as follows. Section 2 presents the artificial intelligence techniques used in this paper while Section 3 discusses the dataset used in this paper, Section 4 discusses the results obtained for market segmentation using various techniques. Section 5 gives the conclusion, followed by references.
Theory
Unsupervised learning
Self-organising maps
Self-organizing map (SOM) is an unsupervised neural network computational mapping technique that forms non-linear projection of high dimensional input data items to a low, often one- or two-dimensional grid. This allows SOM to be applied for the clustering of data, as it is capable of converting the non-linear relationships between high dimensional data into simple geometric relationships. This results in the data points that show similar properties being placed close to each other in the output of SOM algorithm.
SOM consists of a set of neurons which are arranged in a two-dimensional structure, in such a way that neighbourhood relationships exists among the neurons, which in turn decides the topology. The network of SOM usually consists of two layers of neurons: an input layer and output layer. The neurons on the input layer are fully connected to the neurons on output layer. No connection exists between fellow neurons on the same layer of the network. Output layer neurons are arranged in either a rectangular or hexagonal lattice. The use of a hexagonal lattice in the output layer often improves the performance of the SOM, as the hexagonal structure has more neighbours which are modified when compared with a rectangular lattice. An added advantage with the hexagonal lattice is that it has a more effective visual display.
In a SOM, each neuron is represented by an n-dimensional weight vector, m = [m1, …., mn]. The SOM is initialized by providing the values of weight vectors of each output neuron linearly or randomly. The training process of SOM starts by representing a data point randomly in the network. The distances between these data points and the weight vectors of all neurons are computed by using the Euclidean distance [23].
By comparing these distances, the nearest Kohonen neuron, is identified as the ‘winning’ neuron. The weights of the winning neuron are adjusted in order to get close to the actual data point. The weights of neighbouring neurons are also updated, so that the order of the input space can be satisfied. This provides topology preservation property of SOM. The process is repeated until all data points are assigned to an output neuron. While Kohonen’s Self-Organizing networks have been successfully applied as a classification tool to various problem domains, including speech recognition, image data compression, image or character recognition, robot control, and medical diagnosis, its potential as a robust substitute for clustering tools remains relatively unexplored [24].
Supervised learning
Supervised learning is the machine learning task of inferring a function from labelled training data. The training data consists of a set of training examples. A supervised learning algorithm analyses the training data and produces an inferred function, which can be used for mapping new examples. A few of the supervised learning techniques are as follows:
Support vector machines
Support Vector Machine also known as Support Vector Networks, is a universal feed-forward network pioneered by Vapnik. Like multilayer perceptron, support vector machines can be used for classification and non-linear regression. In terms of classification, the main idea of a support vector machine is to construct a hyperplane as the decision surface such that the margin of separation between the negative and positive examples is maximized [25, 26].
KNN
KNN or k-nearest neighbours’ algorithm is an algorithm which is utilized for classification and regression. It is a simple algorithm which stores all available cases and classifies on the basis of a similarity measure. It is used for statistical estimation and for pattern recognition as well. A case is classified by the majority vote of its neighbours; with the assignment done on the basis of the class most common among is K nearest neighbours’ measures by the distance function. If K = 1, the case is assigned to the class of its nearest neighbour [27].
An optimal value for K is best chosen by inspecting the data. However, a large K value is more precise. Cross- validation is yet another way to determine the optimum value for K. KNN or k-nearest neighbours’ algorithm is an algorithm which is for classification and regression. It is a simple algorithm which stores all available cases and classifies on the basis of a similarity measure. It is used for statistical estimation and for pattern recognition as well.
Evolutionary algorithms
Typically, various parameters of the SVM are randomly initialised before training. In this paper, the classification accuracy of SVM is augmented by using evolutionary algorithms for selecting various parameters of the SVM classifier. The use of evolutionary algorithms for the selection of these parameters makes it possible to search for the best possible values of these parameters that would yield better classification performance of the SVM. Two different algorithms are employed for this purpose – Particle Swarm Optimization (PSO) and Gravitational Search Algorithm (GSA).
In this paper, the kernel scaling parameter γ of the RBF kernel function of the SVM as well as the box constraint parameter, which affects the degree of separation of the data by the classifier, are optimised using the evolutionary algorithms. The correct classification rate is used as the fitness parameter for the algorithms. The SVM classifier initialised using the optimal values of the kernel scaling parameter and the box constraint as returned by each of these algorithms is expected to show improved performance over randomly initialised SVMs.
Particle swarm optimization
PSO is a metaheuristic algorithm proposed in [28] that simulates social behaviour in a bird flock or fish school. It optimizes a problem by iteratively trying to improve candidate solutions, called particles, using a given measure of fitness by moving them around in the search-space. Each particle’s movement is influenced by two factors – its own best known position and the globally best position among all particles in the population. This behaviour is expected to move the swarm toward the best solutions within the search space. The parameters of the PSO algorithm are selected so as to balance between the exploratory and exploitative behaviour of the algorithm and to avoid converging to a local optimum.
Gravitational search algorithm
In 2009, Rashedi et al. [29] proposed a new heuristic optimization algorithm called the Gravitational Search Algorithm (GSA) for finding the best solution in problem search spaces using physical rules. The basic physical theory from which GSA is inspired is Newton Theory of Universal Gravitation [30] which states that “every particle in the universe attracts every other particle with a force that is directly proportional to the product of their masses and inversely proportional to the square of the distance between them”. In GSA, a universe which spans the search space is populated by a collection of agents. The position of each agent corresponds to a candidate solution for the problem to be optimised. Each agent has an associated mass which is proportional to the value of fitness function at the location in space occupied by that agent. During each generation (epoch) all masses exert forces on each other based on Newton’s Law of Gravitation and move in the universe based on Newton’s Laws of Motion.
Comparison between PSO and GSA
In both GSA and PSO the agents move in the search space to perform optimisation, but both algorithms use different strategies to compute the movement. In PSO, the movement direction is determined based on two best positions – the best particle in the current epoch and the global best particle. But, in GSA the operation is completely memory-less and the force exerted by all the agents in the search space decides the direction of movement. Further, in PSO the position update does not take into account the fitness of the particle whereas in GSA the masses of the agents, and therefore the force between the particles depend on the fitness [31]. These differences enhance both the explorative and exploitative nature of GSA when compared to PSO, resulting in both faster as well as better solutions.
Dataset
Dataset description
The data used for this analysis is primary data acquired through a survey. The following fields of the questionnaire were considered while segmenting the Indian e-commerce market:
General market
The general dataset contained the following attributes which were taken as inputs: Age Gender State Designation Time spent on the internet Response Frequency of buying online Time preference for buying online Comparative preference to a physical store Effective frequency Preferences Criteria for Ranking
Smartphone market
Age Gender Economical products Better after sales Better Reviews Quality of products Frequency of buying a new mobile Brand loyalty Importance of Battery life Camera Price Ram Memory Price of Current Smartphone
Data pre-processing
The inputs to the various artificial intelligence techniques used in segmenting the market must be numeric values only. The data was acquired from the survey where answers were in the form of words or strings. Thus the data needs to be processed before it can be fed as inputs. Hence the data was modified and each string was assigned a numeric value.
For classification, the output parameter is considered as the quantity purchased in six months. The outputs are classified into two, where a quantity less than or equal to 3 is one class, and quantities greater than 3 is another. The dataset is further divided into training and testing samples for the purpose of using with various algorithms. The size of the datasets and the corresponding size of testing data are described in Table 1.
Datasets
Datasets
General market
Self-organizing maps
Under unsupervised learning we used the Self- Organising Map techniques for which we obtained the following results as shown in Table 2. Figure 1(a) shows the SOM topology along with the corresponding hits on each segment. Figure 1(b) shows the neighbour weight distances and Fig. 2 shows the input planes, which give a visualization of the neurons. The negative connections are shown as shades of blue, zero connections as black and positive connections as shades of red. The darker shades indicate stronger connections. The visualisations help in the identification of correlated components. a. SOM Sample Hits. b. Neighbour Weight Distances. SOM Input Planes. Number of Respondents per Segment SEGEMENT 1 (20 Hits)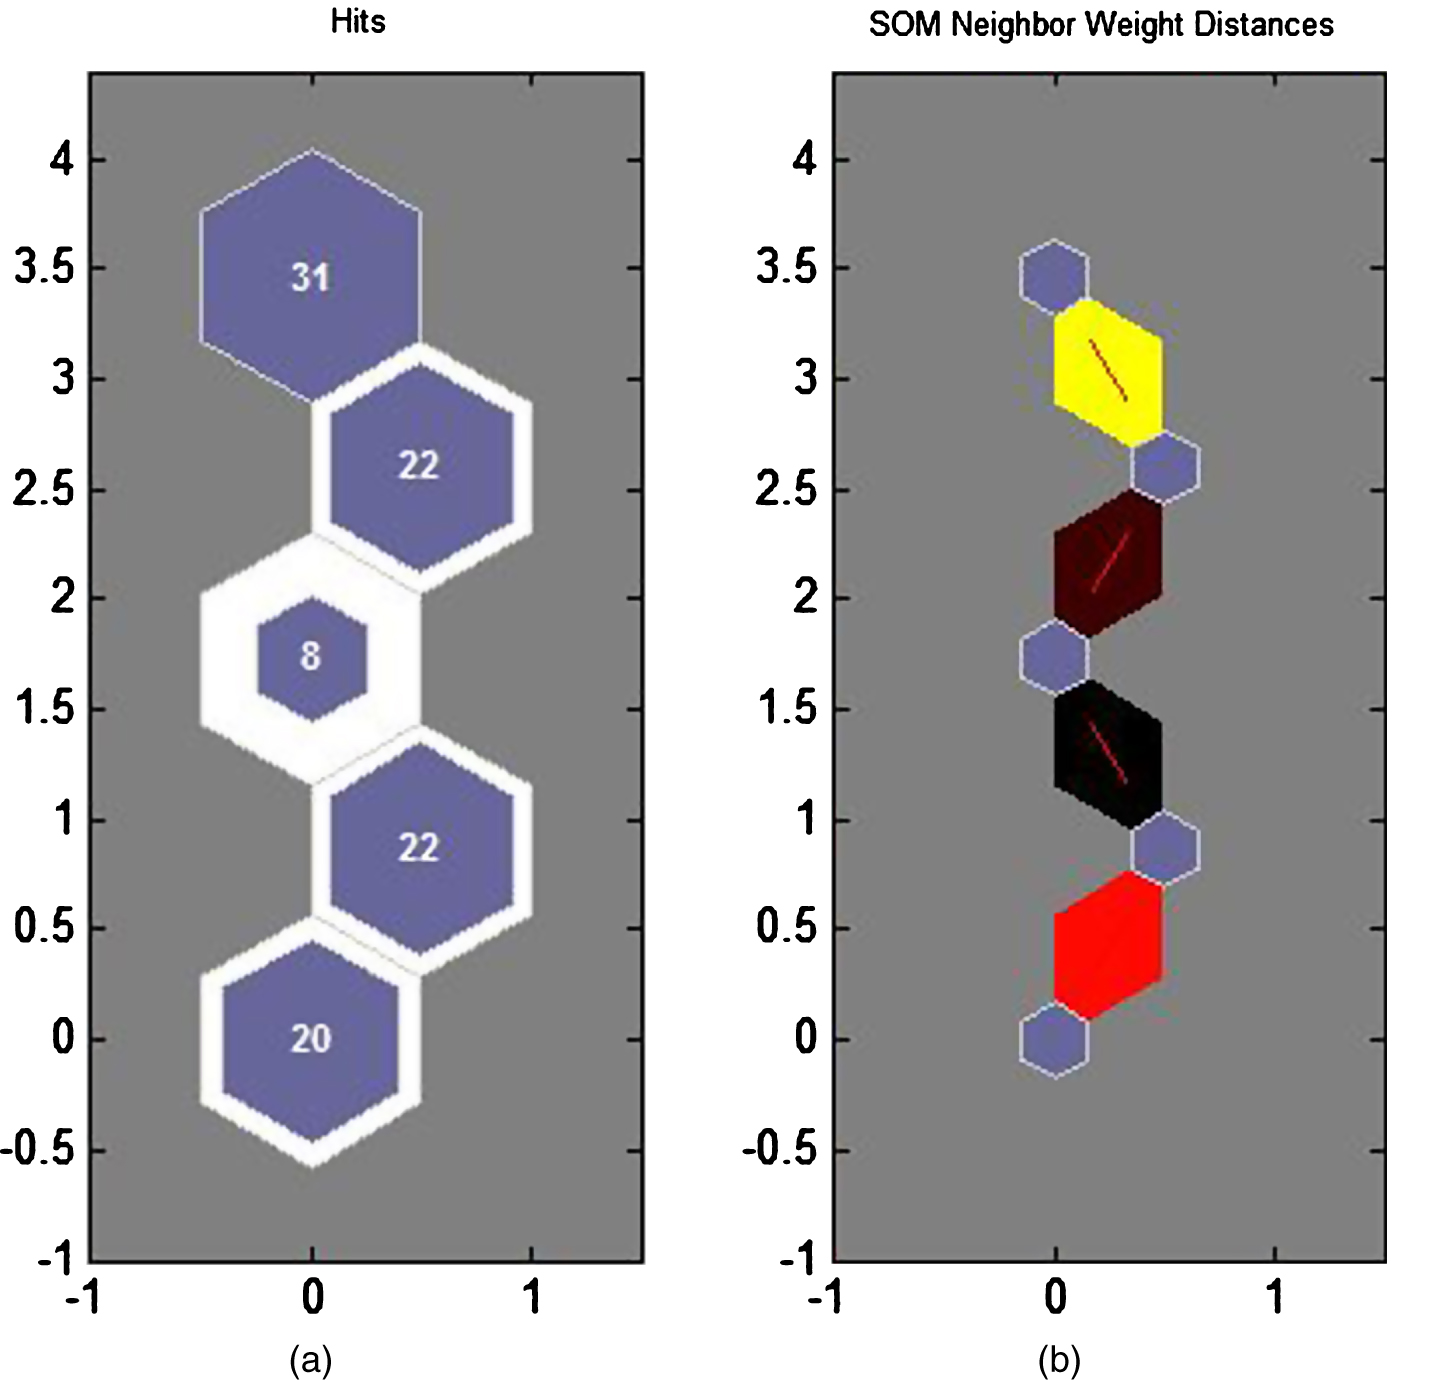

Most of the people in this segment are those who belong to age groups of 30+ years. These people spend moderate amount of time on the internet and shop online moderately as well. The shopping pattern is not affected by sales or discount period and this segment buys moderate number of items online. Input 9 has high weight thus this segment rarely prefers online shopping but feel that online shopping is convenient. Respondents here are not affected by the fact that online shopping is cheaper and find online vendors trustworthy with regards to both the quality of the product as well the economic risks. This segment’s prime concerns are the quality of products and their reviews whenever they buy a product online. SEGEMENT 2 (22 hits)
This segment consists of a mix of people with the age groups between 18–30, however this segment is male dominated who spend very less time on the internet. They mostly prefer to shop online during the sale season and they are stringent buyers, buying only when there is a need. For them convenience of online shopping is secondary, being cost conscious consumers, they will prefer online shopping only if it is cheaper and have concerns about the risks associated with online shopping. They will however buy a product only if it is of decent quality and has reliable return policy. SEGEMENT 3 (8 Hits)
This segment consists of youth who spend a lot of time on the internet and buy a lot on the internet. They are impulsive shoppers and are neutral towards buying online but find it convenient. They feel that the ecommerce vendors are not trustworthy and buy online only as the price is cheaper. For them quality is not an issue and only the cost matters. SEGEMENT 4 (22 hits)
This group consists of people of diverse age groups who spend considerable time on the internet. They find online shopping convenient as well as safe. This segment however buys from the internet only when the prices are economical. SEGEMENT 5 (31 hits)
This group has people of the age group 30+ who spend moderate amount of time on the internet. They feel there is a risk associated with buying online and thus prefer online shopping for getting good variety of products to choose from at competitive prices.
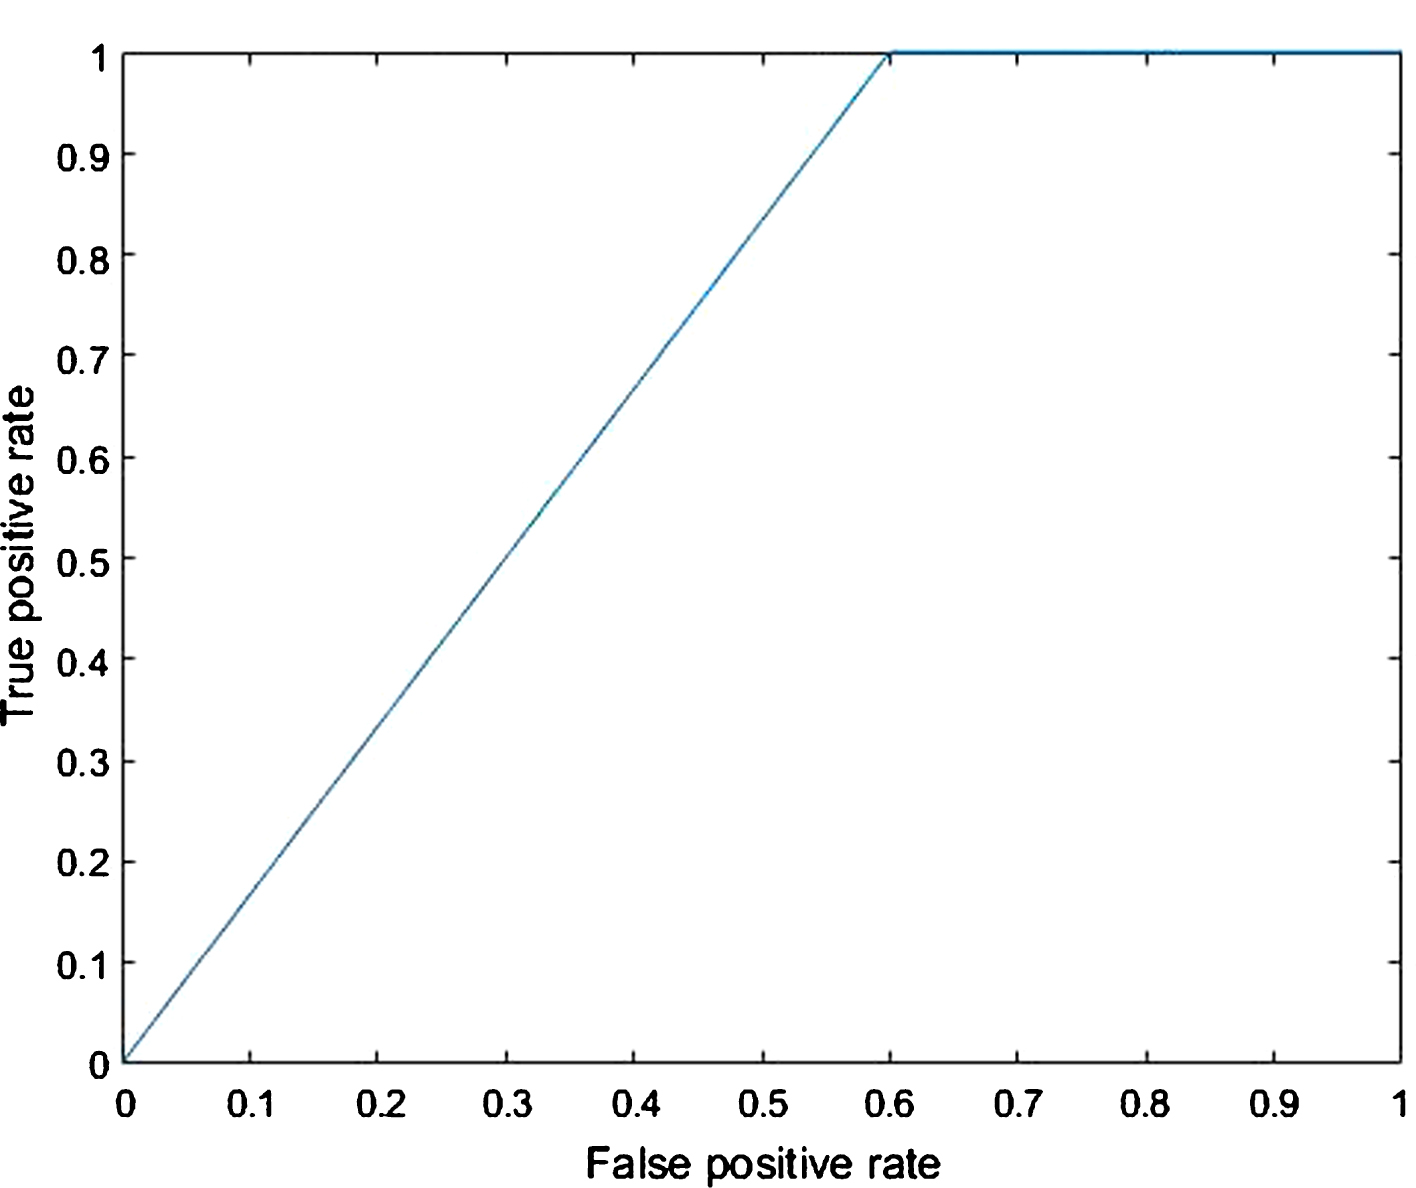
SVM and KNN were used for classification of the general market where the output classes are defined by the number of purchases made in six months. The data is grouped into two classes as discussed in Section 3. The confusion matrix and ROC were obtained for SVM based classification is shown in Figs. 3 and 4 and the same obtained for KNN based classification is shown in Figs. 5 and 6 respectively.

Confusion Matrix for General Market Segmentation using SVM.

ROC for General Market Segmentation using SVM.

Confusion Matrix for General Market Segmentation using KNN.
ROC for General Market Segmentation using KNN.
The correct classification rate (CCR) or accuracy for KNN is better than that of SVM. From the ROC curve, we can see that SVM has a specificity and sensitivity of 85.7% and 100.0%, whereas, KNN has 88.9% and 100.0%. The misclassification rate for SVM and KNN are 13.8% and 10.3%. The AUC of the SVM and KNN models are 0.5833 and 0.7000. From the AUC and ROC results we can conclude that the SVM model classifies the various fields randomly as compared to the KNN model since its AUC is much closer to 0.5 even though its sensitivity and specificity are quite high. Hence, from an implementation standpoint, we can conclude that the KNN model is a better classifier than SVM from the general market segmentation standpoint of view.
To improve the performance of the SVM based classifier, PSO and GSA techniques were employed. The algorithms are used to find optimal values of the kernel scale parameter and the box constraint parameter as discussed in Section 2. Both algorithms were run for 100 iterations with a population size of 20. The performance of the two algorithms in improving the correct classification is shown in Fig. 7.

SVM with PSO & GSA for General Market Segmentation.
As indicated in Table 3, the PSO optimised SVM classifier gives a CCR of 89.67%, which makes the performance of the SVM classifier comparable to that of the KNN based one. Further, when optimised using GSA, the CCR improves to 93.10%.
Comparison of Classifiers for General Market Segmentation
Number of Respondents per Segment
Self-organising maps
Under unsupervised learning we used the Self- Organising map techniques for which we obtained the following results as shown in Table 4. Further, Fig. 8(a) shows the SOM topology along with the corresponding hits on each segment. Figure 8(b) shows the neighbour weight distances and Fig. 9 shows the input planes which help in the identification of correlated components. SEGEMENT 1 (21 Hits)
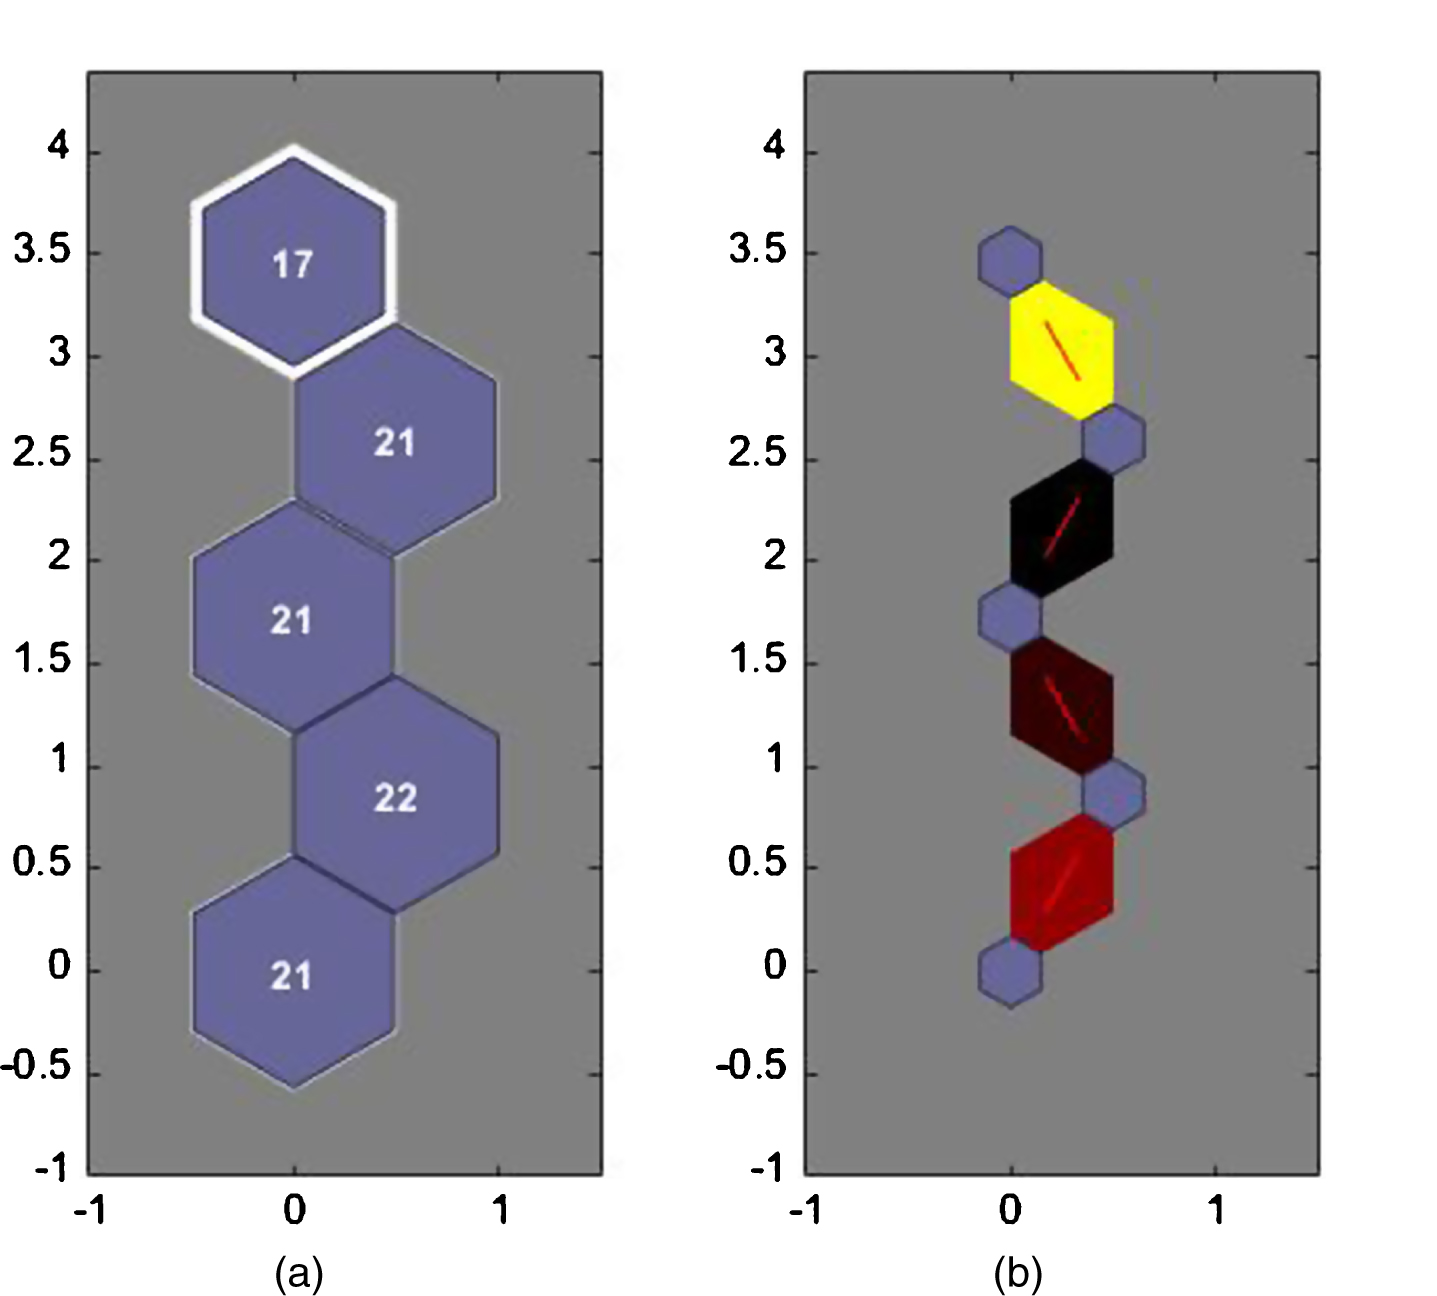
a. SOM Sample Hits. b. Neighbour Weight Distances.

SOM Input Planes.
Most of the people in this segment are those who belong to age groups of 30+ years and are mostly males. They prefer buying cheap but quality products when the website offers good number of choices. They generally change smartphones within a year and are loyal to their brands. They give high emphasis on battery life and a good quality camera. SEGEMENT 2 (22 hits)
This segment consists of mainly of young people in the age group 18–21, however this segment is female dominated who spend like to purchase economical products only if the reviews are good. They frequently switch between brands every 2 years or so. The main concern while buying phone is a good camera and decent RAM. SEGEMENT 3 (21 Hits)
This segment consists of diverse mix of age groups. For this segment quality products with good reviews are a prime criterion. They frequently change their phones with no affiliation to any brands. For them battery life, RAM and memory are the most important criterion for investing in a new smartphone. SEGEMENT 4 (21 hits)
This group consists of people mostly of 30+ age group with emphasis on quality products. They rarely change their handsets. They prefer buying quality phones which are also cost effective. SEGEMENT 5 (17 hits)
People in this group belong to wide range of age groups. They too rarely change their mobiles but when they do they prefer to buy the same brand. They are extremely loyal to their brands and prefer buying phones with good after sales services and which are economical.
SVM and KNN were used for classification of the smartphone market where the output classes are defined by the number of purchases made in six months. The data is grouped into two classes as discussed in Section 3. The confusion matrix and ROC were obtained for SVM based classification is shown in Figs. 10 and 11 and the same obtained for KNN based classification is shown in Figs. 12 and 13 respectively.
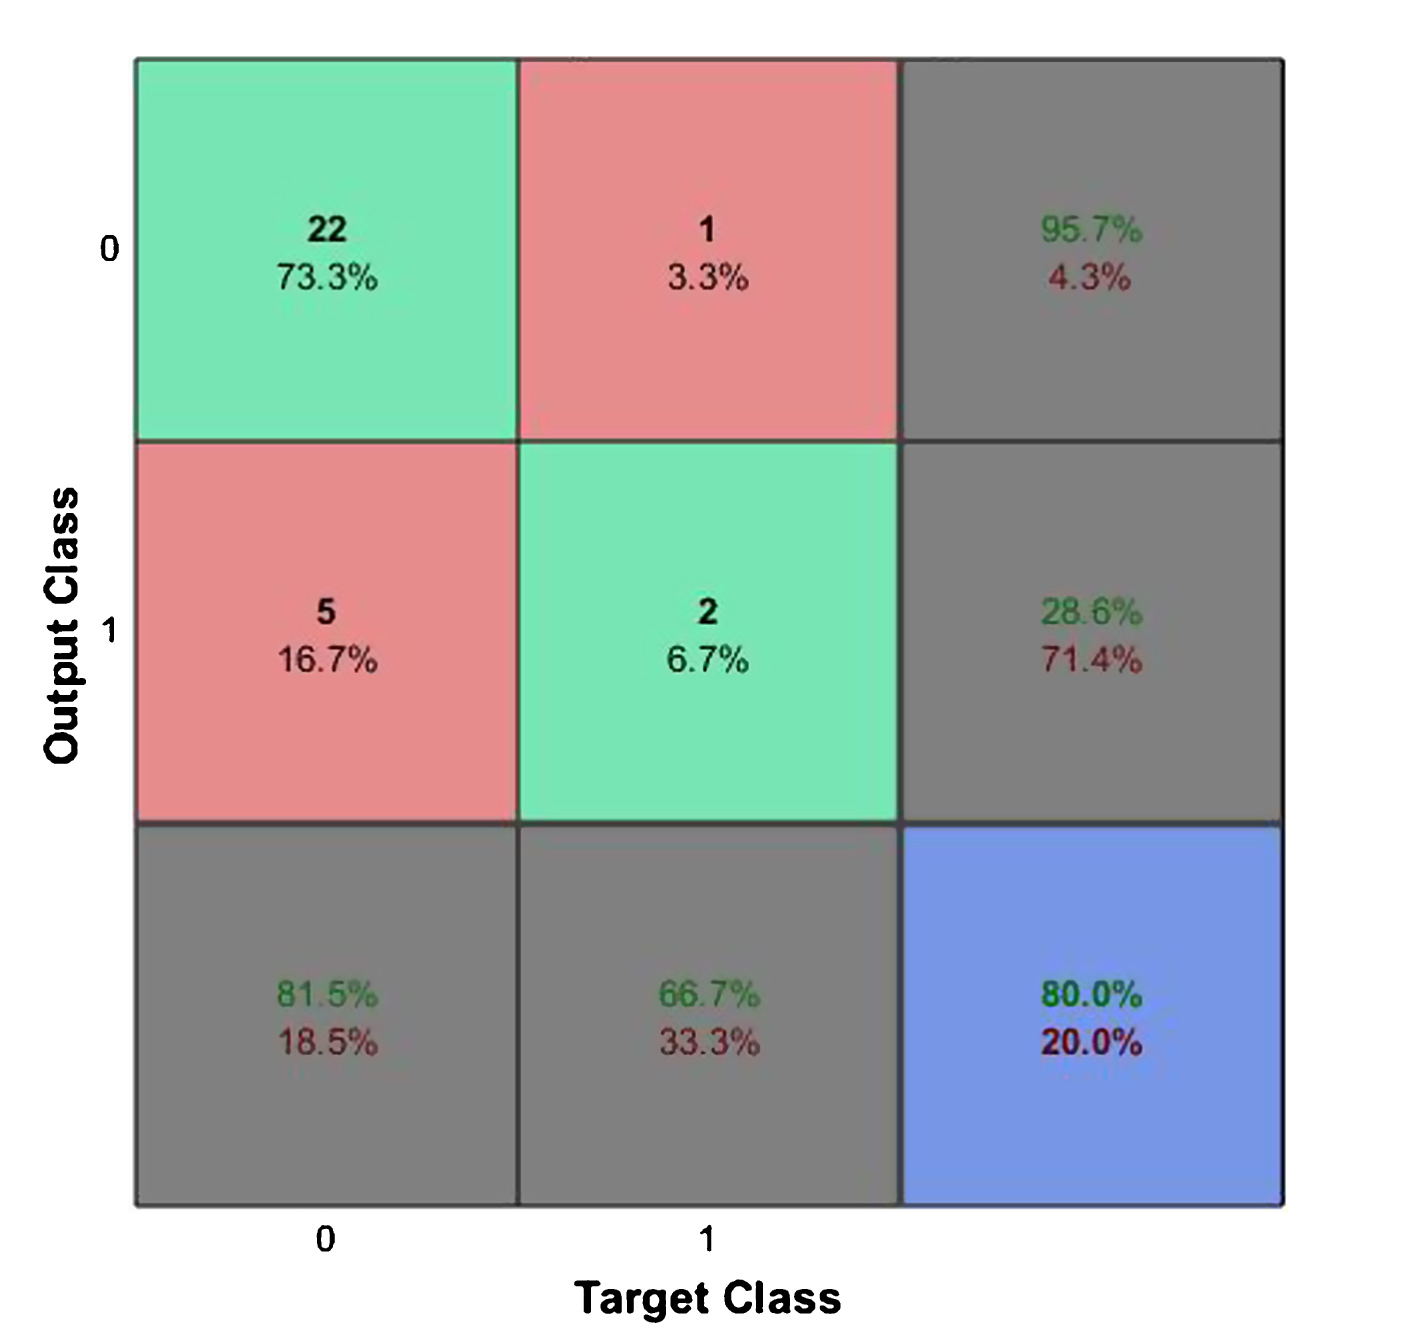
Confusion Matrix for Smartphone Market Segmentation using SVM.
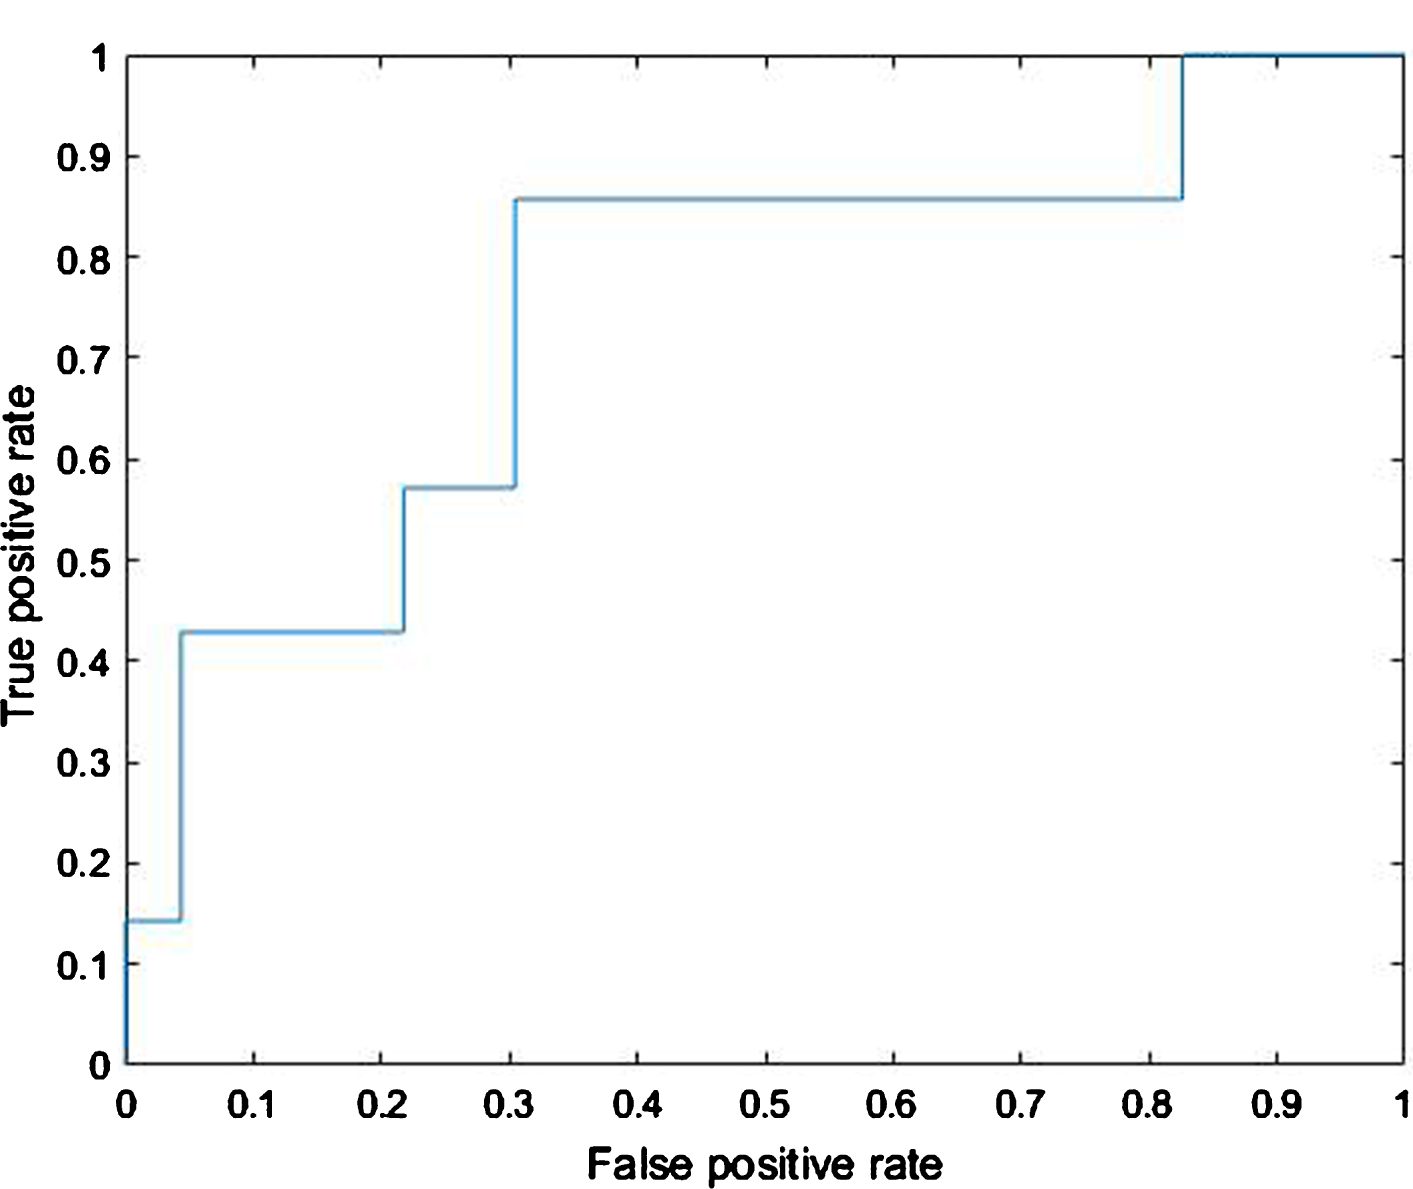
ROC for Smartphone Market Segmentation using SVM.

Confusion Matrix for Smartphone Market Segmentation using SVM.
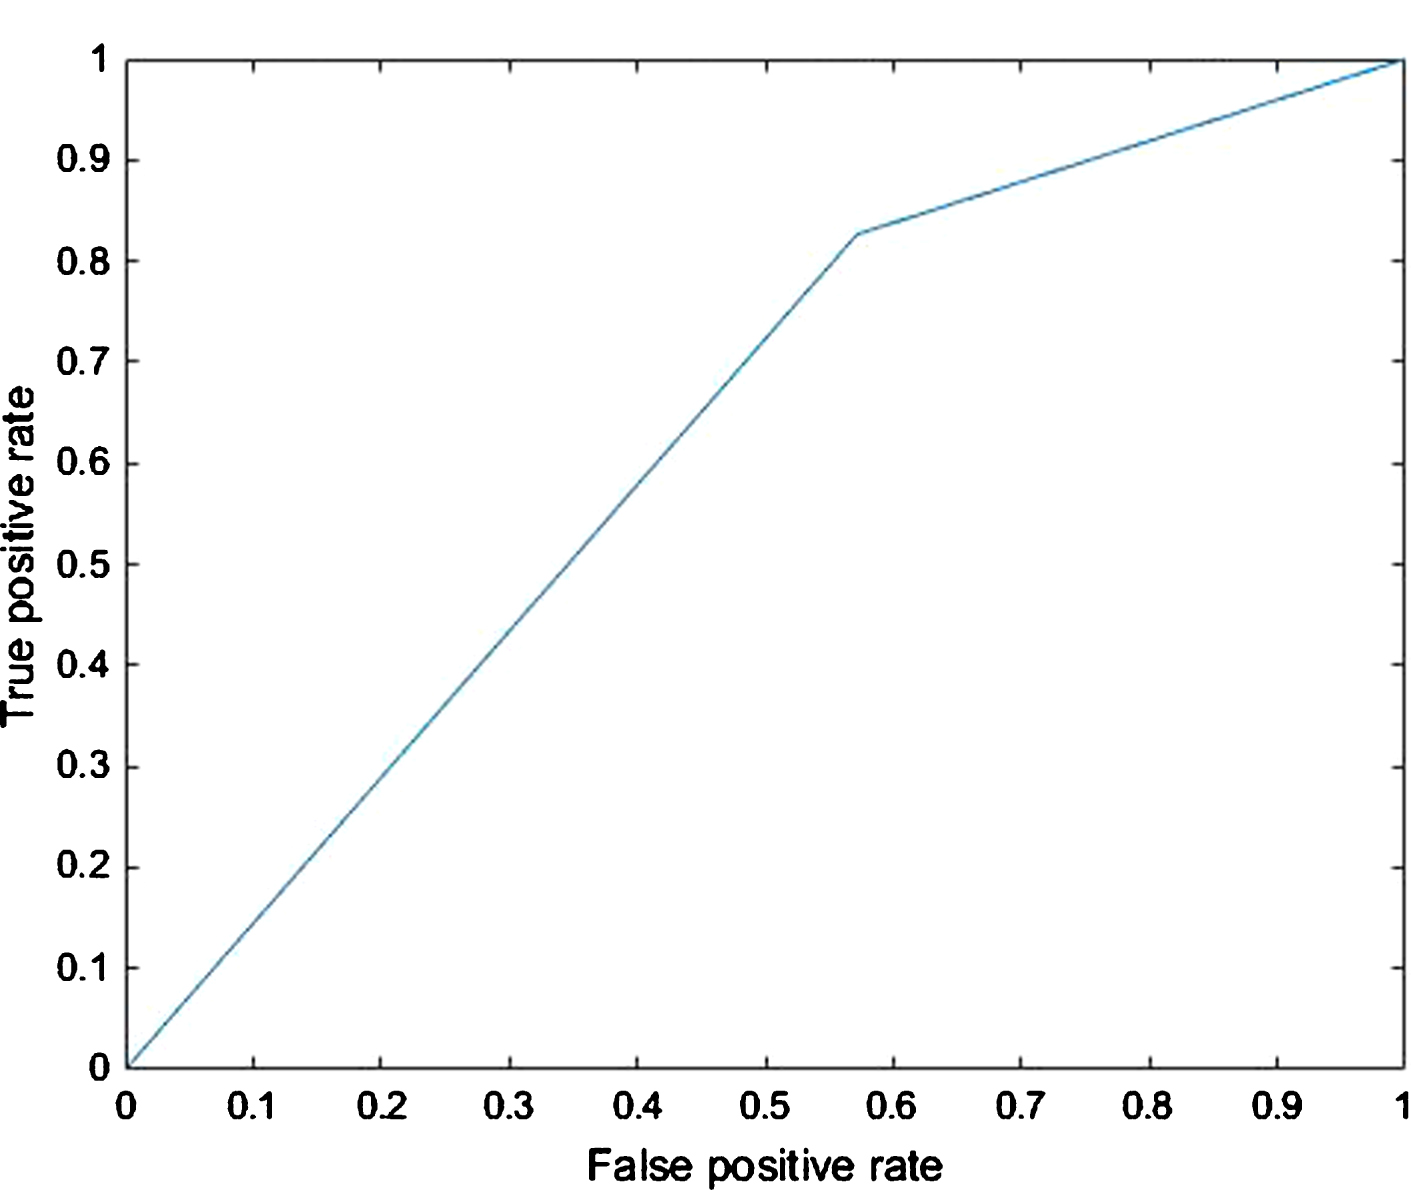
ROC for Smartphone Market Segmentation using SVM.
As we can see the correct classification rate (CCR) or accuracy for SVM was better than for KNN. From the ROC curve, we can see that SVM has a specificity and sensitivity of 81.5% and 66.7%, whereas, KNN has 82.6% and 42.9%. The misclassification rate for SVM and KNN are 20.0% and 26.7%. The AUC of the SVM and KNN models are 0.7516 and 0.6273. From the ROC results we can see that SVM has a lower specificity as compared to the KNN model, however it has a much better sensitivity of 66.7%, a lower misclassification rate and a better AUC which is essential for model implementation in real world application. Hence from an implementation standpoint, we can conclude that the SVM model is a better classifier than KNN for smartphone market segmentation.
PSO and GSA techniques are used to further improve the performance of the SVM based classifier. Both algorithms were run for 100 iterations with a population size of 20. The performance of the two algorithms in improving the correct classification is shown in Fig. 14.
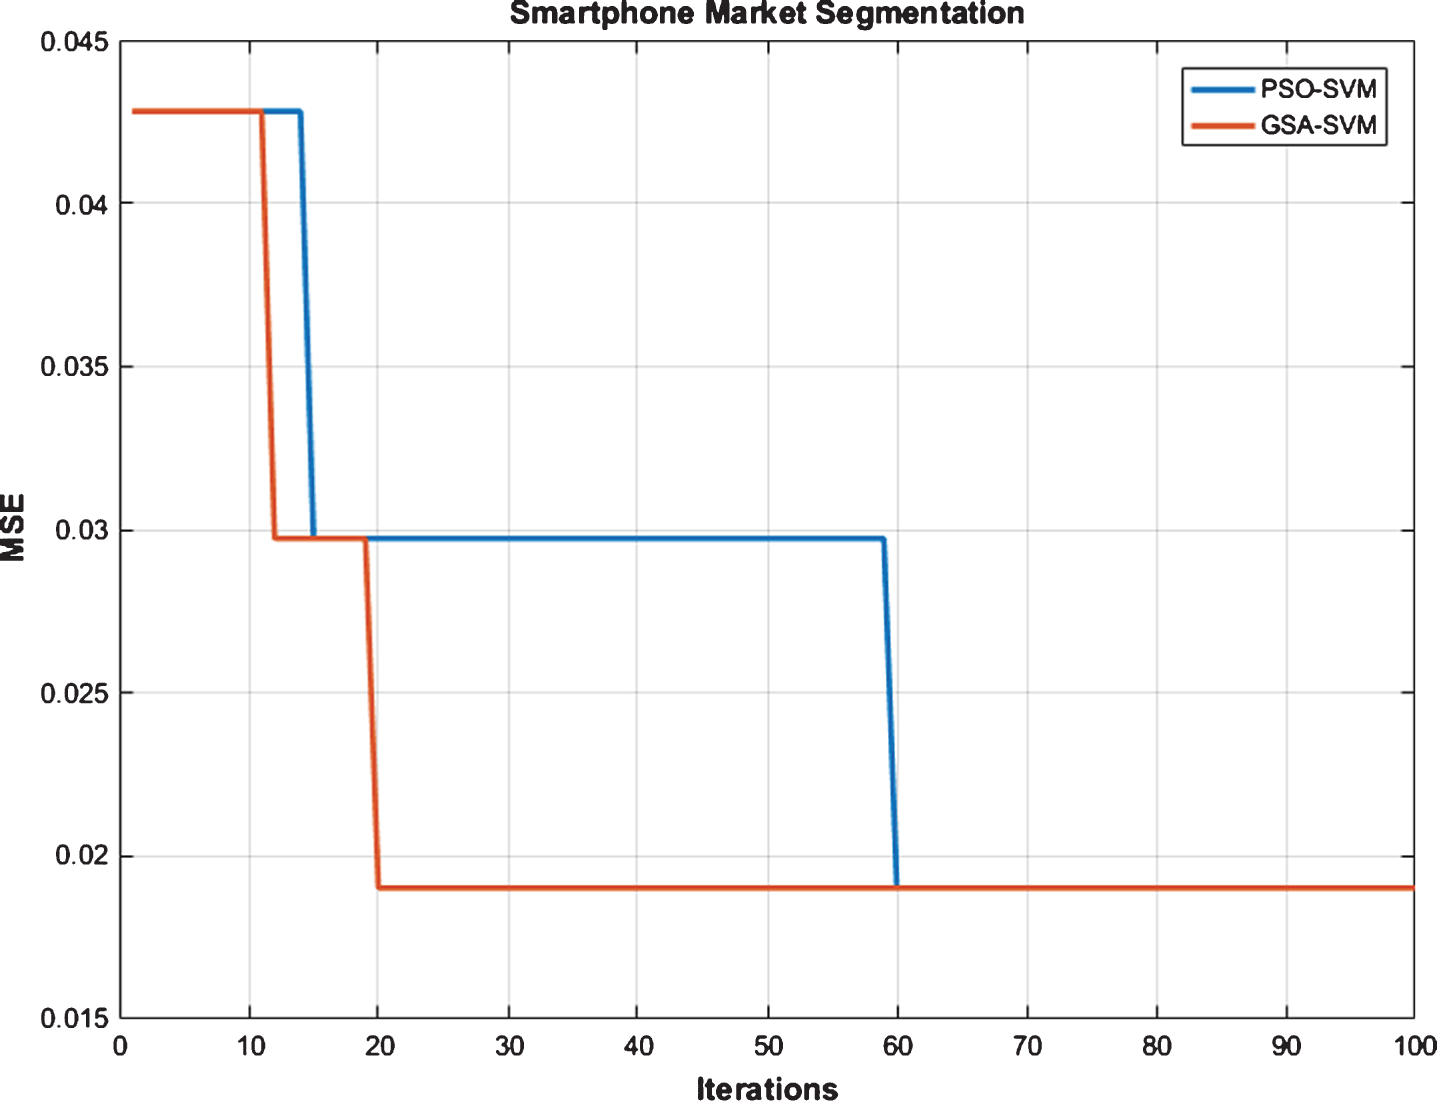
SVM with PSO & GSA for Smartphone Market Segmentation.
As indicated in Table 5, both the PSO and GSA based optimisations of the SVM improved the CCR from 80% to 86.20%. It can further be observed that the GSA algorithm arrives at this improved value in only 20 iterations in comparison to the 60 iterations taken by the PSO algorithm, illustrating the lesser computational power required by the GSA algorithm for optimisation.
Comparison of Classifiers for Smartphone Market
The e-commerce industry with respect to the Indian market was analysed. The data was applied in both supervised and unsupervised techniques. SOM model helped us identify the various characteristics of each segment. KNN and SVM were used to classify data. Upon obtaining and comparing the results, KNN was found out to be the best classifier between the two. The performance of the SVM classifier was then improved using evolutionary algorithms to determine the best parameters that improve the correct classification rate. Such an analysis of market segmentation can be especially useful in identifying the customers’ purchasing habits depending upon the demographics, their level of trust and all the factors considered above. This can be useful for the e-commerce websites in identifying which customers have more net worth and what they are be likely to buy. This can also be used to create suggestions on an e-commerce website. All the fields used here are readily available with every e-commerce website when a customer registers and the rest are created as and when the customer uses the website for buying items.
The same data for the smart phones was analysed. Although smart phones have a huge market size in India, AI techniques have not been as effectively been used. Integrating the e-commerce purchasing pattern with the smart phone that person will be likely to buy was only logical. This was because a lot of people now prefer buying mobile phones online. This can again be used to create suggestions. The data model once created can be integrated on the e-commerce portal. With the help of demographics and personal information, all the fields can be inferred. This model can help create suggestions on the e-commerce websites. This data can also be shared with the mobile company and this can help them understand the needs of the target audience better. This can help them find out the market size for a product already developed and also in deciding so as to its pricing. The data can also be used to develop effective marketing strategies, tailor made to fit to the needs of a particular segment. The models were created using KNN and SVM. It was seen that SVM worked better for this case. The performance of the SVM was further improved when it was optimally initialised with the help of PSO and GSA techniques.
The dataset used in this paper is primary data that was collected by survey, in which there could be some bias. Further, the database can be expanded by including more respondents. To get better results, more samples can be added. This will nullify any bias and also help obtain balanced classes. As the SVM and KNN classifiers performed considerably well, more AI techniques can be applied to the problem of market segmentation and they can be compared to figure out which one best suits any given application.