
Abstract
Understanding factors affecting growth rates in swine is important in the productivity of pig farms. We herein propose machine learning-based schemes to predict the average daily gain (ADG) of pig weight using temperature, humidity, feed intake, and the current weight of the pig. In order to address the lack of available growth data for pigs, we generate a synthetic dataset describing the weight of swine in relation to environmental factors based on the theoretical growth model and experimentally measured data, in an attempt to facilitate the application of machine learning techniques. Using the generated growth data, linear regression, tree regression, adaptive boosting (AdaBoost), and a deep neural network (DNN) are applied to estimate ADG. By means of a performance evaluation, we confirm that the machine learning algorithms are capable of predicting the ADG of swine accurately even when the growth characteristics of pigs are heterogeneous, i.e., each pig follows a different growth curve. Moreover, we also find that DNN can provide a higher predictive accuracy than other machine learning-based schemes.
Introduction
Growth rates in swine are of the utmost importance in pig farming and in the swine industry in general. If the pig grows too slowly, it will take too long to mature, increasing the cost to the farmer. If growth is too rapid, the quality of the meat is usually poor, e.g., the backfat of the pig may be too thick [1, 2]; it may become vulnerable to disease and be more exposed to health risks, such that again the revenue of the pig farmer could be severely reduced. Accordingly, an accurate growth model for swine is necessary to allow them to be raised at a suitable growth rate on farms. A growth model of swine would also be useful in commercial pork production to determine the proper swine weight for slaughtering [1, 2], and to devise an optimal feeding strategy [3]. A growth model is also beneficial for educational purposes, too. These factors mean that extensive research has already been undertaken to develop a growth model for pigs [4, 19]. In particular, given that growth is affected by many environmental factors, e.g., temperature, nutrition, and mineral concentration in feed, type of pig, humidity, feed intake, and birth weight [4], the relationship between growth and these factors has for some time been a major topic in swine research.
There are two ways to characterize the growth of swine. The first approach is via the use of growth curve. In most cases, the growth of an individual can be modeled as an asymmetric S-function such that the rate of growth increases gradually as the weight increases, then at some point the rate asymptotically approaches zero when it converges to a final body weight. Most of the current work on this topic focuses on the investigation of the appropriate parameters of the growth curve such that it matches actual measurements [5]. In [5] various growth-related measures were discussed, i.e., average daily gain of body weight (ADG) and average daily feed intake (ADFI), using various growth-curve models. In [6], the growth of pigs from birth to sixty days of age was investigated using three different growth curves, namely Bridges, Gompertz, and Michaelis-Menten, and the effect of birth weight on growth rate was evaluated. The growth of the Liangshan pig, a traditional Chinese breed, was examined using the Von Bertalanffy growth model in [7]. In [8], the growth characteristics of pigs of various genotypes and for various feeding strategies were examined using magnetic resonance imagery (MRI), in which the ratio of muscle to fat tissue was measured. The parameter estimation of the S-curve for pig growth was investigated in [9].
Another way to characterize the growth of a pig is via the use of the Net Energy (NE) model in which the metabolism of the pig is taken into account [10–12]. The authors of [12] investigated the digestible energy, metabolizable energy, and the NE of various types of feed. The effect of specific nutrition on growth is considered in conjunction with metabolism, such as the effect of sodium zeolite-A and copper [4] and the effect of dietary soybean oil [13]. This type of research is generally undertaken in the feed industry to determine the nutritional characteristics of feeding programs. Although the growth of pigs has been investigated extensively, the current hand-crafted models only consider a few environmental factors and are unable to take account of the complicated interactions between different environmental conditions.
More recently the lower cost of sensors and the emergence of Internet-of-Things (IoT) technologies has meant that smart pig farms equipped with various sensors for collecting biological and environmental data are now more common [18]. In the near future, smart pig farms will allow huge amounts of data to be collected, yielding large amount of high-quality data on the growth of pigs. These data sets could allow machine learning techniques to be applied to predict pig growth.
There are a handful of studies in which machine learning techniques have been adopted in the field of animal science. In [14, 15], the productivity of dairy cattle, e.g., pregnancy rates and first-service conception rates, was analyzed using various machine learning techniques including decision trees and support vector machines. In [16], an abnormal livestock detection algorithm was developed based on deep learning. The productivity of sows was investigated using a machine learning scheme in [17]. In our previous work [18, 19], we developed an approach to predict growth rates in pigs, based on temperature, humidity, CO2, and wind speed using a decision tree algorithm; however, the accuracy of this model was somewhat limited due to the lack of available data, i.e., only 264 growth records were used and only one machine learning scheme was considered.
Herein, we develop and compare four machine learning-based growth models of pigs based on environmental factors. The main contributions of our work are as follows: We develop a growth model of a pig as a means of predicting its daily weight gain (i.e., ADG) based on temperature, humidity, ADFI, and current weight, using four machine learning algorithms, namely linear regression, tree regression, adaptive boosting (AdaBoost), and deep neural network (DNN). To address the lack of experimental data, we artificially generate growth data for pigs by combining a conventional growth function based on an asymmetric S-function with a measured growth record. To the best of our knowledge, this is the first attempt to apply deep learning to predict growth in pigs. We examine the accuracy of the developed growth model. Our results justify the use of machine learning techniques in the prediction of pig growth and reveal that the DNN-based model outperforms other prediction models. The validity of using a synthetic dataset is also confirmed.
The remainder of this paper is organized as follows. We describe the considered pig growth data in Section 2. In Section 3, the development of our machine learning-based pig growth model is explained. Our simulation results and conclusions are provided in Sections 4 and 5, respectively.
In this section, we describe the characteristics of empirical pig growth data and outline some of the problems associated with these datasets. We then present the approach we use to generate synthetic pig growth records based on a conventional growth model and an experimental dataset.
2.1 Characteristics of Measured Pig Growth Data
In this paper, we use the dataset presented in [18] and [19], obtained from a small pig farm with three pigs over a period of 85 days during 2015. The dataset includes the average, maximum and minimum temperature, humidity, CO2, and wind speed for each day. It also contains the weights of individual pigs for each day, from which the ADG of the pigs can be calculated. Unlike previous work investigating body composition, i.e., the ratio of fat to muscle in the carcass [4], we focus purely on the body weight of the pig. The statistics of the empirical data are summarized in Table 1.
Statistics of Environmental Data of Pig Farm and Weight Data of Pigs. Avg., Std., Max., Min., Temp., Hum., and Wind. denote average, standard deviation, maximum, minimum, temperature, humidity, and wind speed, respectively
Statistics of Environmental Data of Pig Farm and Weight Data of Pigs. Avg., Std., Max., Min., Temp., Hum., and Wind. denote average, standard deviation, maximum, minimum, temperature, humidity, and wind speed, respectively
Table 1 indicates that the standard deviation of the temperature is low, because the pig farm considered here is equipped with an air conditioning system. We also show that the ADG of the pigs is about 640 g per day. Note that the range of ADG is large, i.e., the minimum is – 3.3 kg and the maximum is 8 kg, due to inaccuracies in the weights measured by the scales, caused by the movement of the pigs.
In our previous work [18, 19], we performed a machine learning analysis of pig growth based on this empirical dataset. However, the results were poor and it was hard to gain any meaningful insights from the analysis, because 1) the size of dataset was too small to apply machine learning algorithms properly, and 2) the measurement error of the weight was too high.
To solve this problem, we generated a synthetic dataset based on conventional pig growth (i.e., the Gompertz model) and empirical data. Although a synthetic dataset is used in place of real data, performance evaluation based on this synthetic dataset can provide meaningful insights regarding predictions based on machine learning [21]. Moreover, through performance evaluation, we find that prediction of ADG based on synthetic data provides a greater accuracy than that achieved using a small empirical dataset, which justifies the use of synthetic data. Furthermore, this kind of modeling approach can be a useful alternative to experiments using real animals, greatly reducing the time and resources required for evaluation and enabling more rapid assessments to be made [22].
We used a Gomertz growth curve, which is one of most popular models of growth in pigs [5, 18]. In a Gompertz growth curve, the weight of a pig at day n, which we denote W (n), can be written as follows:
Unlike most conventional approaches that only consider the effects of genetic differences between pigs, we consider the effect of environment on ADG. More specifically, we assume that daily average temperature and humidity affect growth in pigs [20]. This assumption can be verified using our experimental results, to which end we applied a decision tree algorithm, which is one of most popular machine learning tools [18], to the empirical dataset and derived a prediction model depending solely on either average temperature or humidity.
Predicted ADG based on decision tree depending on average temperature and humidity.
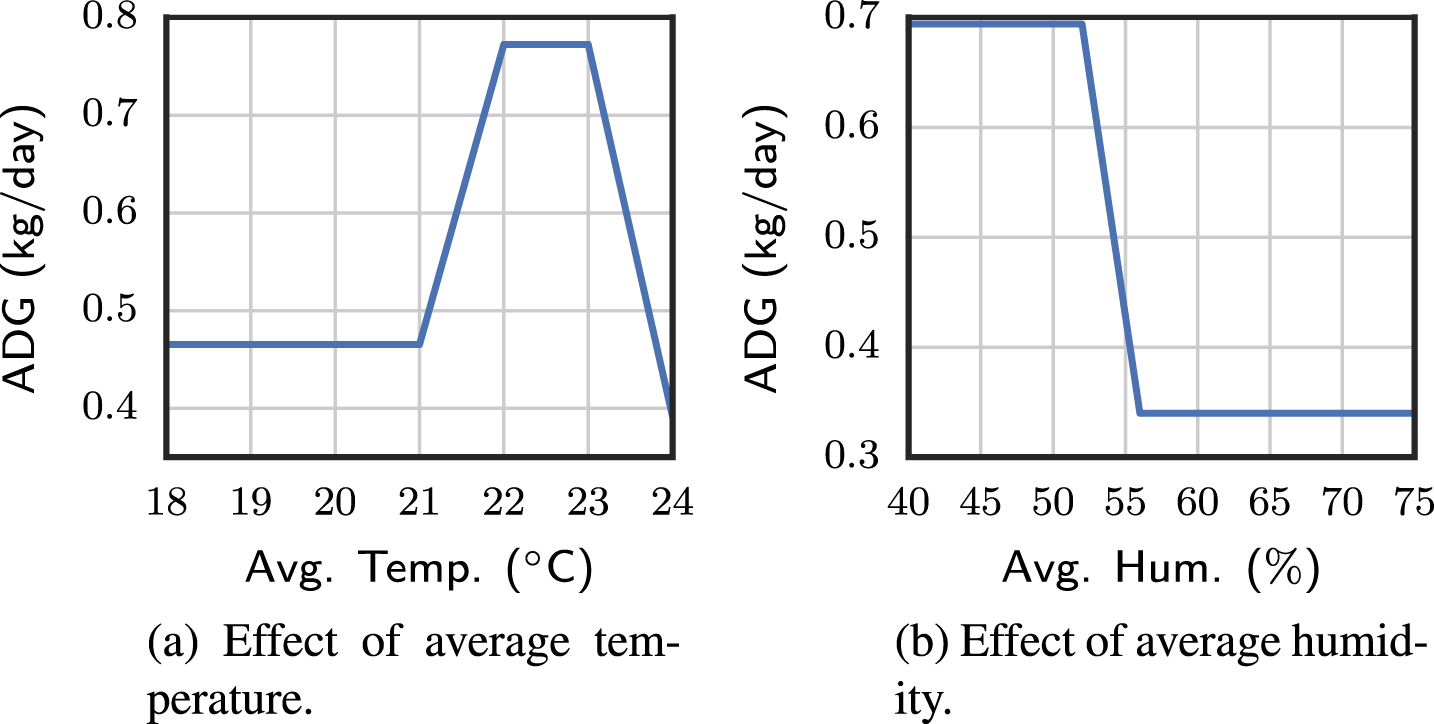
The ADG predicted using a decision tree is shown in Fig. 11. It can be seen from the results that the ADG of the pig is indeed affected by the environmental factors of temperature and humidity. We find that the predicted ADG decreases when the average temperature is lower than 21°C or higher than 24°C. Moreover, the predicted ADG also decreases if the average humidity is higher than 55%. Based on this observation, we take account of the effect of these two environmental factors in our model. In addition to temperature and humidity, we also consider the effect of ADFI on ADG recognizing that ADG increases when ADFI increases, as found in previous research [8, 22].
Let etemp (T n ), ehum (H n ), and eFI (F n ) be the effects of average temperature, humidity, and ADFI on ADG, respectively, where T n , H n , and F n are average temperature, humidity and ADFI at day n, respectively.
First, etemp (T
n
) is modeled as follows:
Second, ehum (H n ) is modeled as follows:
Third, eFI (F
n
) is modeled as follows:
It should be noted that etemp (T n ) and ehum (T n ) are devised based on the results shown in Fig. 1, and eFI (F n ) is formulated assuming that ADG is proportional to ADFI
In this approach, we use a simple linear relationship between ADGand ADFI. Use of a more complicated model, e.g., thegamma function [22], is left for future work.
In our model, the ADG at day n, ADG
n
, is then formulated using T
n
, H
n
, F
n
, and the weight at day n, which we denote as W
n
, is given as follows:
Using (1), W
n
can be written as follows:

Correlation between average temperature and average humidity in an experimental pig farm.
In this paper, temperature, humidity and ADFI are randomly generated from the statistics of the empirical data. More specifically, we randomly generate temperature and humidity based on Gaussian distributions with mean and standard deviation coincident with the values given in Table 1. ADFI is randomly generated using a Gaussian distribution with mean 2 and variance 0.04 [20]. Furthermore, the correlation between temperature, humidity and feed intake is also considered. In Fig. 1, we show the probability density function (PDF) of the temperature and humidity, and the correlation between temperature and humidity obtained from empirical measurements. It can be seen from Fig. 1 that the average temperature and humidity are correlated and the covariance is calculated as 0.4. Moreover, from [20], we find that the temperature and ADFI are negatively correlated such that the ADFI decreases as the temperature increases. Based on these observations, the temperature, humidity and ADFI are generated to follow
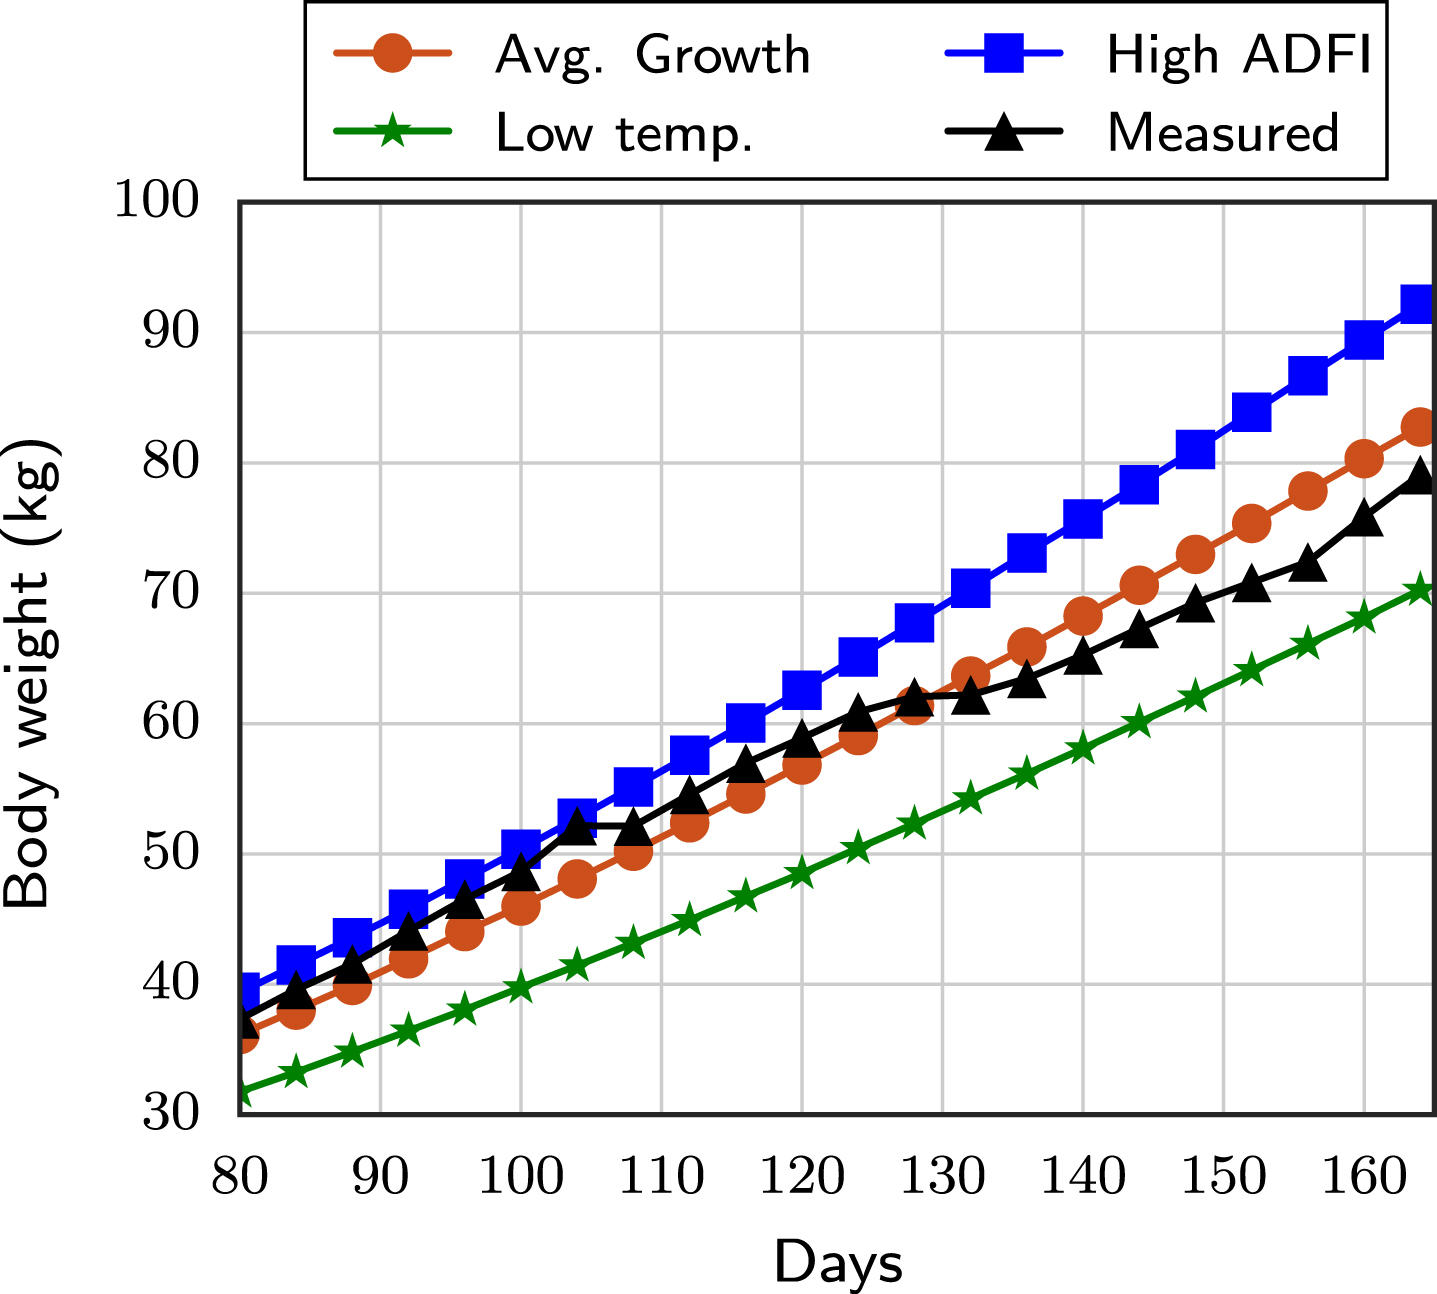
Growth curve of a pig under different environments.
In Fig. 1, we show the growth curve of pigs as generated by our model. The average growth (Avg. Growth), the growth when the ADFI is 2.2 kg (High ADFI), the growth when the temperature is 20°C (Low temp.), and the empirical growth (Measured) are all shown. These results indicate that our model matches the empirical data quite well and the effect of environment is correctly taken into account, i.e., pigs grow more slowly when the average temperature is low, cf. Fig. 1, and grow more rapidly when the ADFI is high.
In this paper, we consider four machine learning algorithms to predict the weight gain of pigs based on average temperature, average humidity, feed intake, and current body weight
It isworth noting that neither birth body weight nor mature body weight, both of which affect growth, are used because these values are hard to obtain in practice on a pig farm. Nevertheless, from our performance evaluation we confirm that our prediction models are sufficiently accurate.
Four regression based machine learning algorithms are used for growth prediction, namely linear regression [23], tree regression [23], AdaBoost [24] and deep learning [25]. First, in the linear regression algorithm, the ADG of a pig is estimated using a linear function of T
n
, H
n
, F
n
, W
n
. More specifically, ADG
n
is estimated using the following function.
In the linear regression, the coefficients and bias are found such that the MSE of ADG is minimized [23], i.e., ∑|ADGtrue - ADG n |2 is minimized where ADGtrue is the true value of ADG and ADG n is the predicted value. In our dataset, α T , α H , α F , α W , and β are found as 0.022, – 0.005, 0.266, 0.0036, and – 0.35, respectively. We therefore take it that the effect of ADFI is dominant and the effect of humidity is low.
Second, in tree regression, the ADG of a pig is predicted using a tree structure constructed by taking entropy into account [23]. An example of using tree regression to predict the ADG of a pig where the depth of the tree is limited to 4 is shown in Fig. 1, in which we find that humidity, temperature and weight are the dominant factors.
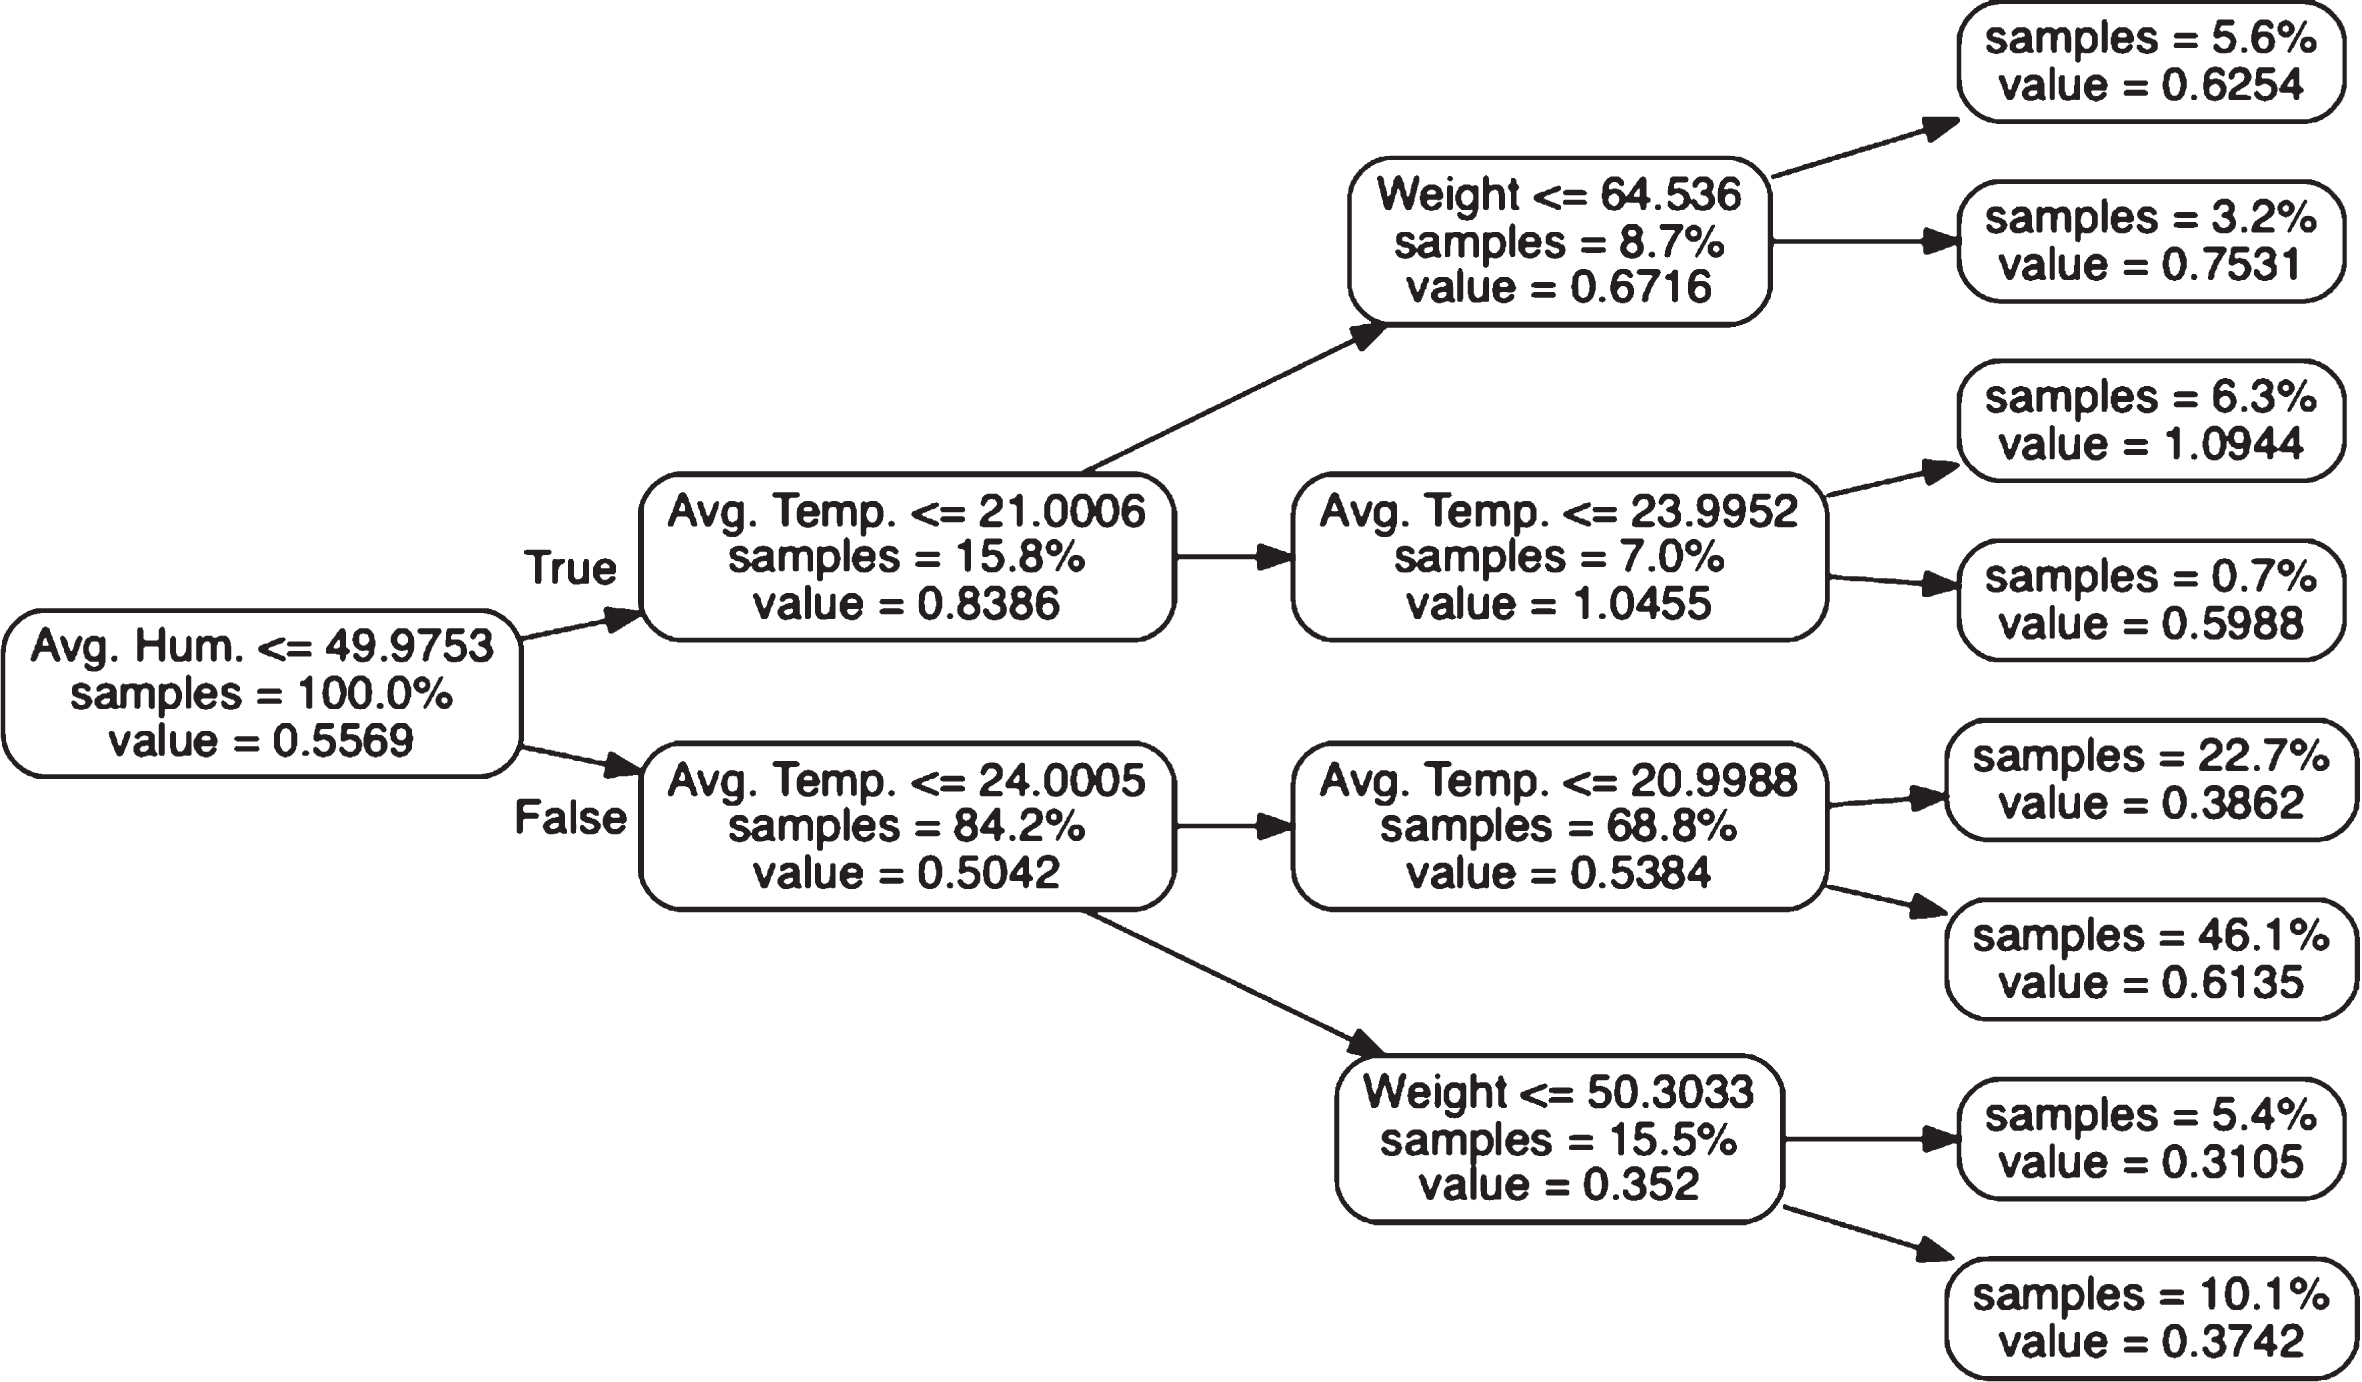
Example of ADG prediction based on tree regression.
Third, AdaBoost is a meta-machine learning algorithm in which the output of multiple machine learning algorithms are combined using a weighted sum [24]. The AdaBoost algorithm is adjusted such that any mispredicted examples are repredicted properly. In this paper, the tree regression algorithm is used as a base classifier for AdaBoost.
Finally, in deep learning-based prediction, a DNN that mimics the neurons in a human brain is used to predict ADG. In a DNN, a near-optimal strategy to predict ADG can be learned in cognitive way via a back-propagation algorithm [25]. One particular benefit of deep learning is that it allows highly nonlinear and complicated characteristics to be modeled.
The considered DNN structure is shown in Fig. 1. In this work, we consider a simple DNN structure containing four sets of linear and rectified linear unit (ReLu) layers connected in sequence. The input of the whole DNN are the four features, which are temperature, humidity, ADFI, and weight, and the output is the predicted ADG. In the linear layer the matrix multiplication of weight and the addition of bias take place. Let xL be the input of the linear layer, and the output then becomes L w xL + L b , where L w and L b are the weights and bias of the linear layer, respectively. In our DNN model, the number of units in one linear layer is set to 50. The output of the linear layer is fed into ReLU, which provides nonlinearity
Note that without ReLU, the DNN becomes a simple large matrix computation that is unable to cope with nonlinear characteristics.
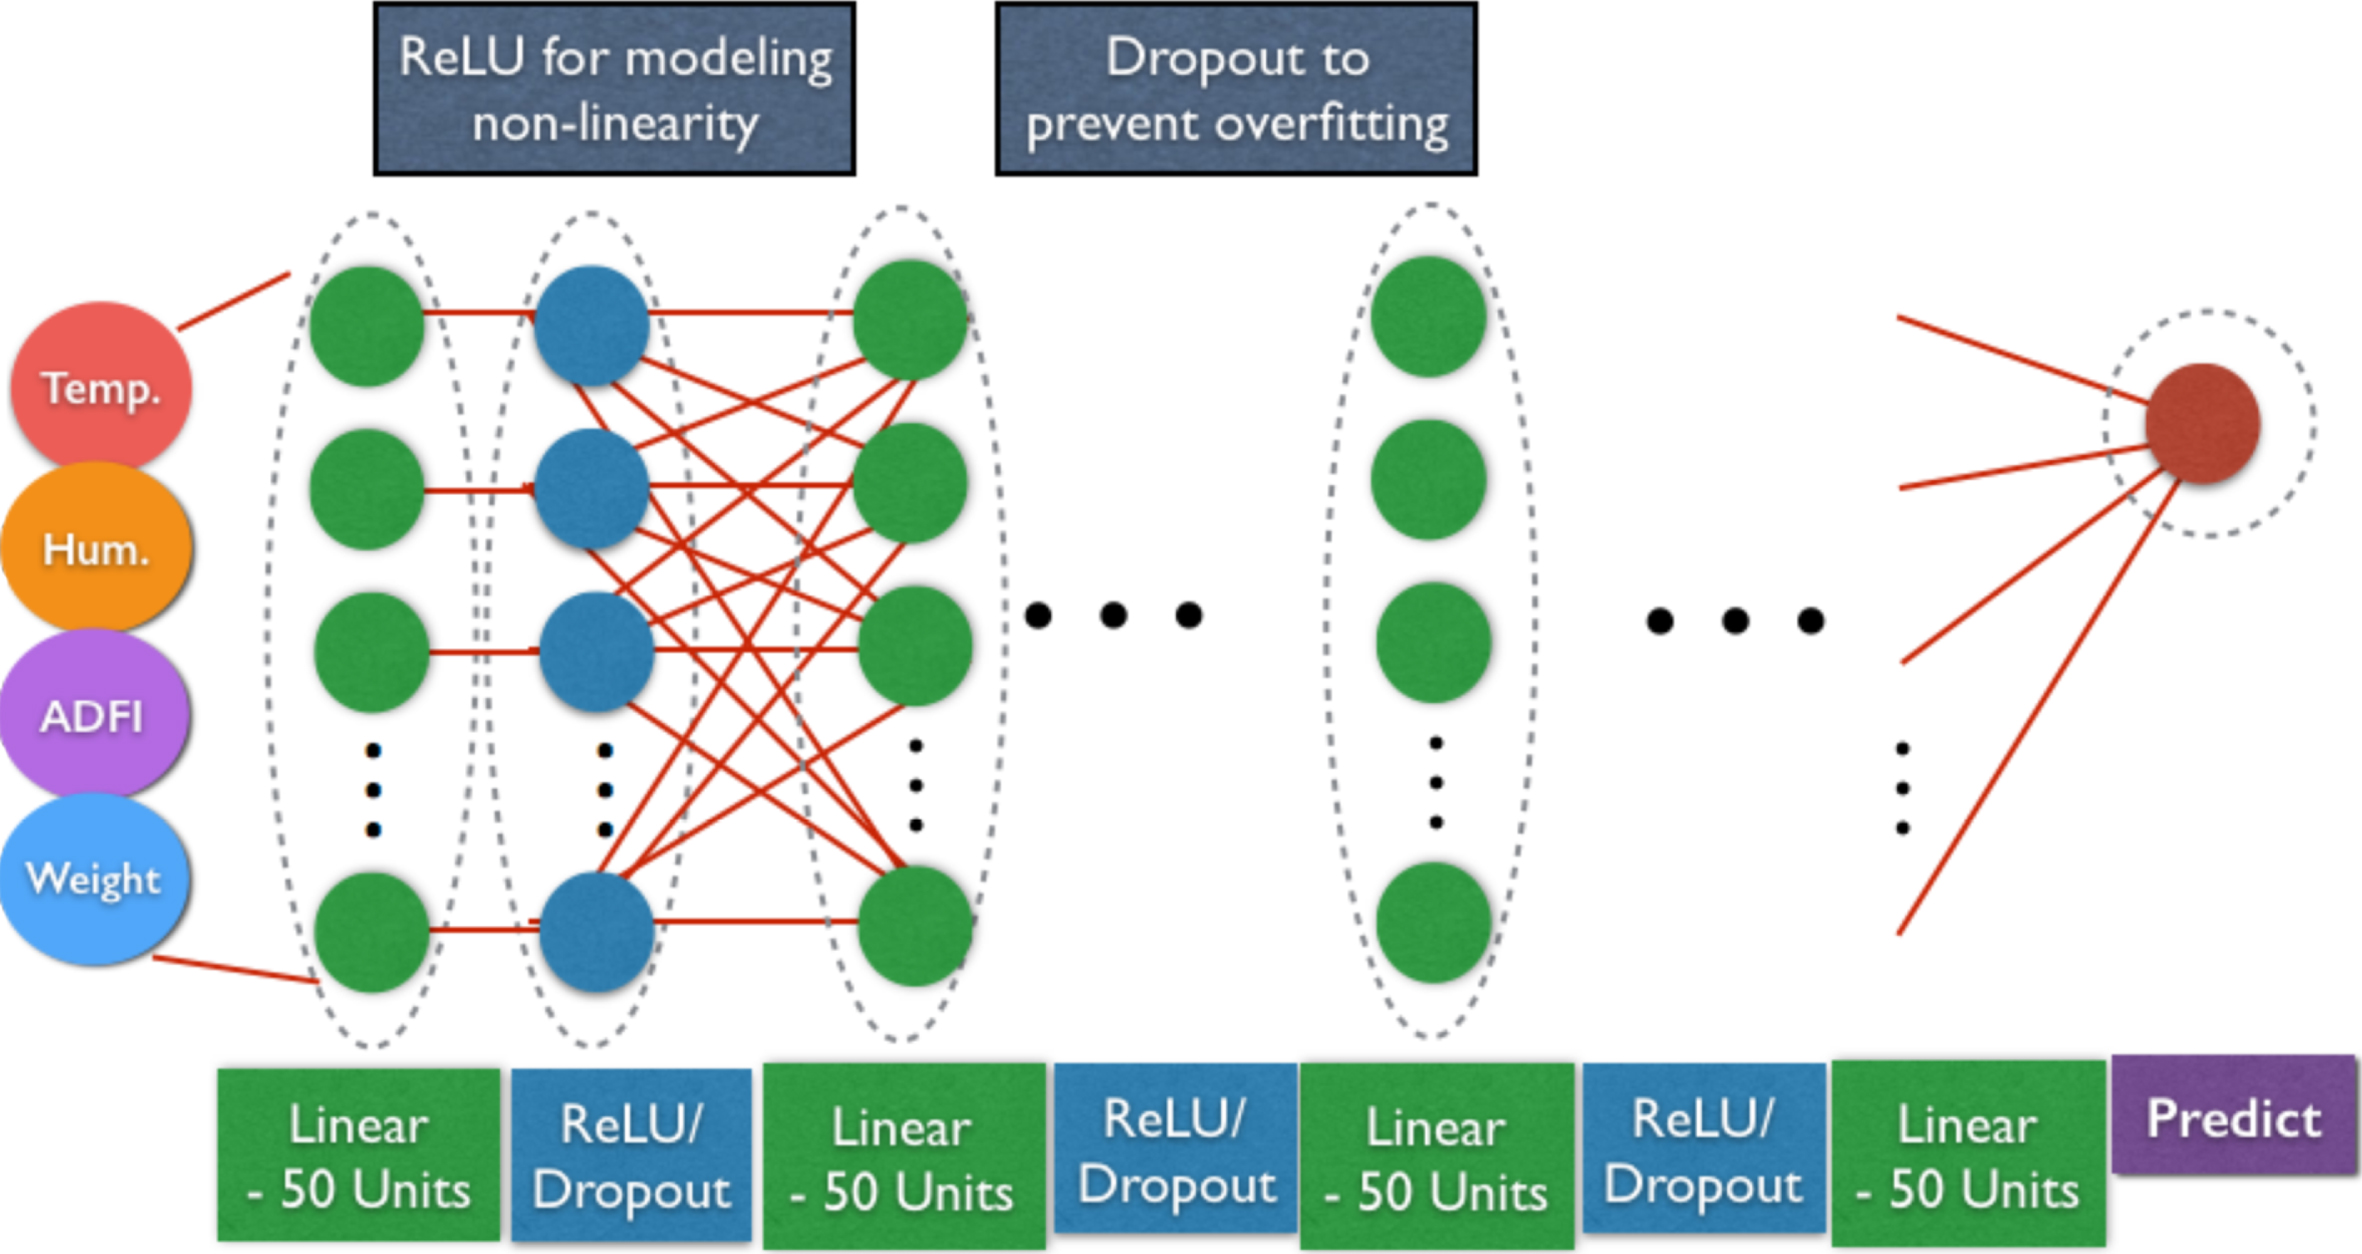
DNN structure used for ADG prediction.
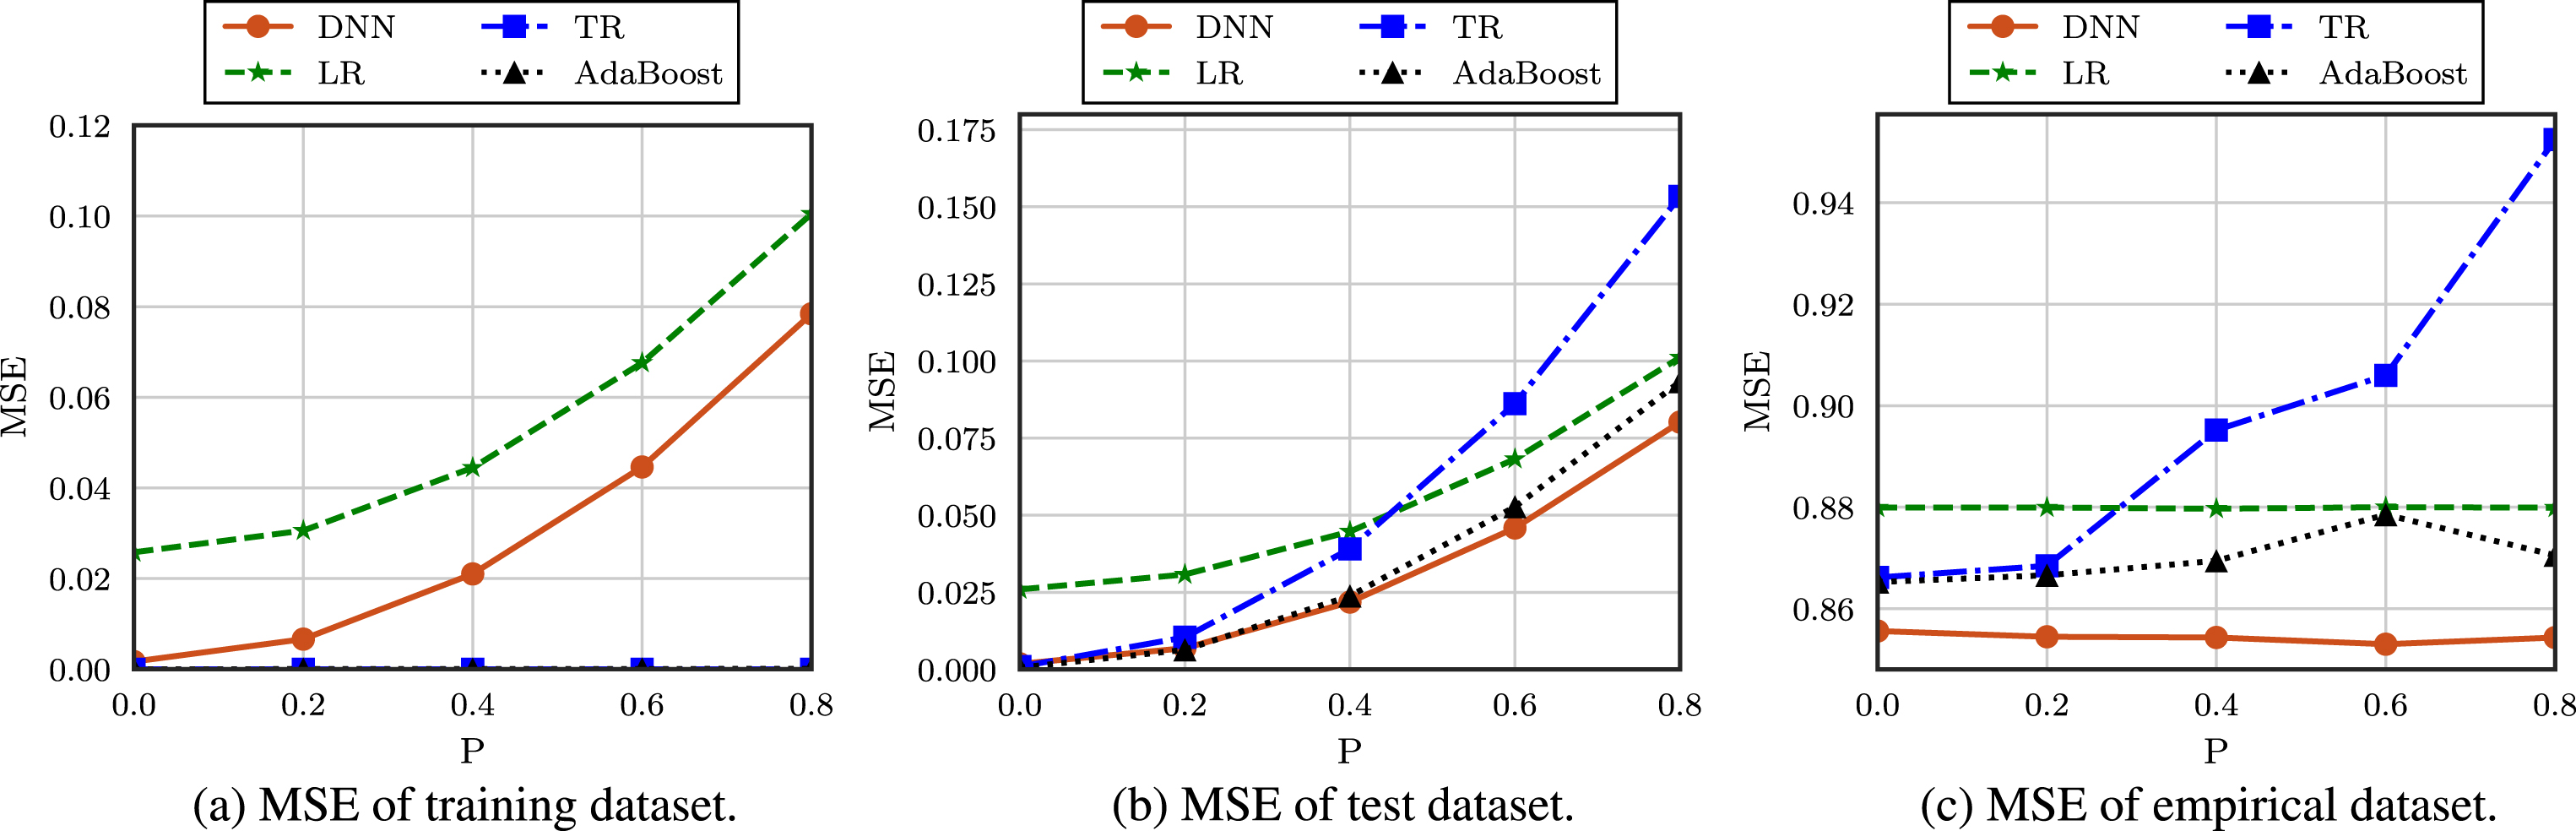
MSE of machine learning-based predictions achieved by varying the randomness in the growth model.
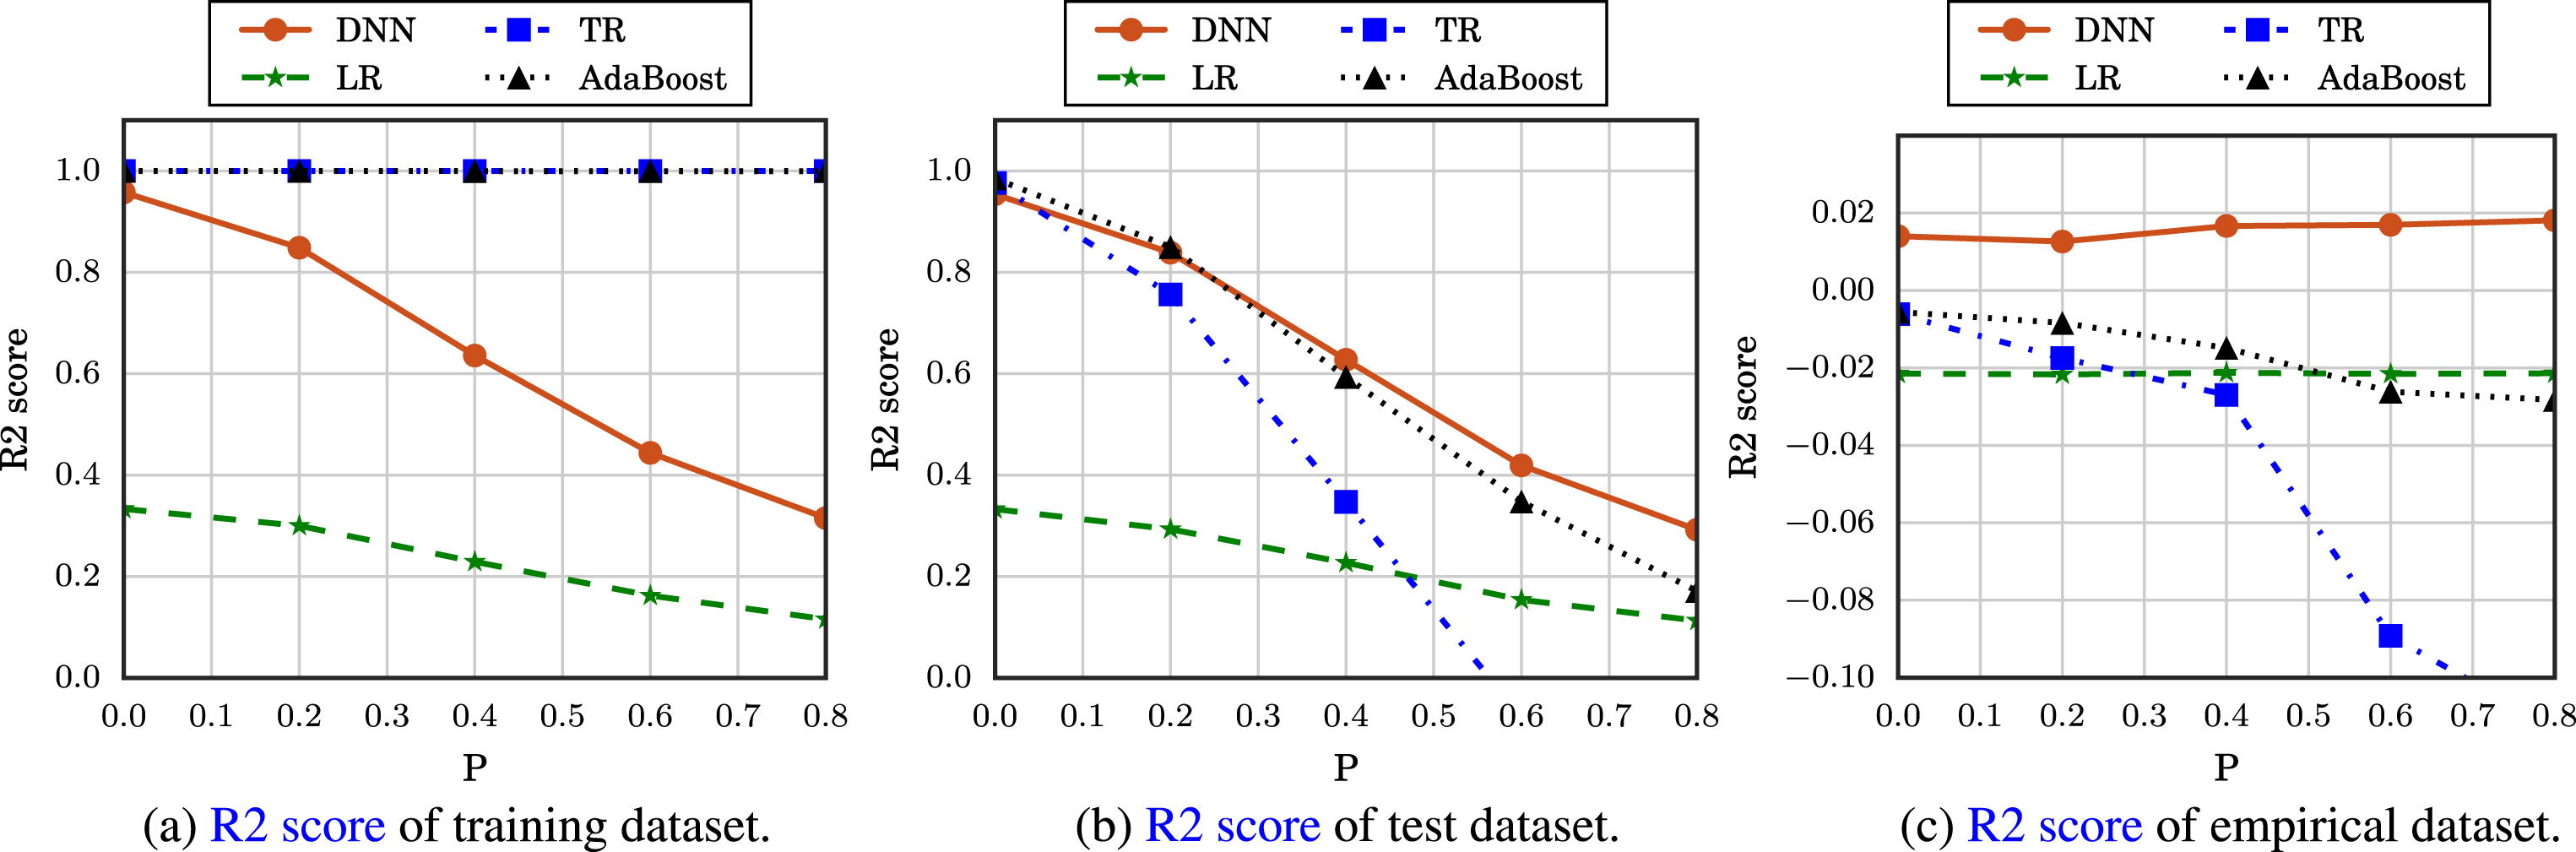
R2 score of machine learning-based predictions achieved by varying the randomness in the growth model.
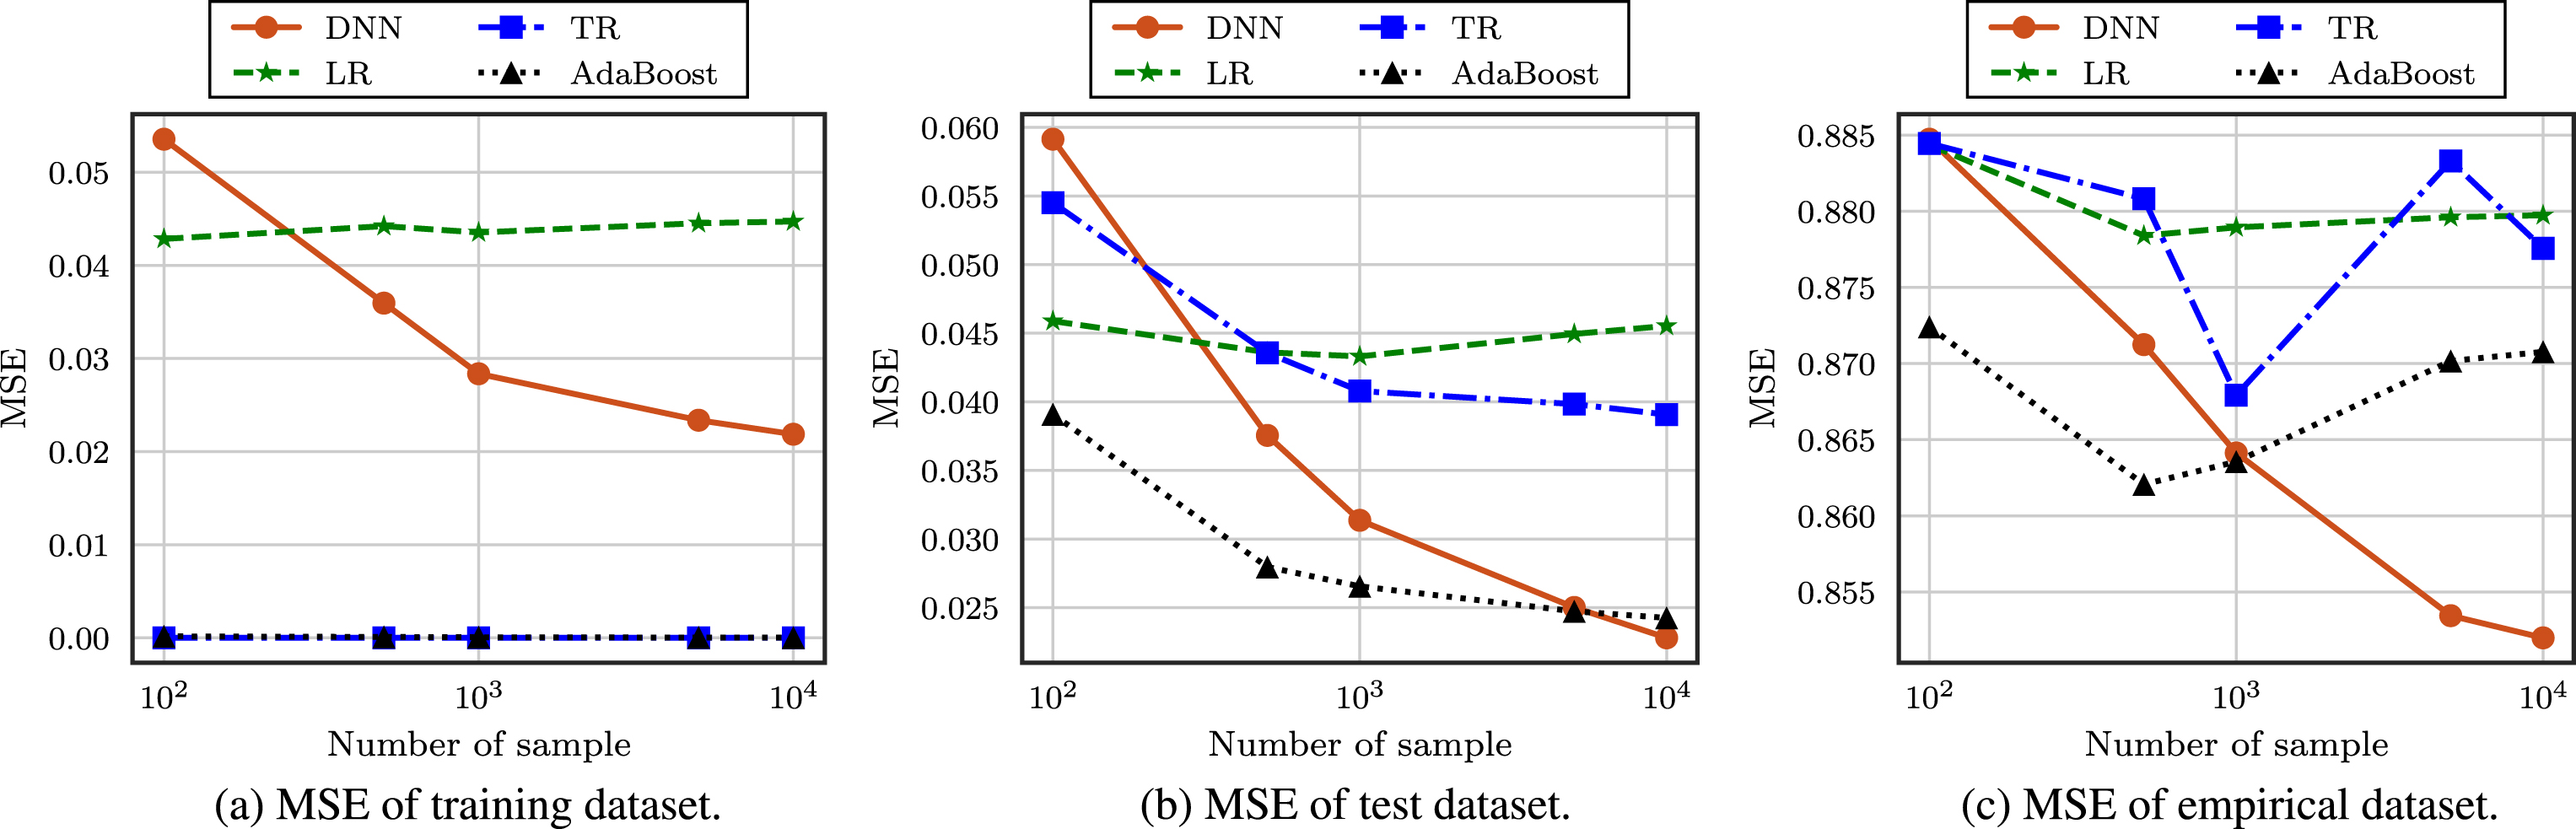
MSE of machine learning-based predictions achieved by varying the number of samples.
In this paper, the MSE and the R2 score are considered as performance metrics. Let
Performance Evaluation
In this section, we illustrate the accuracy of our machine learning-based ADG predictions. In the performance evaluation, we generate the synthetic growth dataset for 500 pigs using the methodology discussed in Section 2, where the daily records for 85 days are collected starting 79 days after birth. Accordingly, 42500 growth records are generated in total, where each record is composed of the average temperature, humidity, feed intake, current weight, and ADG. In the performance evaluation, a subset of growth data is randomly chosen, which we denote as Nsample. Then, among the Nsample sample data, 90% are used for training the machine learning algorithms (training dataset) and 10% are used for testing only (test dataset). In addition to the synthetic dataset, we also examine the accuracy when the empirical dataset is used for training (empirical dataset). Furthermore, we also consider the four machine learning-based predictions presented in Section 3, i.e., DNN based prediction, linear regression (LR)-based prediction, tree regression (TR)-based scheme, and AdaBoost-based prediction.
In Figs. 6 and 7, we show the accuracy of the growth predictions achieved by varying the effect of unaccounted randomness in the growth model, ϵ. To this end, we assume that ϵ is uniformly distributed in the range -P to P, and we vary the value of P in the performance evaluation. Moreover in the simulation, we assume Nsample = 20000.
As can be seen from the results, the MSE increases as P increases because the influence of the random effect on ADG becomes more significant. For the same reason, the R2 score decreases as P increases. However, it should be noted that both the DNN-based scheme and the LR-based scheme are robust to P for an empirical dataset. Furthermore, we find that the predictions are sufficiently accurate (i.e., MSE is close to zero and the R2 score is close to 1) for the training and test datasets; however, the accuracy is severely degraded for the empirical dataset. Especially, we find that the MSE and R2 score of the TR- and AdaBoost-based predictions are 0 and 1, respectively, for the training dataset. It is due to the overfitting of decision tree based algorithm such that proper regularization techniques should be taken into account to avoid this overfitting.
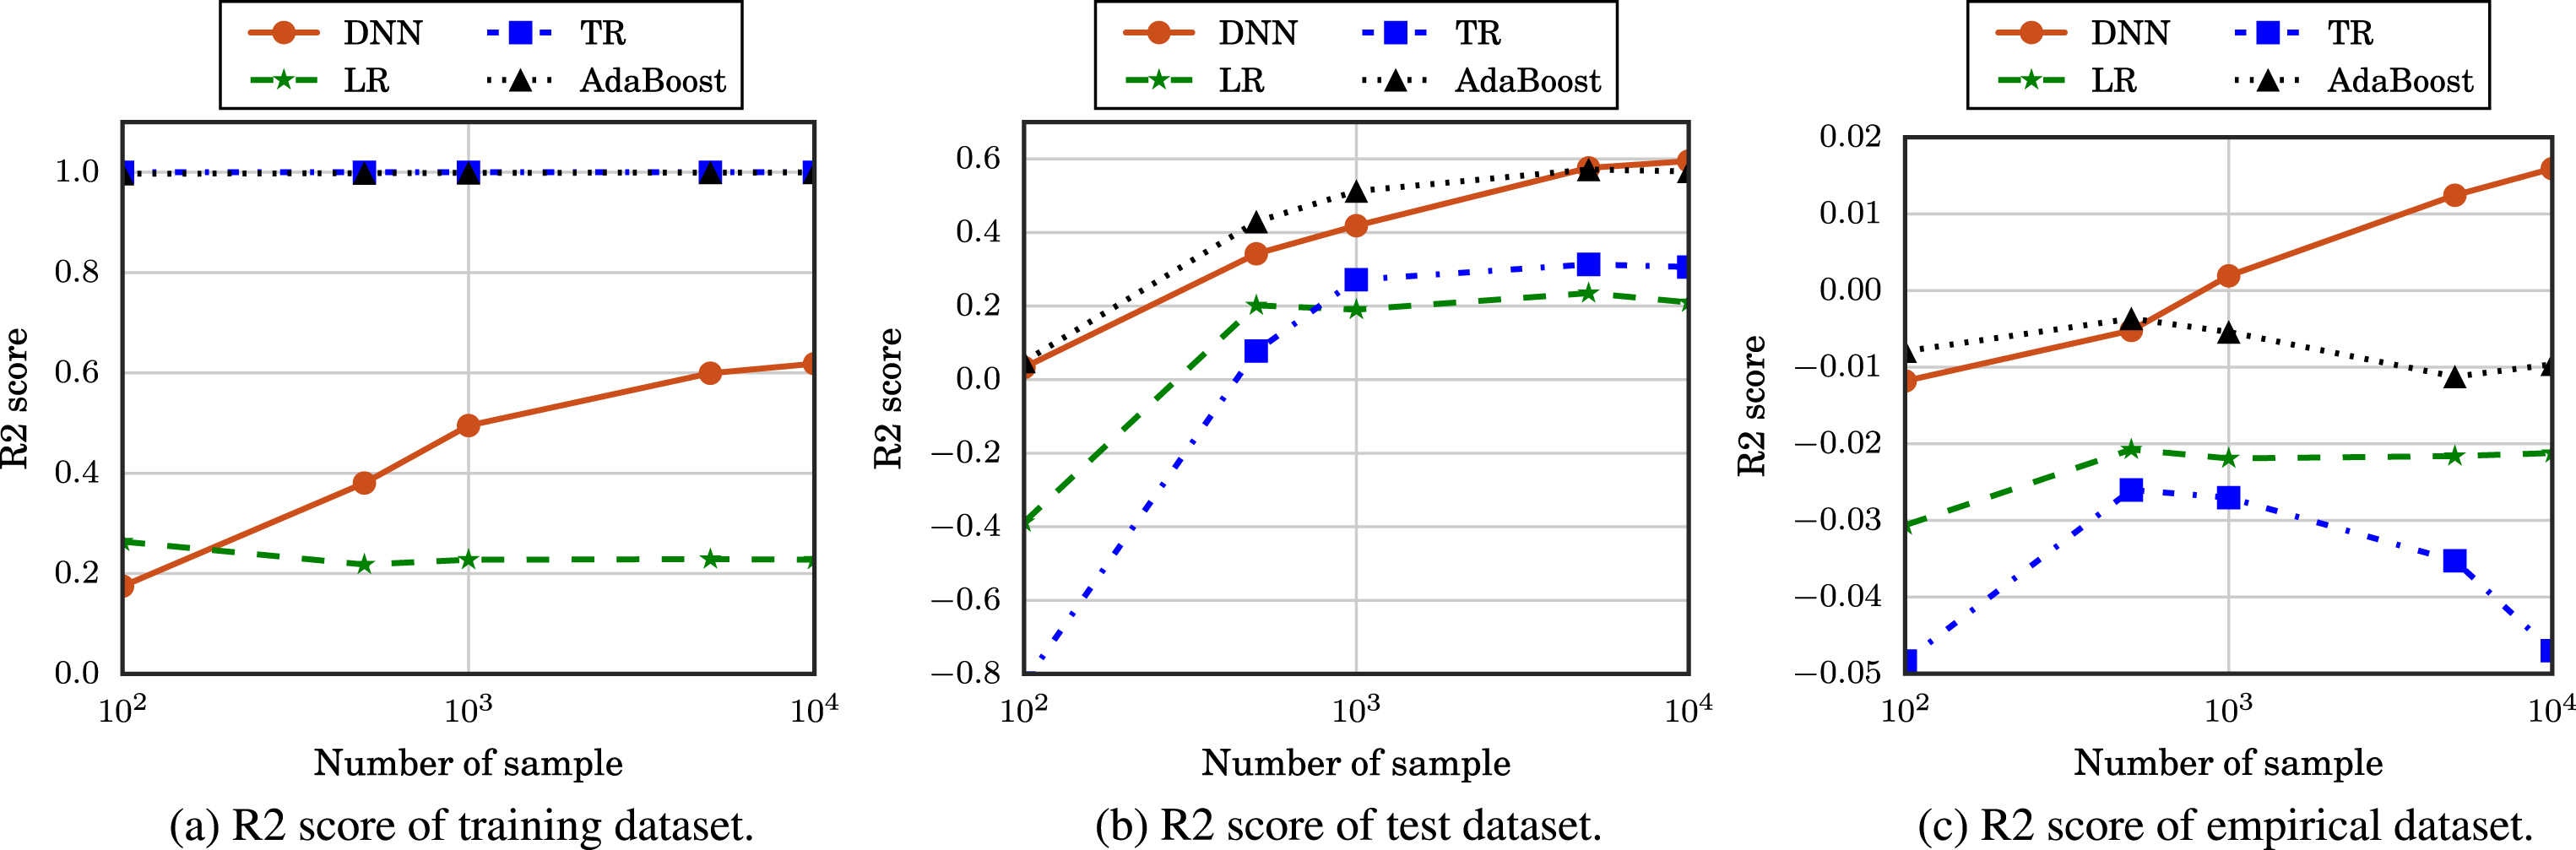
R2 score of machine learning-based predictions achieved by varying the number of samples.
From these results, we also find that the DNN-based prediction outperforms all other predictions for the test and empirical dataset in view of both the MSE and the R2 score, which confirms the benefit of deep learning. Although we do not show it in the performance evaluation, we find that DNN-based prediction yields a better performance using the synthetic dataset, compared with when the empirical dataset is used for training
For example, when the empirical dataset is used for training, the measured R2 score is -0.014, which is lower than the value shown in Fig. 7.
Nevertheless, the achieved accuracy is still low such that more accurate empirical data must be collected; we leave this question for future work.
In Figs. 6 and 7, we show the MSE and R2 scores of the predictions achieved by varying the number of samples, which is Nsample, when the value of P is set to 0.4. From these results, we find that the DNN-based prediction outperforms other predictions for the test and empirical datasets when the number of samples is large. In particular, we find that the DNN-based prediction has a much higher accuracy for the empirical dataset due to its ability to extract more generalized knowledge from the data, and this again confirms the benefit of deep learning technology. Moreover, we find that the MSE and R2 score of the TR- and AdaBoost-based predictions are 0 and 1, respectively, for the training dataset, same as Figs. 6 and 7 due to the overfitting. Furthermore, as expected, all predictions show a higher accuracy as the number of samples increases except for the empirical dataset because the performance of machine learning techniques is improved as the dataset becomes larger. Unlike other predictions, the DNN-based prediction shows a more accurate result for empirical data as the number of samples increases, which leads to the conclusion that DNN-based predictions are more appropriate for cases where big data are available. In addition, we find that the R2 score of the DNN scheme is rather low for the training dataset due to the use of dropout.
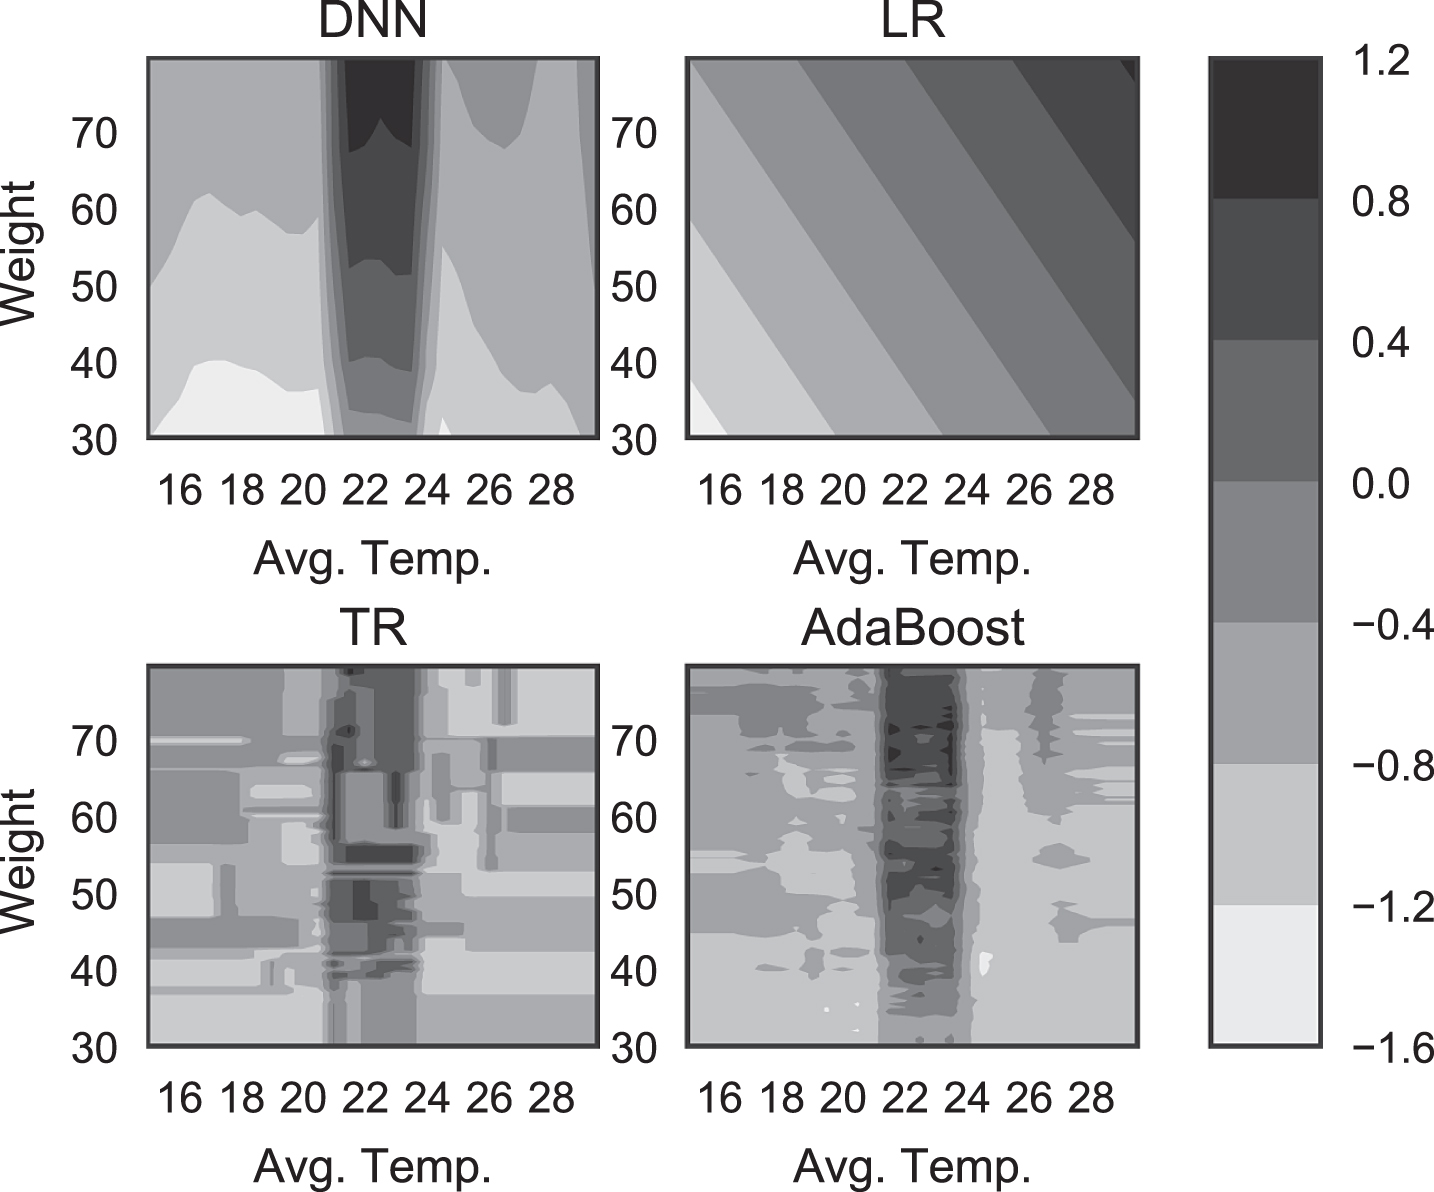
Predicted ADG achieved by varying temperature and weight.
In Fig. 10, we show the predicted ADG achieved by varying the temperature and weight. The humidity and ADFI are set to average values, Nsample = 20000, and P = 0.4. We find that the decision boundary of the linear regression is too simple (underfit) and those of the tree regression and AdaBoost are too complex (overfit). On the other hand, the DNN-based prediction shows a general and reasonable decision boundary, in which ADG is high when the average temperature lies between 20°C and 24°C, and increases as the weight increases.
Finally, in Fig. 11, we show the predicted ADG for the empirical dataset. The results show that the predicted ADG deviates from the empirical data due to the low accuracy. Moreover, we observe that the ADG of the DNN-based prediction is closest to the empirical data.
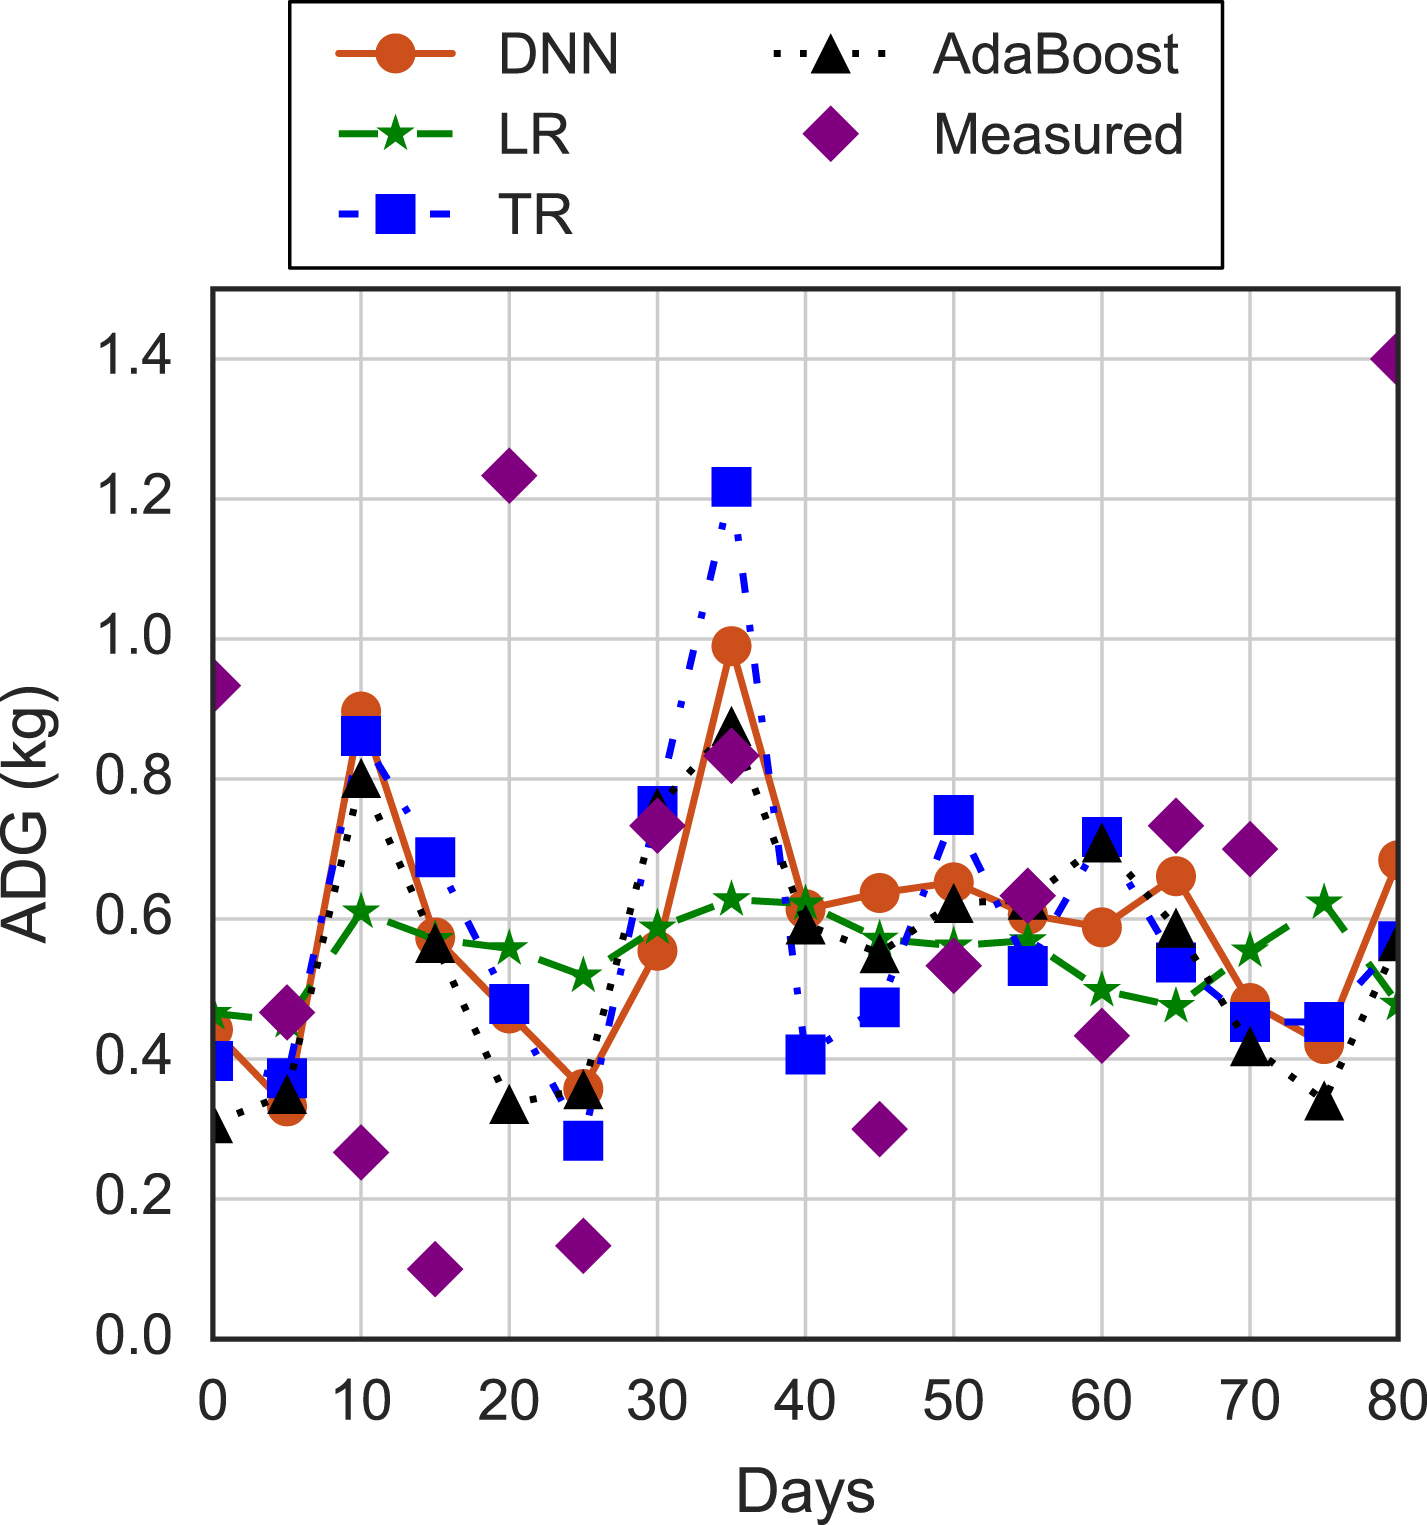
Predicted ADG for empirical dataset.
In this paper, algorithms to predict ADG in pigs using machine learning were explored, where various environmental factors, i.e., temperature, humidity, ADFI, and weight of pigs were taken into account. In order to overcome problems caused by a lack of growth data, we proposed a new way to generate the synthetic growth dataset by combining an empirical dataset with a conventional growth model. Then, four machine learning algorithms, namely linear regression, tree regression, AdaBoost, and DNN, were applied. We used simulations to validate the use of machine learning techniques for ADG prediction, and the characteristics of all the machine learning-based predictions were investigated. We found that DNN-based prediction showed the highest accuracy for the test and empirical datasets, which justifies the use of deep learning technology in livestock science. An interesting extension of this work would be the improvement of ADG predictions using more empirical datasets.
Footnotes
Acknowledgments
This work was supported by Rural Development Administration(RDA) through Cooperative Research Program for Agriculture Science & Technology Development, funded by Ministry of Agriculture, Food and Rural Affairs (MAFRA) (Project No. PJ01229901201801).