
Abstract
This paper proposes a prediction system to identify the type of eye diseases like glaucoma and diabetic retinopathy. The proposed system processes the images captured using the fundus camera that is connected to the computer. The acquired fundus images are fed into the proposed prediction system which can be deployed in the cloud, and it identifies the type of disease. This forms a cyber-physical system. Underdeveloped countries which do not have the necessary infrastructure can utilize this service when this system is deployed in the cloud. For identifying these diseases, ophthalmologists extract parameters manually from the fundus image, which is a difficult task. Hence, this research work attempts to develop a system to automate the feature extraction from fundus images and with the extracted features, eye diseases are predicted. From the literature, it is found that many research works were focused on the binary classification of any one disease. In this paper, a novel classification methodology is proposed that helps the experts and clinicians to classify Diabetic Retinopathy, Glaucoma and healthy eye images with more accuracy. The proposed system with high accuracy is designed with the following phases: i) image acquisition, ii) image enhancement, iii) local features extraction using Speeded Up Robust Feature (SURF), iv) Bag of Features/Visual Words (BoF/BoVW) obtained through k-means clustering of local features, and v) classification using Error-Correcting Output Code (ECOC) linear SVM. It is inferred from the results that proposed method of classification using BoVW provided a maximum accuracy of 92% when compared to other state-of-the-art recent literature.
Introduction
Change in lifestyle and work stress has made the younger generation vulnerable to health conditions like high blood pressure and high blood sugar. Diabetes Mellitus is a health condition in which the sugar level in blood is above the prescribed limit. Number of patients with Diabetes Mellitus is poised to grow drastically in the near future. It leads to a health condition in eye called
The anterior and posterior chambers of eye are filled with aqueous humor. It is a transparent watery fluid, which maintains the intraocular pressure and the ciliary processes continuously produces it. The fluid is drained from the anterior chamber into the blood vessels through the Canal of Schlemm. If there is a blockage in the draining of the fluid, pressure builds in the eye leading to a medical condition called
Fundus photography helps in capturing the image of back of the eye i.e., fundus. Fundus images are ocular documentation that exhibits the appearance of patient’s retina. Clinically, these images are used to examine and diagnose diabetic retinopathy and glaucoma. Blood vessels & neurons of retina are analyzed for diagnosing diabetic retinopathy and optic disc & cup of the eye are analyzed for diagnosing glaucoma.
Manual examination of these images may lead to human errors and these errors can be reduced by analyzing the images using advanced image processing algorithms. Diagnosis of Glaucoma is done by segmenting optic cup and optic disc from the fundus image. Extraction of blood vessels, exudates, and microaneurysms will help in diagnosing diabetic retinopathy.
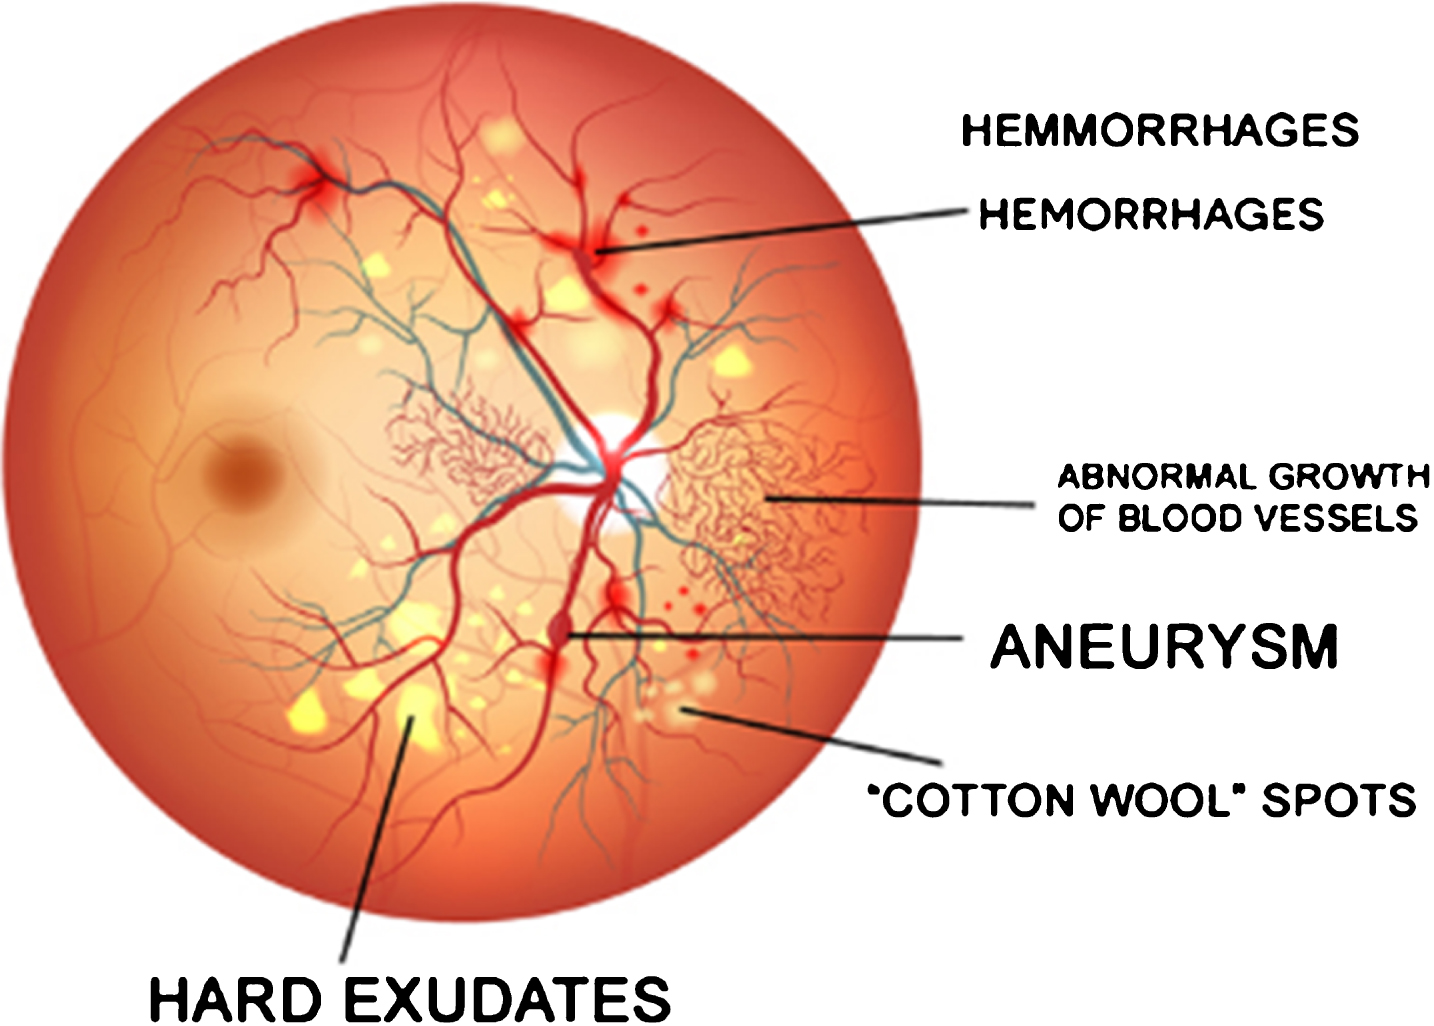
Diabetic retinopathy (Image courtesy:http://www.eagleeyecentre.com.sg/service/diabetic-retinopathy/).
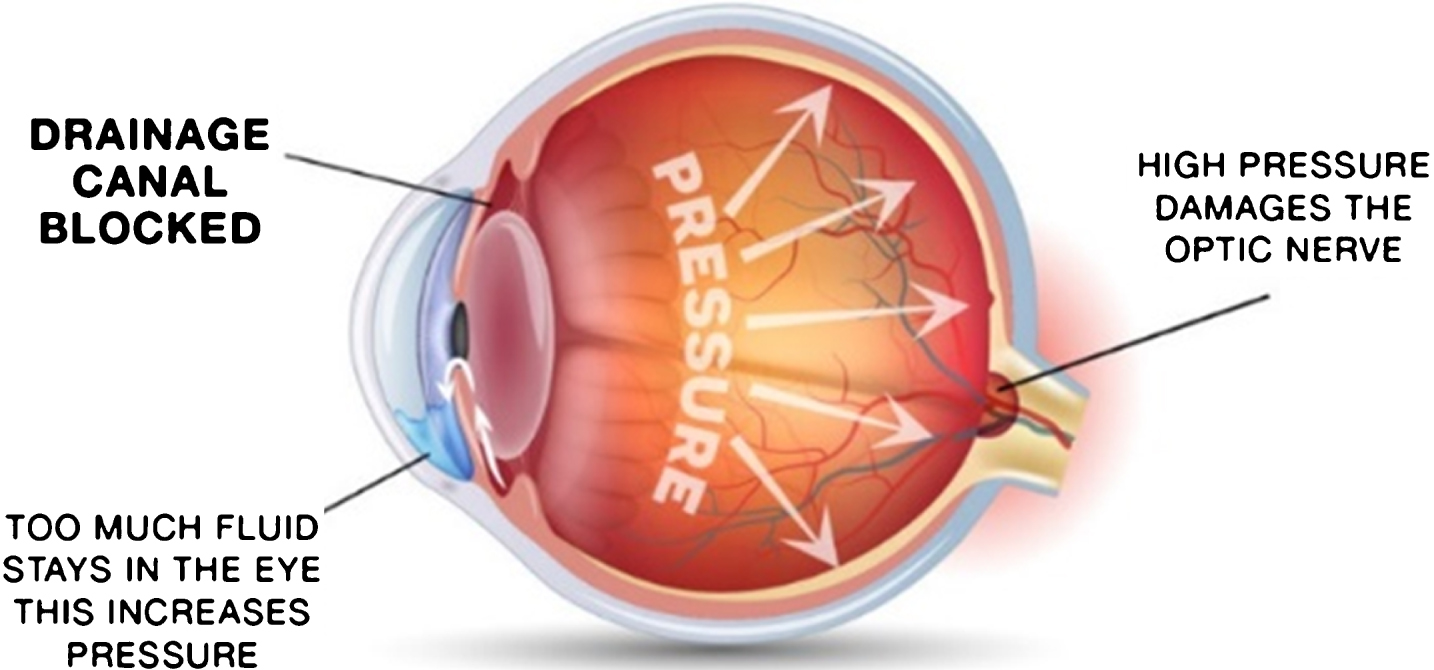
Glaucoma (Image courtesy:http://pgheyemds.com/our-services/glaucoma-treatment-laser-surgery/).
This research focuses on developing a classification methodology that can be deployed in cloud so that clinicians can predict the type of eye disease remotely. The architecture of the system in cloud environment is given in Fig. 3. Workflow of the prediction system in given in Fig. 4. In the proposed system, fundus images are acquired using fundus photography and it is given to the prediction system. The images are enhanced, and local features are extracted using SURF. After the extraction of local features, clustering is performed. Bag of Visual words or Bag of Features is formed using the cluster centers. This Bag of Features is given as input for classification of diseases.
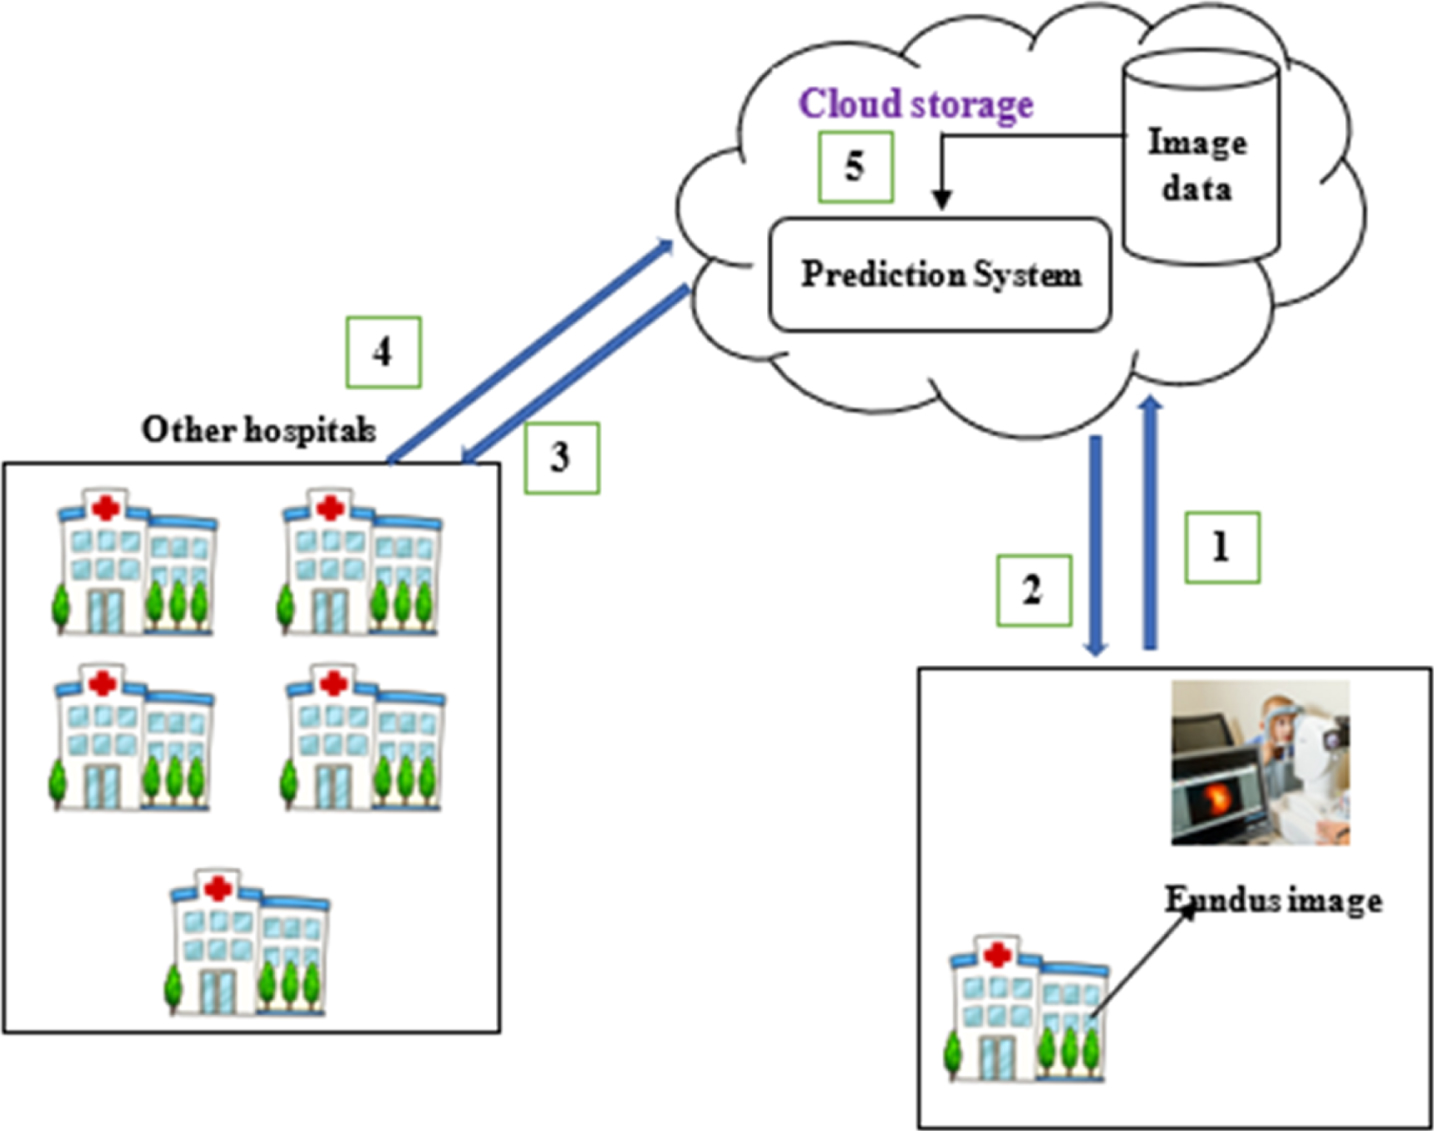
Architecture of the proposed system 1) captured fundus image is given to the prediction system, 2) the result of the classification is given back to the hospital, 3) & 4) hospitals with access to the cloud can utilize the system, 5) images of different diseases are stored in the database to train the system and the database is updated as new images are given as input from different source.
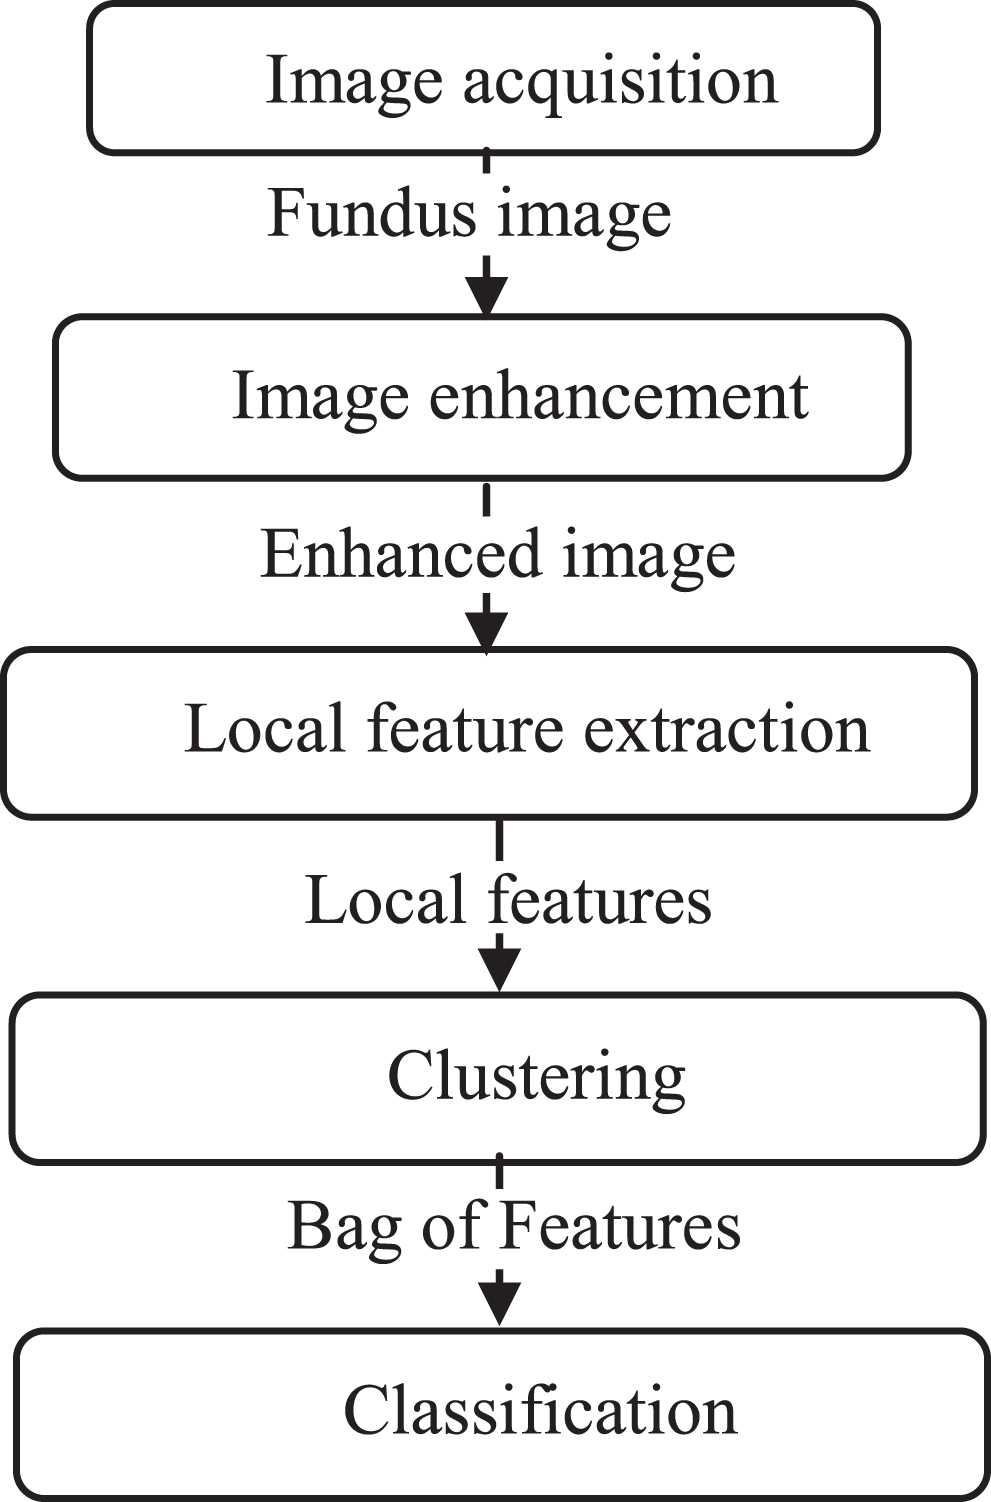
Workflow of the prediction system.
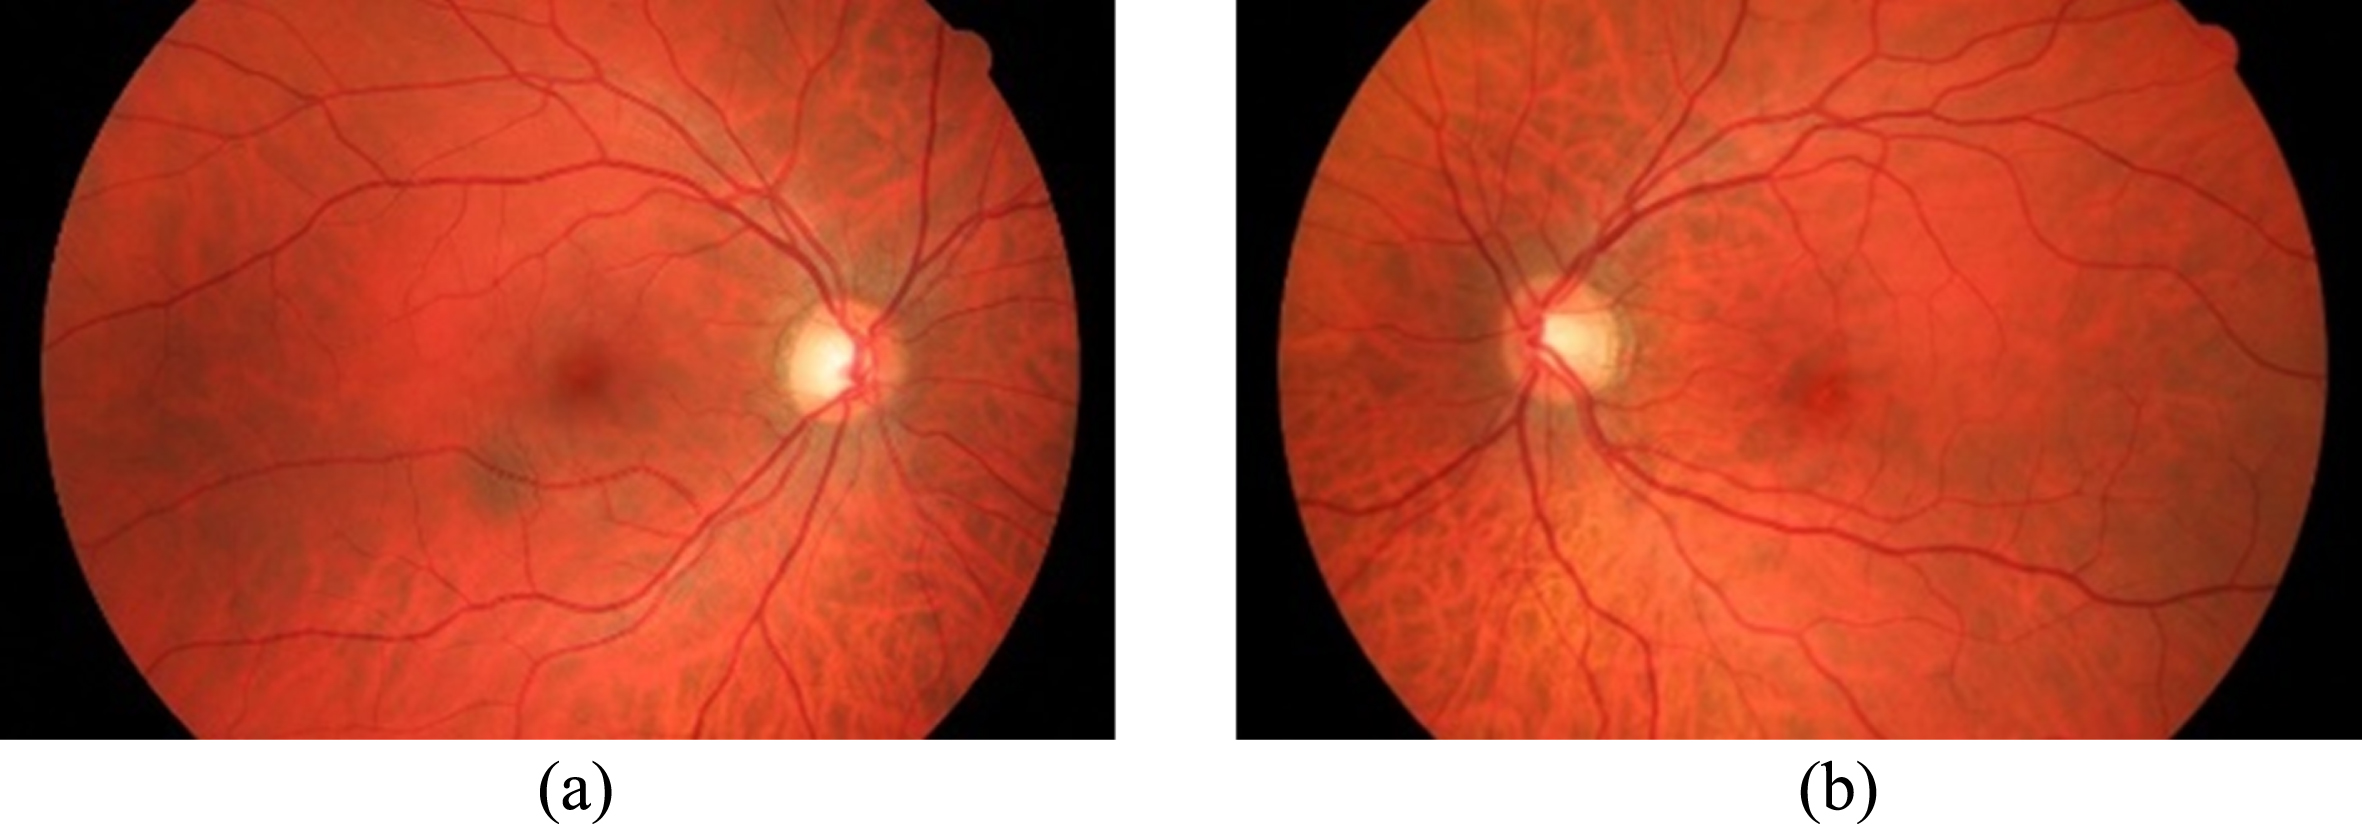
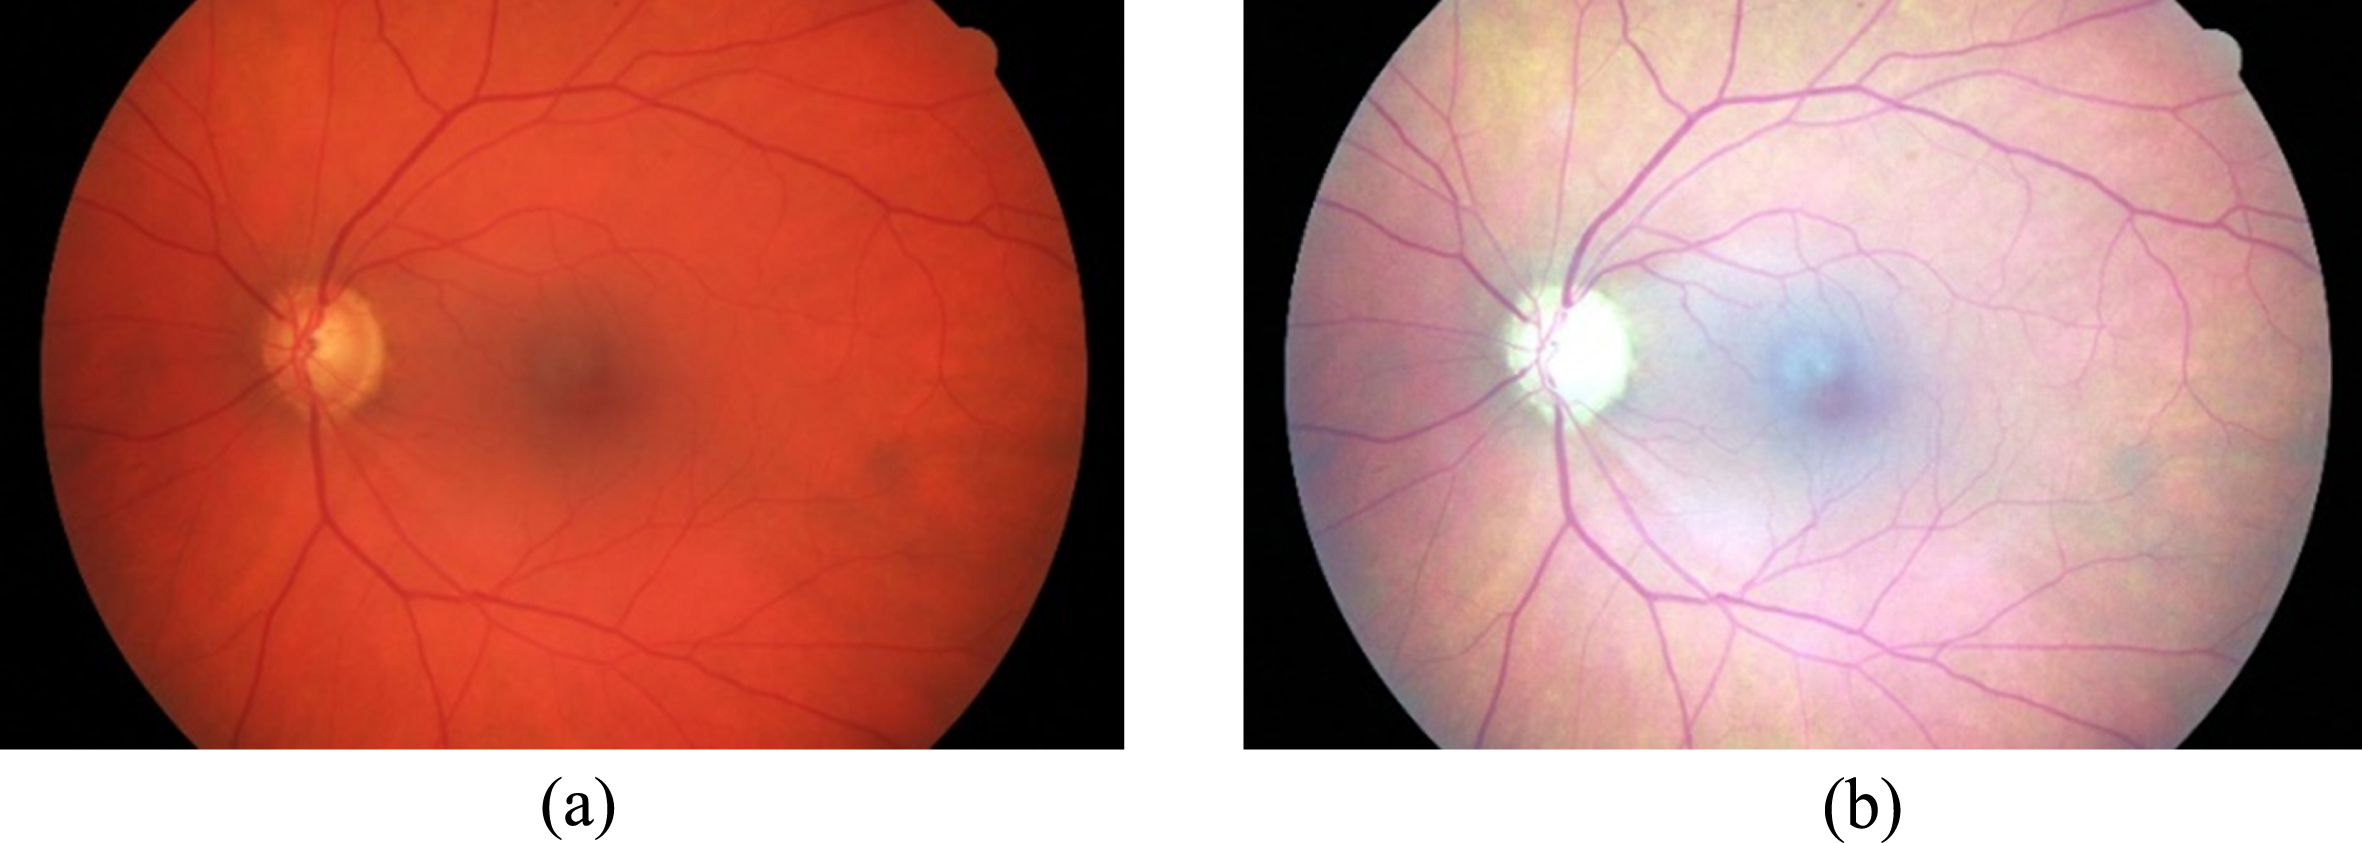
(a) Fundus image of healthy eye (Left eye). b) Fundus im-age of healthy eye (Right eye).
The proposed classification approach is implemented and validated with the images from High Resolution Fundus (HRF) image database [1]. The dataset has a total of 45 images that include healthy eye, glaucoma, and diabetic retinopathy with a resolution of 3504x2336. This dataset is chosen because of the image quality and proper categorization. Sample fundus images of healthy eye, glaucoma, and diabetic retinopathy are shown in Figs. 5, 6, and 7.
With advanced image processing and machine learning algorithms, diagnosis of eye related diseases has become an emerging field of research and some significant contributions that established groundwork for the proposed approach are given:
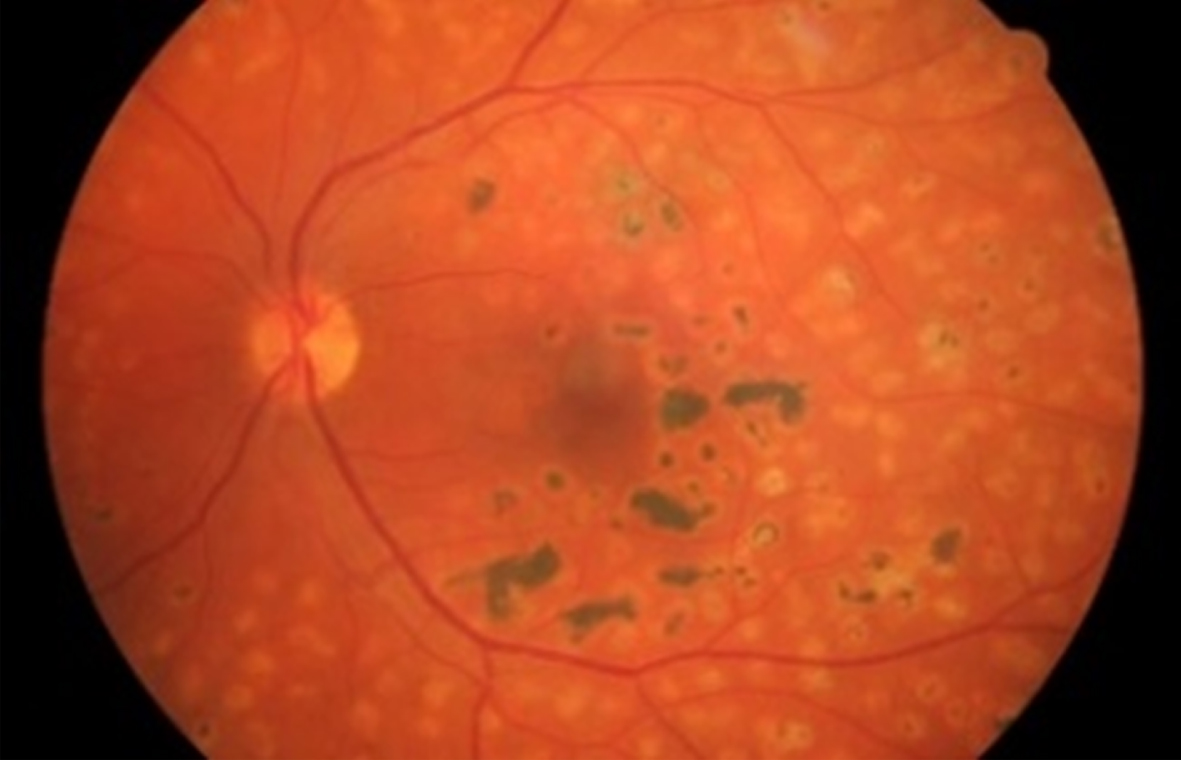
Fundus image of Diabetic Retinopathy.
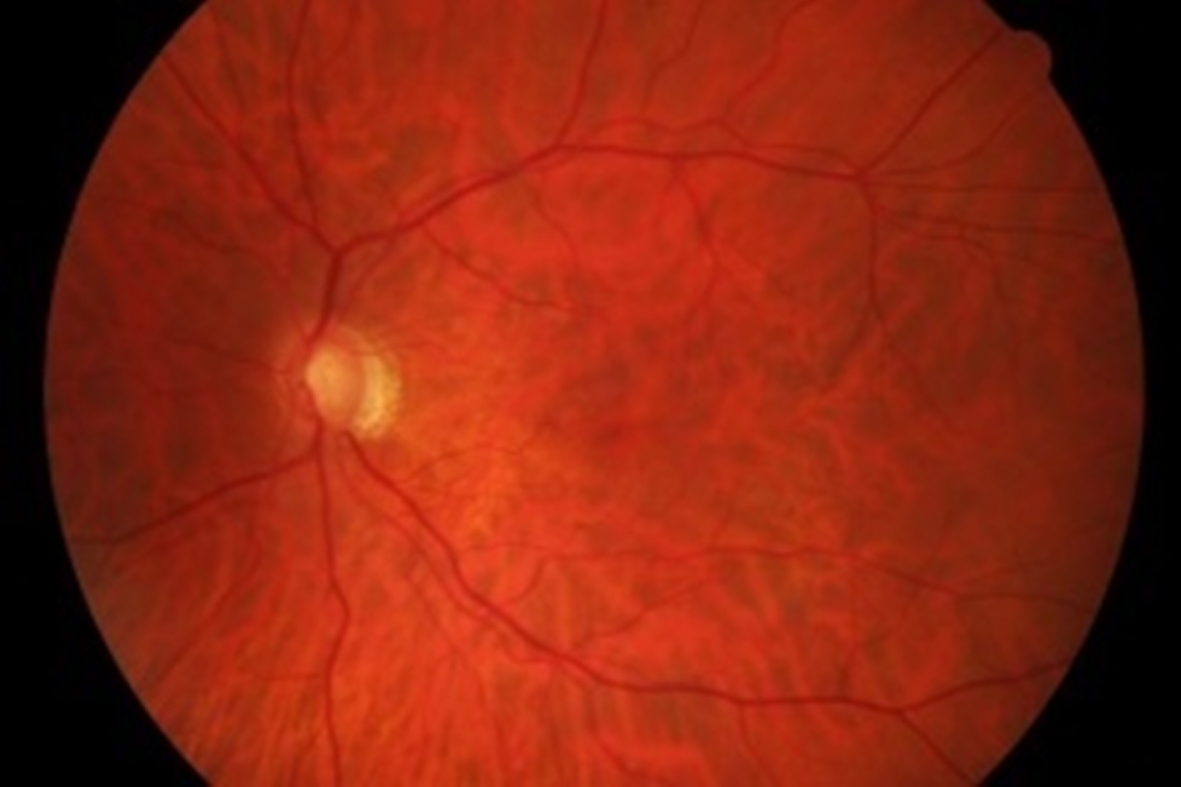
Fundus image of Glaucoma.
Detection of Glaucoma: Liu et al. proposed an automated Cup-to-Disc Ratio (CDR) measuring scheme to analyse fundus images of glaucoma using Level-set Image Processing called ARGALI for automatic glaucoma risk assessment [2]. Liu et al. framed a system architecture named AGLAIA that uses active contour for segmentation of Optic Disc and Optic Cup [3]. Bock et al. proposed a probabilistic two-stage classification to extract Glaucoma Risk Index (GRI) to detect glaucoma. It combines Generic feature types compressed by an appearance-based dimension reduction [4]. The proposed method has an accuracy of 88%. Muramatsu et al. proposed a method that uses Retinal nerve fiber layer defect (NFLD) which is major sign for glaucoma [5]. Madhusudhan et al. proposed segmentation process that uses Multi-Thresholding, Active contours and Region growing for segmenting disc and cup; using this CDR was calculated to diagnose Glaucoma [6]. Optic disc and optic cup segmentation is done using super pixel classification [7]. The proposed method uses histograms and center surround statistics for classifying each pixel as disc or non-disc. For optic cup, location in-formation is used along with histograms and statistics around center. Anusorn et al. proposed a method to extract Optic cup and disc [8]. Optic disc was segmented using edge detection and variational level-set. To detect optic cup, color component analysis and threshold level-set method were used. Salam et al. proposed a methodology, which is a fusion of CDR with Hybrid textural and intensity features [9]. The methodology achieves an accuracy of 92%. Salam et al. proposed a novel algorithm that uses structural and non-structural features to diagnose glaucoma [10]. It also introduces a suspect class in case of a conflict in decision from structural and non-structural features. A ratio called CDR is found based on which glaucoma is identified. To find CDR, precise segmentation of optic disc and cup from fundus image is required. Multi-label Deep Learning architecture called M-Net and polar transformation are used for segmenting the optic disc and optic cup from fundus image [11]. The accuracy achieved was 89% using CDR to diagnose glaucoma.
Diabetic Retinopathy (DR): It is caused by a medical condition called Diabetes Mellitus. Segmentation of exudates, hemorrhages and microaneurysm from fundus image is required to diagnose DR. Gardner et al. proposed Artificial Neural Networks (ANN) that detect vessels, exudates and hemorrhages [12]. Using ANN, DR was detected with a sensitivity of 88.4% and a specificity of 83.5%. Csurka et al. proposed a new approach based on Bag of Keypoints for visual categorization [13]. This method uses vector quantization of descriptors of image blocks which are affine invariant and k-means clustering for generating the bag of keypoints. This bag of keypoints is used as input by classifiers for categorization. Fleming et al. used multi-scale morphological process to detect candidate exudates [14]. The likelihood of the candidate being classified as exudate, drusen or background is decided based on local properties. Optimally adjusted Morphological operators are used for detecting exudates which is a primary sign of diabetic retinopathy [15]. Acharya et al. proposed SVM classifier that uses higher-order Spectra to detect DR stages with a sensitivity of 82% and specificity of 88% [16]. Ophthalmologists recognize DR based on features, such as blood vessel area, exudates, hemorrhages, microaneurysms and texture [17]. Sujatha et al. proposed a Fuzzy based Multiple Dictionary Bag of Words in which a dictionary is built using soft clustering algorithm [18]. Welikala et al. proposed a system for automated detection of DR that uses standard line operator and modified line operator to generate the vessel maps [19]. Local morphological features are extracted from the two vessel maps to create two separate feature sets. Classification was performed using Support Vector Machine (SVM) individually for these feature sets and the system combines the result of the two individual classification outcomes to produce final decision. The system produced a sensitivity of 86.2% and a specificity of 94.4%. Shinomiya et al. proposed the use of Fuzzy C-Means clustering along with Scale Invariant Feature Transform for generating the Bag of Features which can be used for classification [20]. Azzopardi et al. proposed a filter called B-COSFIRE (Bar-Combination Of Shifted Filter Responses) for vessel delineation that can be used in DR classification [21]. Gulshan et al. used Deep learning algorithm for automatic detection of DR and Macular edema in retinal fundus image [22]. Abramoff et al. used Convolutional Neural Network based anatomy detector and lesion detectors to extract the features from the fundus images [23]. These features were given as input to a fusion classifier implemented using random forests. Costa et al. proposed a Bag of Visual Words (BoVW) that uses local features to learn a visual dictionary and creates mid-level representations of the image using the visual dictionary [24]. The generated mid-level representations are used for identifying the DR in fundus image.
From the literature survey, it is inferred that many of the research works are carried out to do binary classification (i.e.) the classification is done to check whether the given fundus image has glaucoma or not. In this paper, a multi-class classification is implemented that takes bag of visual words extracted from fundus images of glaucoma, diabetic retinopathy, and healthy eyes as input.
This article is organized as follows: Section –2 presents the methods used for classification; Section –3 gives the proposed classification approach; Section –4 comprises of the results and discussion; and Section –5 concludes the research work with its future scope.
Image acquisition
Image enhancement
Image enhancement is the process of boosting the image quality through noise removal and improving the contrast such that the enhanced image suits for further analysis. Prominent enhancement techniques are contrast stretching, histogram equalization, bit plane slicing, intensity transformation, etc. In this research work, contrast stretching is employed to improve the quality of the images and it helps in extracting fine features from the image.
Bag of Features (or) Visual words
BoF comprises of the following steps: i) extraction of local features from the image, and ii) building the vocabulary. Local features of the image are extracted using SURF descriptor. From the extracted local features, the key points or predominant features are elected using k-means clustering and the vocabulary is built.
SURF
Speeded Up Robust Features (SURF) is a scale- and rotation-invariant detector and descriptor proposed by Bay et al. [26]. It outperforms the other feature extractors like Shift Invariant Feature Transform (SIFT), automatic scale selection, cascade filtering approach, Maximally Stable External Regions (MSER) with respect to repeatability, distinctiveness and robustness. It is claimed that SURF features are extracted from the images much faster than the other local descriptors. SURF descriptor detects the interest points using basic Hessian matrix approximation. It makes use of integral images which are made prominent by Viola et al. [27].
i) Integral images
Integral images are used in this descriptor to support fast computation of box convolution filters. Integral image I
Σ
(x) at a location x = (x, y)
T
presents “the sum of all pixels of the input image I within a rectangular region formed by the origin and x”. It is given in the Equation (1).
After computing the integral image, sum of the intensities within the upright rectangular area is computed throughout the image.
ii) Hessian Matrix based interest points
Hessian matrix and its properties of an image gives the details about corners and blob-like structures of an image. Maximum determinant value of the Hessian matrix represents the blob-like structures of an image more precisely. Consider a point x = (x, y) in an image I, the Hessian matrix
iii) Scale space representation
Interest points in the image are identified at different scales of the image. It will be helpful in comparing the interest points at different scales. Image pyramids (Fig. 8) are used to implement the scale spaces.
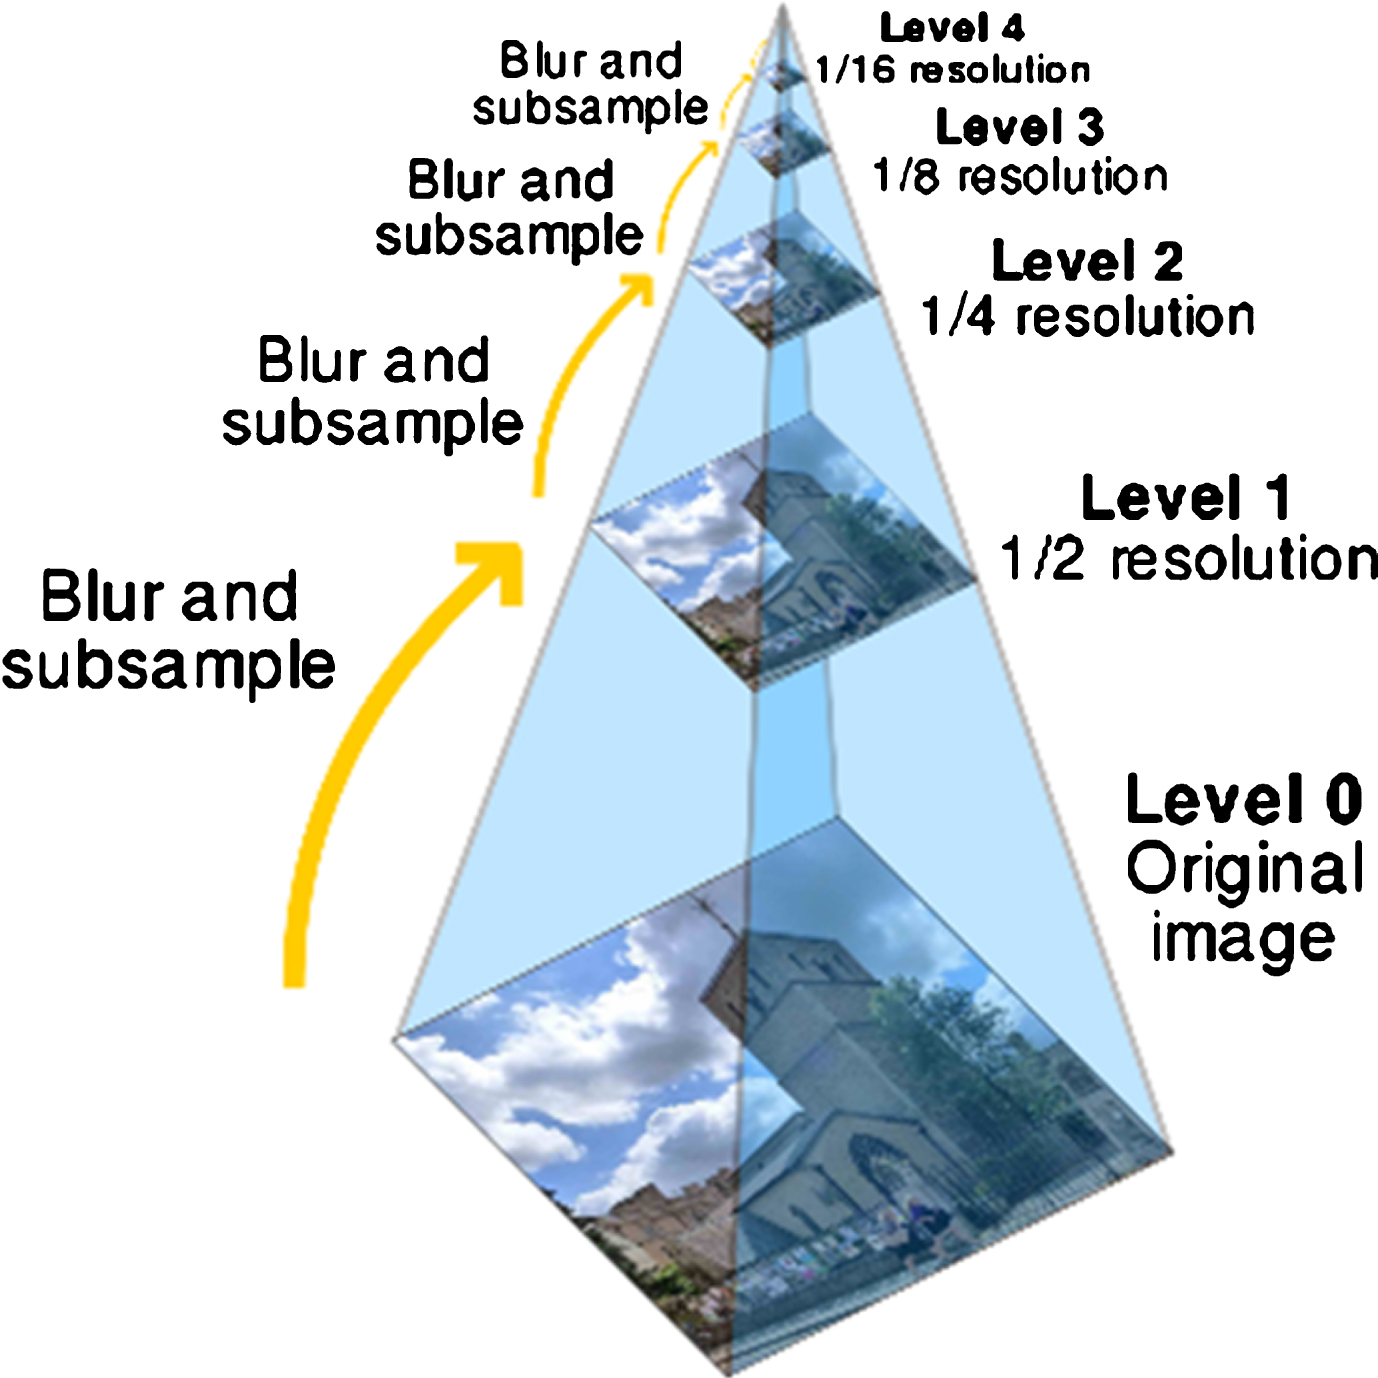
Image pyramid with different scales (Image Courtesy: https://en.wikipedia.org/wiki/Pyramid_(image_processing).
These images at different scales are subtracted to get the Difference of Gaussian images where the blobs and edges can be identified easily [30]. Box filter of any size is applied to the original image and to the subtracted images at different scales. Hence, scale-space of the image is analyzed by up-scaling the size of the filter instead of reducing the size of the image as shown in the Fig. 9.
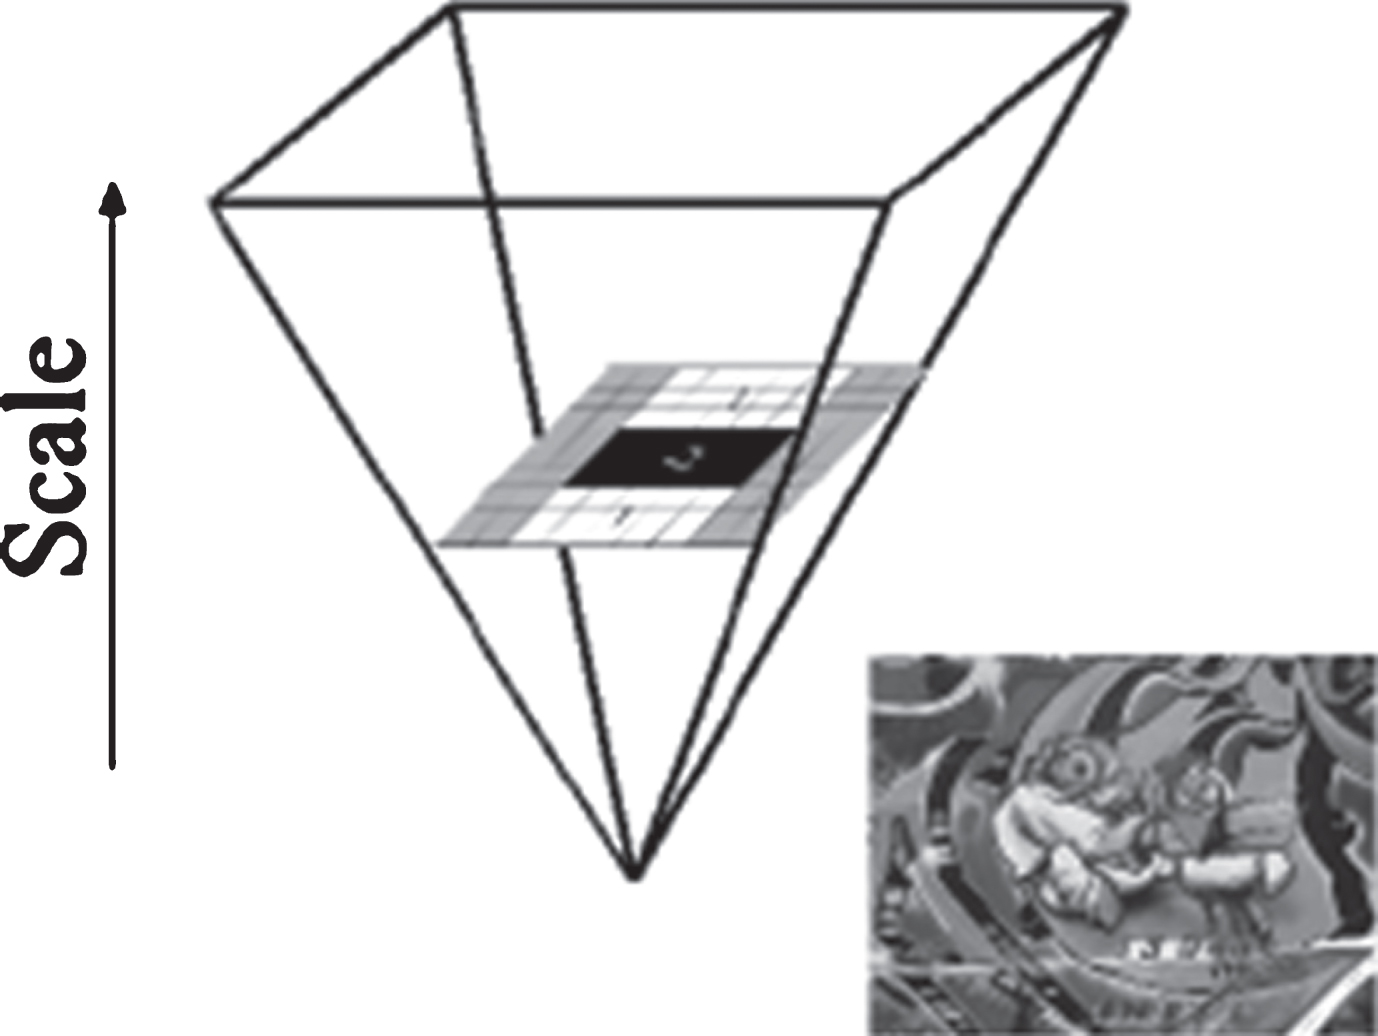
Up-scaling the filter size (Image Courtesy: Bay et al. [26]).
As down-sampling is not implemented in the images, there is no need for aliasing. Pixels with high frequencies may be lost when the image is zoomed out at different scales. But, use of box filters preserves these high frequencies. It results in limited scale-invariance. The scale space shown in image pyramid (Figs. 8 and 9) is divided into octaves. Generally, in each octave, the resolution of the image is halved or doubled to fetch the finer features from the image. But, in SURF descriptor, the image resolution remains same and the size of the filter is scaled by a factor of 2 at each octave. Entire scale space is sub-divided into a fixed number of octaves. As integral images are discrete in nature, “the minimum scale difference between two subsequent scales depends upon the length (l0) of the positive or negative lobes of the partial second order derivative in the direction of derivative either x or y”.
iv) Interest point localization
Interest points in the image and over the scales are localized by applying a non-maximum suppression of 3×3×3 neighborhood. Fast variant proposed by Neubeck et al, is used [31]. Maximum determinant values of the Hessian matrix are interpolated in scale and image space [32]. This interpolation is mandatory because the difference between every octave’s first layer is relatively large.
Local features extracted from the image using SURF descriptor are given as input for k-means clustering [33, 34]. Initially, key points are chosen randomly and then clustering is done for k iterations to identify features from the image. k-means clustering is an unsupervised learning algorithm that classifies the given data with certain k-number of clusters and to define k-centers, one for each cluster. In first iteration, centers are placed far away from one another. Next, each point belonging to the dataset is associated with the center which is closer to it. When all the points are associated with their closest center, first level of clustering is done. Then, new cluster centers are recalculated, and the data points are reclustered. Iteration stops when the cluster centers cannot move or change further. In BoF, the local features are given as input for clustering algorithm and the resulting clusters are the vocabulary built for further classification. Algorithmic representation of k-means clustering is given as below:
In this research work, support vector machine is used for classifying the images of glaucoma, diabetic retinopathy and healthy fundus images. Basically, SVM is designed as a binary classifier. Decision tree algorithm C4.5 [35], CART [36], and binary concept learning with distributed output learning are some of the approaches to solve the multi-class problems. SVM algorithm is extended to solve multi-class problems by employing Error Correcting Output Codes (ECOC) for distributed output representation [37]. The extended SVM algorithm with ECOC is used for the classification of the images with its vocabulary.
ECOC model reduces the multi class problems into a set of binary classifiers. If there are 3 classes, then three SVM classifiers are employed for classification. ECOC model requires a proper coding and decoding schemes to decide the number of learners to be used in the classification. Coding determines the classes for which the learners are to be trained, decoding aggregates the results from the binary classifiers. There are many coding schemes like, one-versus-all (OVA), one-versus-one (OVO), binary complete, ternary complete, ordinal, dense random and sparse random. Based on the number of classes, coding and decoding schemes will be selected and multi class problems are solved.
Proposed classification approach
The proposed classification methodology to classify the fundus images comprises of following steps: i) contrast stretching, ii) Image flipping, iii) SURF, iv) k-means clustering, and v) SVM-ECOC.
Contrast stretching
Fundus images are acquired from the HRF image dataset [1] and the images are enhanced by using contrast stretching technique. It is the process of normalizing the contrast level throughout the image. Pixel intensities are normalized such that these intensities span the required range of values. The global maximum and minimum intensity values of the RGB image are 255 and 0 respectively. Maximum and non-zero minimum intensity values of the image are considered as local maximum and minimum respectively. With these maxima and minima values, the contrast of the input image is enhanced pixel by pixel through Equation (3).
HRF image dataset comprises of fundus images of healthy eye, glaucoma, and diabetic retinopathy. It holds the images of both left eye and right eye. When the combination of left eye and right eye images are given, it may lead to misclassification. In this intuition, all the images are flipped towards right or left and then given as input for the next phase.
SURF descriptor
SURF descriptor explained in section 2.2.1 is applied on the flipped images. From 45 enhanced flipped fundus images of glaucoma, diabetic retinopathy and healthy eyes, 2,30,21,280 features are extracted. From the 2,30,21,280 features, 80% of the strong features are retained from each category, and these strong features are 1,14,17,024 in total.
(a) Original image. (b) Contrast enhanced image.
k-means clustering is an unsupervised learning algorithm and the steps involved in the clustering process are explained in section 2.3. The algorithm is implemented with the features extracted from the images and the steps are given as follows:
In the experiments conducted with the HRF dataset, maximum of 100 iterations are fixed and clustering process converged between 27 and 30 iterations. The resultant local features are clustered, and the cluster centers form the bag of visual words that is used for classification. The bag of visual words is plotted as histogram and it is shown in Fig. 11.
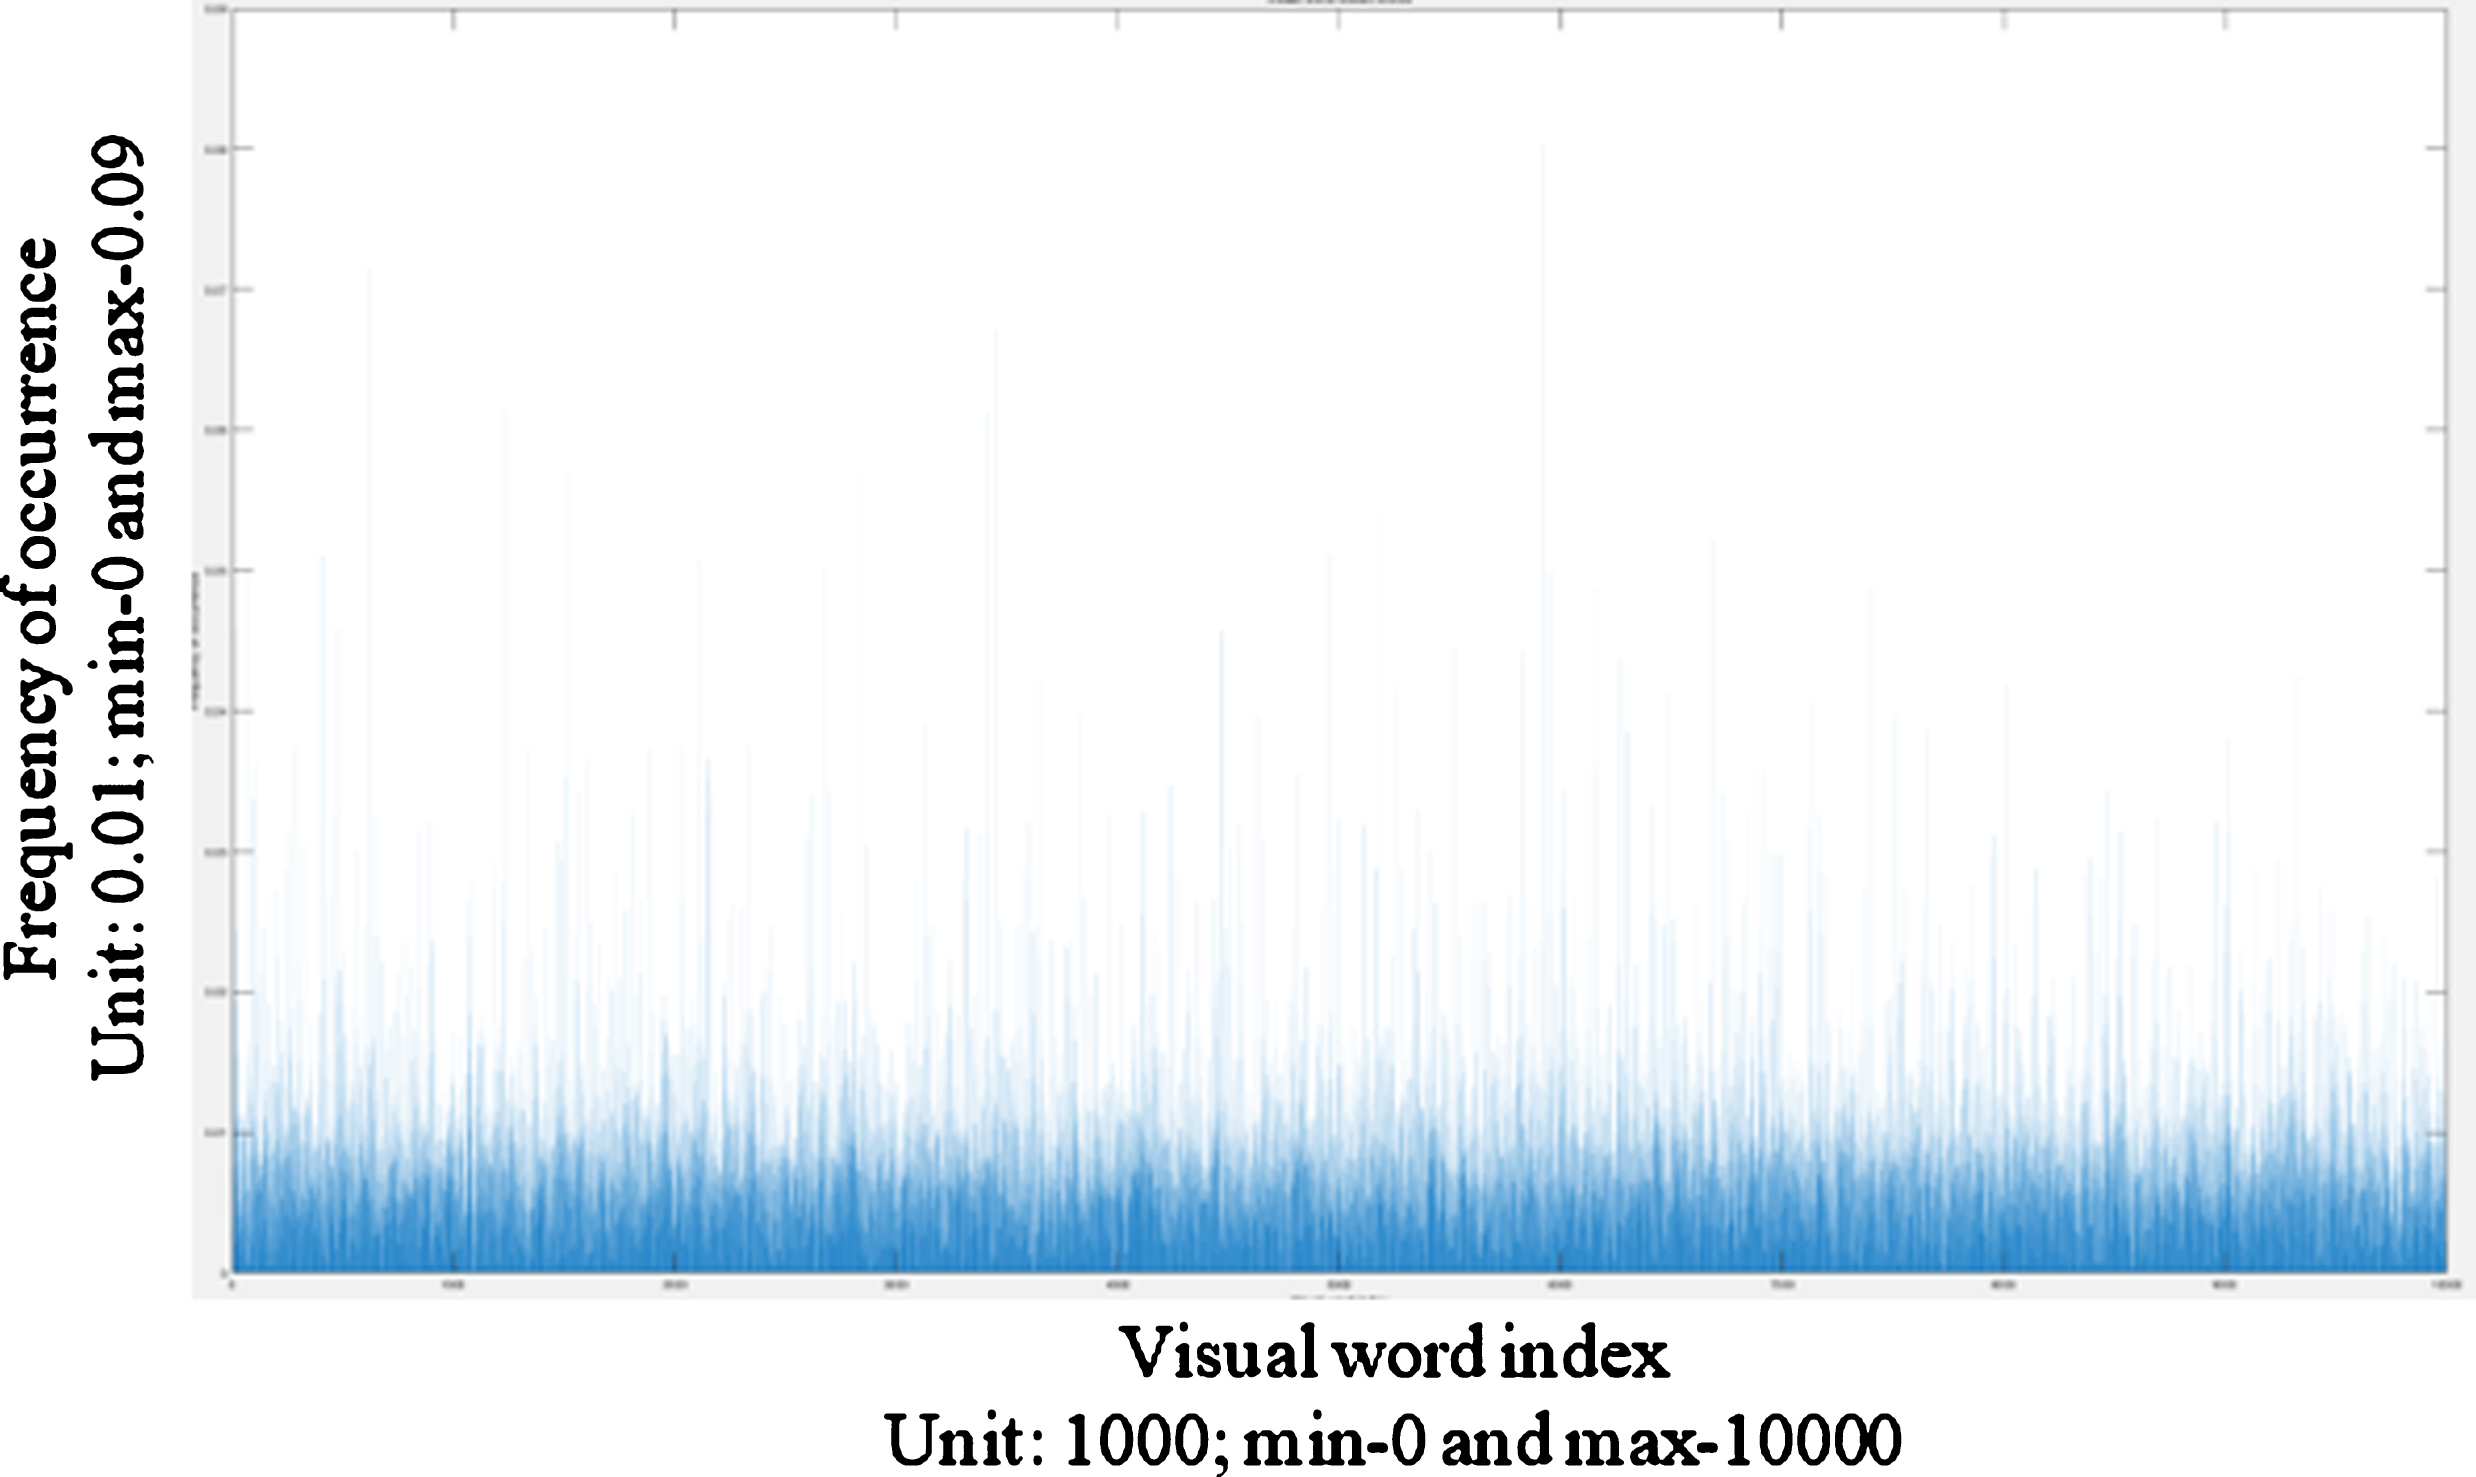
Vocabulary of the image features.
Ensemble of SVM learner is designed with ECOC. Basics of SVM and ECOC are explained in section 2.4. In this paper, SVM-ECOC is used for solving problem with three classes. To propose an ensemble to classify three classes, prominent binary learner SVM, one-versus-one (OVO) coding scheme and lossg decoding scheme is chosen. In OVO coding scheme, if there are k classes, then
Here, for glaucoma, diabetic retinopathy, and heathy images, separate SVM learners are assigned. OVO coding for fundus image classification is given in Table 1. From Table 1, OVO coding determines the classes that the binary learners need to be trained for.
Proposed OVO coding for Fundus image classification
Proposed OVO coding for Fundus image classification
In this scheme, learner-1 considers class-1 as positive observations, class-2 as negative observations, and class-3 is ignored. Likewise, learner-2 considers class-1 as positive observations, class-3 as negative observations and class-2 is ignored. Learner-3 considers class-2 as positive observations, class-3 as negative observations and class-1 is ignored.
Let CM be the coding matrix with elements cmkl, and score
l
be the predicted classification score for the positive class of learner l. Arbitrary input is assigned to the class that minimizes the aggregation of losses for the L learners [37]. It is given in Equation (4).
Escalera et al. [38] claimed that ECOC models provide better classification accuracy than the other multi-class classification models [37, 39]. In total of 45 images, 33 images are given for training and 12 images are given for testing. Results of classification are tabulated in Table 2. From Table 2, it is inferred that 92% of classification accuracy is achieved.
Classification accuracy achieved with enhanced, flipped images with 10,000 cluster centers
An ensemble of multi class learner that is composed of linear SVM [40] is proposed and the images are classified based on the Bag of Visual Words acquired from the SURF descriptor and k-means clustering. The experiments are conducted with the images acquired from HRF images dataset [1] that comprises of 45 images (15 glaucoma, 15 diabetic retinopathy, and 15 healthy images). Input data is categorized in separate folders and given as data store for processing. In feature extraction process, during each iteration, images are given as input in random. Local features are extracted using SURF and clustering is done with minimum of 500 and maximum of 10000 clusters. The extracted features are given as input for classification. From the data store, 33 images are given for training and 12 images are given for testing. Classification results acquired with minimum and maximum cluster centers are explored here. Following are the different cases of the experiments conducted:
Classification accuracy achieved with raw fundus images with 500 cluster centers
Classification accuracy achieved with raw fundus images with 500 cluster centers
Classification accuracy achieved with enhanced fundus images with 500 clusters
Classification accuracy achieved with flipped, enhanced fundus images with 500 clusters
Classification accuracy achieved with raw fundus images with 10000 clusters
Classification accuracy achieved with enhanced fundus images with 10000 clusters
In the experiments, for each case, the learner is trained with different sets of images in a random manner and maximum accuracy achieved is quoted here. In literature, dichotomous classification is implemented for any single disease. Hence, the multi-class classification results of the proposed work cannot be compared with the dichotomous classification. So, the performance analysis is done by comparing the cases 1 to 6 implemented with the Decision SVM classifier [41] and evaluation metrics like accuracy, precision, sensitivity, and specificity are calculated and it is given in Table 8.
From the Table 8 it is inferred that,
ECOC – SVM performed better than the DT – SVM in terms of all the three classes
DT – SVM performs better with respect to true negative rate, i.e. Specificity
Both ECOC – SVM and DT – SVM classifies the healthy eye images correctly with maximum of 100% accuracy
Classification done by ECOC-SVM with enhanced-flipped fundus images with 10,000 features gave consistent results for all the three classes with overall accuracy of 92%.
The limitation encountered while conducting these experiments is the exponential increase of processing time with the increase in number of cluster centers. Even though, the processing time is increasing exponentially, classification accuracy achieved is promising when the number of cluster centers is increased.
In future, the clustering process can be optimized for reducing the processing time and also an ensemble can be constructed with different learners.
Performance analysis
DR – Diabetic Retinopathy; G – Glaucoma; H – Healthy; DT – Decision Tree.
In this research work, a system is developed that classifies the fundus images of glaucoma, diabetic retinopathy and healthy images by using Bag of Visual words or Bag of features. The proposed system achieved a maximum classification ac-curacy of 92%. The system can be deployed in cloud so that the clinicians around the world can utilize remotely. The experiment is conducted by taking the images from HRF image database and these images are shuffled randomly and given for classification. To achieve better classification accuracy, prominent features from the images are acquired using SURF and k-means clustering process. It is concluded that from various test cases of the experiment, classification done with 10000 cluster centers chosen from contrast enhanced and flipped images achieved better classification accuracy of 92%. And, the classification accuracy achieved is compared with the different test cases of the experiments with ECOC-SVM and Decision tree-based SVM (DT-SVM). As most of the research works are carried out as dichotomous classification, it is not possible to compare the existing results with multi–class classification problem. In the proposed approach, ECOC–SVM is replaced with DT-SVM and performance analysis is done. The limitation encountered during the implementation process is the exponential increase of processing time with respect to the increase in cluster centers. In future, it can be resolved by optimizing the clustering process. Also, new ensembles with different supervised and unsupervised learners can be developed for solving multi-class problems.
Footnotes
Acknowledgement
We, the authors would like to thank the Department of Science and Technology, India for their financial support through Fund for Improvement of S&T Infra-structure (FIST) programme (SR/FST/ETI-349/2013). We also sincerely thank the SASTRA Deemed to be University for providing an excellent infrastructure to carry out the research work.