



Abstract
The identification of overlapping protein complexes in proteinprotein interaction (PPI) networks may elucidate cellular functional organizations and their underlying cellular mechanisms. Recently, many protein complex mining algorithms have been developed for PPI networks. However, the majority of available algorithms primarily depend on mining dense subgraphs as protein complexes, thereby failing to consider the inherent biological meanings between protein pairs. Thus, methods for identifying protein complexes using the biological significance hidden in edges need to be investigated. In this paper, we propose IK-medoids, an improved method that detects overlapping protein complexes from weighted PPI networks based on the rough fuzzy relationships between protein pairs. The presented algorithm is primarily based on the fuzzy relationship that obtains the non-overlapping protein substructure, and then K-medoids is executed from the proteins in the PPI network. Next, the similarity between one protein and each candidate complex is calculated to determine whether the protein belongs to one or multiple complexes with the ration of each similarity to maximum similarity. In the end, overlapped protein complexes are merged to form the final protein complexes. We apply the method to three PPI networks and validate the results using two reference protein complexes retrieved from public databases. Experimental results show that our method outperforms classical algorithms, such as ClusterONE, CMC, MCL, OSLOM, and RFC, and achieves ideal overall performance in terms of F-measure, sensitivity, and accuracy.
Introduction
The identification of protein complexes is important in different organisms because it helps clarify biological processes and reveal inherent organizational structures within cells. With the development of computational methods, lots of protein complex detecting algorithms have been developed for protein protein interaction (PPI) networks. However, the majority of available algorithms primarily depend on mining dense subgraph as protein complexes [1, 2], thereby failing to take into account the condition that a protein may have multiple functions; therefore, the corresponding nodes may belong to more than one cluster [3]. Such conditions are challenging for classical protein complex mining algorithms that assign each node of the PPI network to just one of the protein complexes. Recently, many methods have been proposed that identify overlapping protein complexes in unweighted PPI networks [4–7].
Recent studies have concluded that the accuracy of protein complex identification can be significantly improved by eliminating false positives with weights in PPI [7]. Several algorithms have been executed on weighted PPI networks to identify protein complexes [7–15]. Notably, the aforementioned methods are used to detect protein complexes using network topological features; however, the major shortcoming of this is that their performance will deteriorate rapidly when applied to sparse PPI networks [16, 17]. Motivated by this issue, a number of researchers have demonstrated that the accuracy of protein complexes can be improved by exploiting various proteins data, such as gene expression information [18–20] and multiple heterogeneous data sources [20, 21]. Despite the advantages of these approaches, the aforementioned methods for predicting protein complexes have the following common limitations: The quality of protein complexes is limited by incomplete gene expression data. They are unable to identify accurate overlapping protein complexes. The identification of real protein complexes with few interactions have not been significantly improved, which limits improvements on detection accuracy of protein complexes.
To achieve a breakthrough of protein complex identification, we introduced a novel approach to detect overlapping protein complexes in PPI using rough fuzzy clustering algorithm (RFC) [12]. RFC detects overlapping protein complexes in PPI networks based on the fuzzy relation model, which first obtains equivalence classes (non-overlapping protein complexes). Subsequently, the upper and lower approximations of rough sets are used to evaluate if the proteins belong to one or multiple protein complexes based on the ratio of each similarity to the maximum similarity.
Unlike classical clustering algorithms [12, 22], an improved K-medoids, called IK-medoids, which is based on the rough fuzzy theory, can effectively detect overlapping protein complexes in PPI networks. The algorithm consists of three major steps: first, we transform the adjacent matrix of the PPI network to the fuzzy matrix according to the GO similarity value between all protein pairs in the networks. The fuzzy matrix is then transformed into the fuzzy equivalence relation by transitive closure, where the λ-cut matrix is used to achieve the equivalence classes, i.e., non-overlapping substructure, which is sorted in a descending manner according to their similarity values. Next, starting from the non-overlapping substructure with the highest similarity value, the algorithm iteratively updates the clustering center in each substructure until no change in the protein substructure is observed, which is called candidate protein complex. Thereafter, the similarity ratio of each protein and candidate complex is computed, an appropriate value is chosen, and the candidate complex is evaluated whether it is overlapping. Finally, the overlapping extent between each pair of candidate protein complexes is quantified, wherein those with overlapping scores above a specified threshold are merged.
To validate the ability of IK-medoids, we applied it to three PPI networks and compared it with five state-of-the-art algorithms by using two reference protein complex datasets retrieved from public databases. Experimental results showed that our method outperformed other algorithms in most datasets in terms of F-measure, sensitivity, and accuracy.
Methods
A PPI network is modeled as an undirected weight graph G = (V, E, w), where V is a set of vertex (proteins), E is a set of edges (protein pairs), and w is a set of similarity values between each protein pair.
Problem definition
Prior to presenting a detailed description of our algorithm, we first introduce the problem definition of the fuzzy rough set theory, which is widely used in the following sections.
Reflexive, if R
f
(x, x) = 1; Symmetric, if R
f
(x, y) = R
f
(y, x); Transitive, if R
f
°R
f
⊆ R
f
(x, y).
Here,
After introducing the basis for fuzzy rough theory, we provide the description of substructure generation (Algorithm 1) [22].
In Algorithm 1, we transform the PPI network into the fuzzy matrix by replacing those entries of 1 with the corresponding similarity value of w, then the fuzzy matrix R = (r
ij
) n×n is transformed to the fuzzy equivalence relation
Here, Sim (p, p′) is calculated by the method proposed in 25] represent the GO similarity value between proteins. By means of λ-cut matrix, we transform the fuzzy equivalence relation t (R) into a Boolean equivalence relation t (R) λ . Different λ correspond to different equivalence class, which is used to divide PPI networks and consequently obtain non-overlapping modules, that is, substructures (line 4). In line 5, we save the substructures and then sort them in a descending manner according to their GO similarity values. The obtained substrucutre set will be considered as candidates and expanded subsequently. Figure 1 illustrates the process of substructure generation.
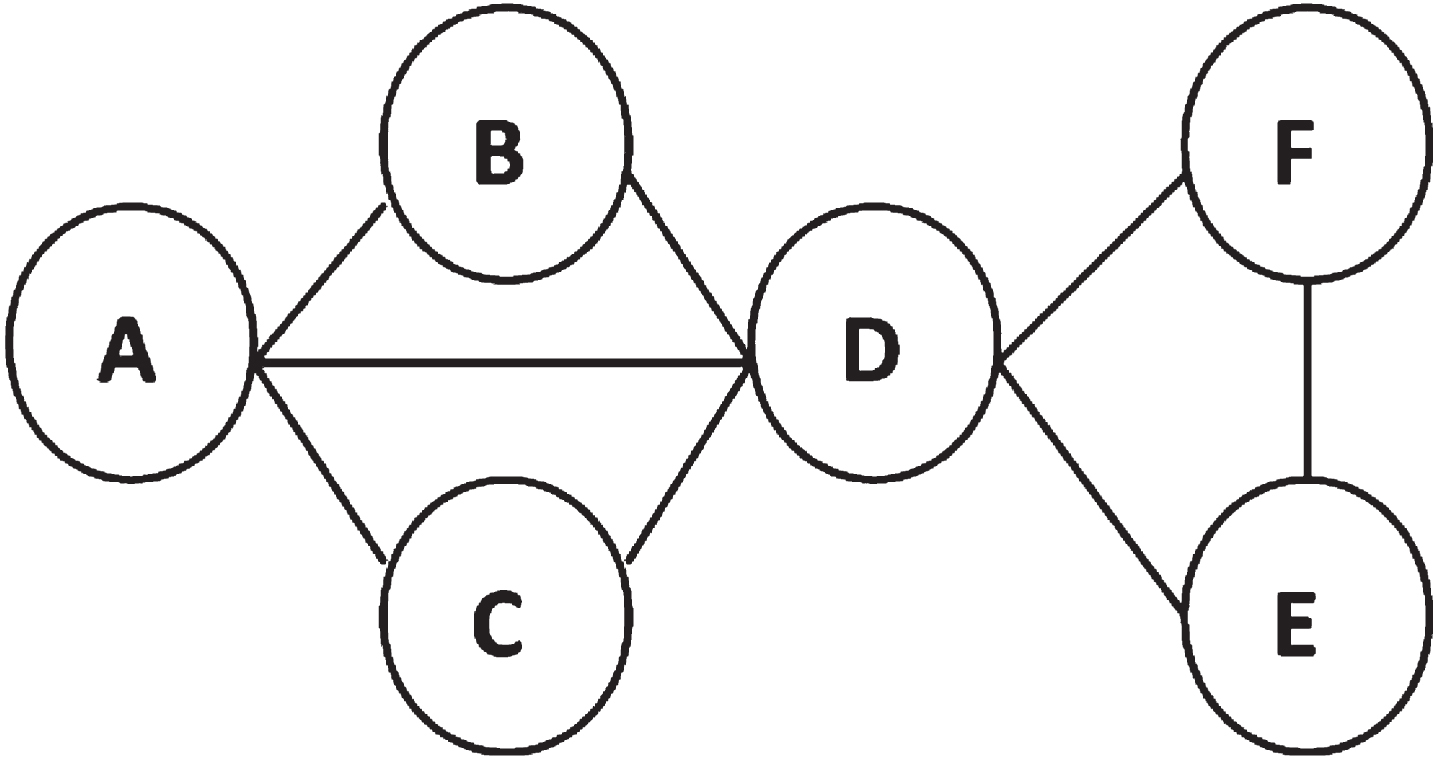
PPI network example illustrating the process of substructure generation.
Notably, t (R) λ=0.5 represents the lower approximation of R for equivalence relation t (R), t (R) λ=1 describes the upper approximation of R for equivalence relation t (R). Obviously, t (R) λ=1 - t (R) λ=0.5 represents the boundary region of R for equivalence relation t (R), which is explained in Step 4.
Similarly, when t (R) λ=0.67, t (R) λ is divided into three equivalence class, [A] R ={ A, B, C, D }, [E] R ={ E }, [F] R ={ F }, which correspond to the different protein sets in the network. The substructures are {A, B, C, D}, {E}, {F}, respectively.
From the above analysis, we can observe that different values correspond to different non-overlapping substructures.
Let Q = Q1, Q2, . . . , Qn denote a substructure set achieved using Algorithm 1 and O = O1, O2, . . . , On denote a clustering center set. The similarity value of each edge is employed to measure the distance between proteins. The following formula is employed to select the center of substructure:
After generating the clustering center of the substructure, each remaining protein out of the substructure is assigned to the clustering center with the highest similarity value, which is named q; and the initial protein clusters are achieved, which are named C1, C2, . . . , C
K
. To improve the result of K-medoids, we introduce a new fitness function [27], which is defined as follows:
Different from [27], the update of clustering center is located in a substructure, a nonrepresentative protein object with the highest similarity value to the clustering center, O
r
andom, which is used to replace the representative object protein, O
i
; afterward, the cluster is re-divided, marked q′, F (q′) is computed. Next, we calculate ΔF = F (q′) - F (q). If ΔF > 0, then O
i
is replaced with O
r
andom, and new clusters are formed. The procedure is iteratively executed until no change in all protein clusters is observed. Algorithm 2 shows the description of the IK-medoids algorithm. The IK-medoids algorithm mainly consists of two parts: first, IK-medoids finds non-overlapping protein complexes with high density from the generated substructure (lines 16). Second, similar to Ref. [12], IK-medoids, which has two sub-steps, determines whether proteins belong to one or multiple protein complexes. In the first step, the similarity value between each protein and candidate complexes is calculated in PPI networks. The formula is constructed as follows:
Similar to Equation (5), Sim (p, C j ) denotes the total similarity value between protein p and its direct neighbor in a substructure, including those out of complex (line 7).
In the second step, the maximum similarity value of Smax (p, C
i
) between each protein and candidate complexes is computed, and then we compute
Finally, IK-medoids merges pairs of complexes with an overlap score OS larger than or equal to a pre-defined threshold [7] and removes complexes whose density is less than 0.01. In our study, the threshold is set as to 0.64, which is the same as previous studies [12]. The merging process terminates when the overlap score between any pair of protein complex does not exceed 0.64. The post-processing is presented in detailed in Algorithm 3.
Datasets
To compare the performance of our method, we apply five clustering algorithms, i.e., ClusterONE [7], CMC [9], MCL [28], OSLOM [29], and RFC [12], that can detect protein complexes in weighted PPI networks on the same test data. Parameters required in each method are set as suggested by their authors. Three weighted PPI networks are used to test the performance of our method, i.e., Krogan [30], Gavin [31], Collins [32]. The detailed information of the four datasets is shown in Table 1.
Summary of the Three Datasets Used in Our Study
Summary of the Three Datasets Used in Our Study
Two gold standard datasets are used to evaluate the quality of identified protein complexes in yeast PPI network, which are MIPS [12, 33] and SGD dataset [12, 34], respectively. Summary of the two gold standard datasets are presented in Table 2. Generally, the datasets act as the role of data sources; the gold standards that usually provide the most reliable evidence for physical interactions are used to validate the performance of the proposed method, which can effectively evaluate match rate between the detected protein complexes and those in the gold standards.
Summary of the Gold Standard Datasets in Our Study
To assess the quality of the detected protein complexes, we match the generated protein complexes with the gold standard datasets. The definitions of these evaluation measures are introduced as follows:
Overlap score. Let p be be an identified complex and g be a complex in the gold standard database. The overlap score OS (p, g) is defined as:
Here, |N p | is the size of the predicted complex, |N g | is the size of the gold standard complex, and |N p ∩ N g | is the common protein number from the predicted and gold standard complexes. If OS (p, g) ≥ θ, we consider p and g to match each other. In our experiment, we set θ = 0.2, which is reported by previous studies [4, 36].
Precision, recall, and F-measure. Let p and g describe the detected protein complex set and the gold standard dataset, respectively, which is quantized as follows [4, 37]:
In Formulas (9) and (10), N cp is the number of detected protein complexes when OS (p, g) ≥ θ, and N cg is the number of protein complexes in the gold standard dataset when OS (p, g) ≥ θ. The F - measure is defined as the harmonic mean of Precision and Recall, which can evaluate the overall performance of the protein complex detection methods.
Sensitivity, PPV, and accuracy. In our study, we use the evaluation metric of accuracy to evaluate the performance of identified protein complexes. This parameter is defined as the geometrical mean of sensitivity (S
n
) and positive predictive value (PPV):
In Algorithm 1, the parameter λ is employed to obtain the non-overlapping substrucutres. To investigate the effect of λ on the performance of IK-medoids, we first study how the algorithm behaves in terms of F - measure and let λ ∈ [0.8, 1) with a 0.02 increment. The detailed experimental results with different λ values are presented in Fig. 2. As shown in Fig. 2(a), the value of F-measure decreases gradually with the increase in λ, which is below the achieved value of λ = 0.8. From Fig. 2(a), we can clearly see that the F-measure achieves the maximum values of 0.476 and 0.475 when MIPS and SGD gold standards are used, respectively. Similarly, in the Gavin dataset, we set λ = 0.8, as shown in Fig. 2(b). In the Collin dataset, the value of F-measure increases gradually with the addition of λ, reaching up to 0.623 and 0.591 when MIPS and SGD gold standards are used when λ = 0.84, respectively, as shown in Fig. 2(c), which is set the optimal value.

Values of F-measure for different values of λ ∈ [0.8, 1) with a 0.02 increment in three datasets using MIPS, SGD, respectively. (a) Krogan (β = 0.94); (b) Gavin (β = 0.84); and (c) Collins (β = 0.8).
In Algorithm 2, we employ the parameter β to to determine the boundaries of the upper and lower approximations, which are employed to judge whether a protein belongs to one or multiple protein complexes. In this work, β ∈ [0.8, 1). Figure 3 shows how the F-measure of our method fluctuates under various values of λ ∈ [0.8, 1) using MIPS and SGD as the gold standard datasets. Figures 3(a) to (c) present the results when different datasets are used. Notably, in Fig. 3(a), for the Krogan dataset, when λ = 0.8, the value of the F-measure increases gradually until β = 0.94 with the increase in β, such that the maximum values of 0.476 and 0.475 are reached when MIPS and SGD gold standards are used, respectively. For the Krogan dataset, we set β = 0.94. In the Gavin dataset, when λ = 0.8, as shown in Fig. 3(b), as the parameter of β radually increases, the F-measure changes slightly until it reaches the minimum values of 0.348 and 0.242when MIPS and SGD gold standards are used, respectively. For the Gavin dataset, we set β = 0.8. Meanwhile, in the Collins dataset, F-measure increases with the addition of and reaches 0.340 and 0.327 using the MIPS and SGD gold standards when λ = 0.84, as shown in Fig. 3(c), which is set the optimal value of β = 0.82. Notably, in this study, the parameter of λ, β is set to [0.8, 1). However, when the value of β is greater than 0.94, IK-medoids has no ideal performance in the Gavin dataset. To unify, the value of λ, β is qualified in [0.8, 0.94].

Values of F-measure for different values of β with a 0.02 increment in three datasets using MIPS, SGD, respectively. (a) Krogan (λ = 0.8); (b) Gavin (λ = 0.8); and (c) Collins (λ = 0.84).
We compare IK-medoids with five state-of-the-art methods: ClusterONE [7], CMC [9], MCL [38], OSLOM [39], and RFC [12]. The results are listed in Tables 3 and 4, and the highest value of each dataset is presented in bold. We present the results of the three datasets by using the MIPS gold standard dataset in detail and the SGD gold standard dataset briefly.
Performance Comparison on the Three Data Sets with Other Methods Using MIPS
Performance Comparison on the Three Data Sets with Other Methods Using MIPS
Performance Comparison on the Three Data Sets with Other Methods Using SGD
In Table 3, The highest value of each data set is in bold. The parameters of IK-medoids are set as follows: λ = 0.8, β = 0.94 in Krogan dataset, λ = 0.8, β = 0.8 in Gavin dataset and λ = 0.84, β = 0.82 in Collins dataset. Other methods are set the optimal parameters recommended by their authors.
Table 3 shows the comparison results of IK-medoids with other methods using the MIPS gold standard dataset. First, we compare IK-medoids with ClusterONE, CMC, MCL, OSLOM, and RFC on the Krogan dataset. As shown in Table 3, IK-medoids outperforms other methods on this dataset. In particular, IK-medoids achieves the maximum values of the metrics evaluated, except for the number and accuracy of the detected protein complex. We also observe that ClusterONE predicts the largest number of protein complexes, which are 522. The proposed method achieves the third maximum number of 191. MCL achieves the highest accuracy values of 0.361 and 0.415 in the Krogan and Collins datasets, respectively.
Second, we compare the six methods using the Gavin dataset. From Table 4, the results obtained from the Gavin dataset are similar to those from the Krogan dataset. IK-medoids detects 654 protein complexes and achieves the highest precision and sensitivity values, which are 0.706 and 0.652, respectively.ClusterONE achieves the highest F-measure of 0.526. RFC detects 153 protein complexes and achieves the highest accuracy of 0.375.
Third, we compare the six methods on Collins data set. Our method identifies 357 protein complexes and achieves the highest sensitivity of 0.610. RFC predicts 108 protein complexes and achieves the highest precision, F-measure, which are 1.000, 0.695, respectively. The precision, F-measure, and accuracy achieved by the proposed method are insignificant. Finally, the results of the six methods on the same PPI network and the SGD gold standard dataset are compared and shown in Table 4. The results using the SGD gold standard dataset are similar to those using MIP. IK-medoids achieves comparable results between the Krogan and Gavin datasets and exhibits a mild performance on the Collins PPI network.
From Tables 3 and 4, our proposed method has superior performance over RFC in most datasets. It elaborates the effectiveness of our method, and further demonstrates that it is inappropriate that those detected non-overlapping substructures are regarded as protein complexes, which discard some real proteins in complexes.
In this paper, we proposed the IK-medoids method, which improves the K-medoids clustering algorithm using rough fuzzy relation and biological meanings hidden in protein pairs. Moreover, a new fitness function was proposed to measure the distance of the two proteins. The experimental results showed that the IK-medoids algorithm produces satisfying performance compared with existing approaches. Using upper and lower approximations, we detected several overlapping protein complexes matched with gold standard datasets, which effectively improved the accuracy of the identification algorithm.
To demonstrate the utility of our method, we compared IK-medoids with ClusterONE, CMC, MCL, OSLOM, and RFC on three yeast PPI networks. The experimental results showed that our method outperforms other five state-of-the-art methods in most datasets in terms of the considered metrics. However, IK-medoids needs to analyze the whole PPI networks for re-dividing clusters, which is not suitable for more complex networks. Therefore, we further will study overlapping protein complexes in highly dense PPI networks with rough fuzzy relation.
Footnotes
Acknowledgments
The authors would like to acknowledge the assistance provided by National Natural Science Foundation of China (Grant nos. 61572180, 61472467, 61471164, 61672011 and 61602164), Hunan Provincial Natural Science Foundation of China (Grant nos. 13JJ2017 and 2016JJ2012) and the Key Project of the Education Department of Hunan Province (Grant no. 17A037).