
Abstract
Seismic vulnerability assessment is a critical topic in disaster management. It is a complex uncertain spatial decision making problem due to lack of complete data, vagueness of experts’ comments in addition to uncertainties in the numerical data/relations. This paper presents a new Geospatial Information System (GIS)-based multi-criterion decision-making (MCDM) method developed for predicting building damages prior to the occurrence of a potential earthquake scenario which considers different sources of uncertainty to make realistic assessments. The developed method suggests an approximate reasoning approach through using Fuzzy Sets theory (FST) and enhanced Dempster-Shafer theory (DST). FST handles the vagueness of the heuristic knowledge on ‘importance weights of the selected criteria’ and ‘the relationship of the criteria with physical seismic vulnerability (PSV)’. The enhanced DST is used for fusion of the information by taking into account the reliability of the adopted criteria. The proposed method’s applicability is tested on existing buildings of a municipality district of Tabriz, a historical and earthquake prone city in Iran. The implementation results confirm that the proposed method is a pragmatic, rational and simple model which reduces uncertainties of PSVA to provide realistic predictions essential for assisting planners and administrators with reducing future earthquake losses in urban areas.
Keywords
Introduction
Earthquake is one of the major natural disasters which causes severe physical, social and financial damages worldwide every year. It is impossible to prevent earthquakes from occurring or control their severity; however, it is possible to mitigate the adverse effects caused by the catastrophe [21]. Seismic risk in urban areas is defined as the convolution of ‘seismic hazard’ and ‘seismic vulnerability’ [34, 53]. Studies on seismic hazard analysis provide a conceptual framework for evaluating the probability of the occurrence of the hazard [11, 50]. This study focuses on seismic vulnerability assessment. The term ‘vulnerability’ is used to indicate the degree of damage that buildings, communities or geographic features are susceptible to. The aim of this research is to propose an efficient and simple model for predicting seismic vulnerability of buildings called physical seismic vulnerability assessment (PSVA). It is very important to propose simple, efficient and easily applicable methods for PSVA as a decision support tool in earthquake prone areas to assist emergency planners and local/central administrators in arranging programs for pre-earthquake mitigation and/ or preparing stages in order to reduce potential future losses. However, it is crucial to subsume the incorporated uncertainties in these assessments to obtain reliable and realistic predictions.
A literature review on seismic vulnerability assessment of buildings, emphasizing on ‘how the incorporated uncertainties are subsumed’ is followed. There are some studies which assess seismic vulnerability of buildings considering the incorporated uncertainties [4, 56]. Although successful in treating some of the incorporated uncertainties using FST and/or DST, these studies are not linked to a GIS to represent the spatial distribution of the expected building damages as vulnerability maps.
Some studies on PSVA used existing numerical seismic relations or vulnerability indices in spatial decision support system (SDSS) frameworks [19, 46] which are suitable for areas with complete databases of required data. But it is neither economical nor applicable to obtain adequate numerical data concerning earthquake events [56]. Thus these approaches will suffer from some unconsidered uncertainties if they are used for the areas with data scarcity which is the case in many cities in the world.
Applying knowledge-based MCDM methods is a suitable solution for areas with data scarcity. There are literally several publications related to PSVA using MCDM [14, 20]. However, uncertainty is inevitable in MCDM and can influence the outputs considerably. It is very important to treat the associated uncertainties in MCDM methods. A few MCDM-based methods concentrated on intrinsic uncertainties [1, 53].
This paper contributes to the literature in proposing a GIS-based data-independent MCDM method which subsumes the associated epistemic uncertainties in assessing seismic vulnerability of buildings. To this end, a new approach using integration of Dempster-Shafer theory (DST) and fuzzy sets theory (FST) is introduced. FST is used to present the qualitative weights of the criteria and the relationship of the criteria with vulnerability classes given by the experts linguistically. DST is applied for fusion of the information on buildings’ vulnerability concerning the adopted criteria. In this research the weakness of DS combination rule in conflict situations is dealt with by taking into account the reliability of the adopted criteria in the fusion process and thus is called enhanced-DS in this paper. The proposed method is successfully implemented in a municipality district of an earthquake prone city in Iran. Also, the capability of the proposed method in predicting realistic PSV is evaluated using some available real earthquake damages data in a region near the study area. Validation of the proposed model using real earthquake data is rarely investigated in previous PSVA studies. In addition to the contributions mentioned above, a specific characteristic of this research is that the proposed method is independent of the study area or selected criteria concerning that it suggests using fuzzy rules for assessing PSV, instead of considering the conditions of each area individually. Damages caused by secondary disasters such as liquefaction, landslides, fire and explosions are excluded in this study.
The studies of [3, 30] are the related studies to this research which modelled PSV of Tehran using DST; however, their method is dependent to the data of the case study area; furthermore, the vagueness of expert opinions was not taken into account. To the best knowledge of the authors, the proposed MCDM-based method using FST and DST for uncertainty reduction of PSVA is not reported in the literature.
Tabriz, one of the metropolitan cities in the northwestern part of Iran, is selected as the study area. The city is a high seismic risk prone area due to its adjacency to the north Tabriz active faults (NTF). NTF caused devastating historical earthquakes in the city in the years 858, 1042, 1721, 1780 and 1965 A. D [36]. A recent time series analysis of RADAR images in the area between 2004 and 2010 supports a probable earthquake of M ∼7 as a result of strain accumulation across the NTFs [47]. A few papers have been published concerning PSVA with particular reference to Tabriz [23, 31]. Concerning the necessity of a reliable seismic vulnerability assessment of the buildings in the city, a municipality district of Tabriz is selected for implementing the PSVA method in this paper.
The remaining parts of the paper are organized as follows. Section 2 describes the proposed method, Section 3 discusses the case study, applied data and procedures and the obtained results. Section 4 describes validation analysis, and Section 5 provides discussion and concluding remarks.
Methods
In this research an approximate reasoning-based approach [8, 27] for PSVA is proposed by integrating FST and enhanced DST to reduce the associated epistemic uncertainties. According to the taxonomy prevalent in risk assessment community [10, 51], two different types of uncertainty are generally identified depending on their nature–namely, ‘aleatory’ and ‘epistemic’ uncertainties. The aleatory uncertainty represents the part of the uncertainty that relates to the random behavior of a system which is not reducible. The epistemic uncertainty is due to the lack of knowledge in a system that can be reduced by collecting additional relevant information [49]. The theoretical backgrounds of this study and the proposed model in this paper are described in the following sections.
Fuzzy set theory
Fuzzy set theory [25] focuses on representing and managing vague information and is used in many complicated problems of the real world [42]. A fuzzy set is essentially a set whose members have degrees of membership between 0 and 1, opposing to a crisp set in which each member must have either the membership degree of 0 or 1. Linguistic variables, which can be treated by fuzzy set theory and fuzzy logic [27], are useful to describe the ill-defined situations that cannot be reasonably described in conventional quantitative expressions [18, 25]. They can be defined by a triplet (a, b, c) called triangular fuzzy numbers (TFN) as shown in Fig. 1.
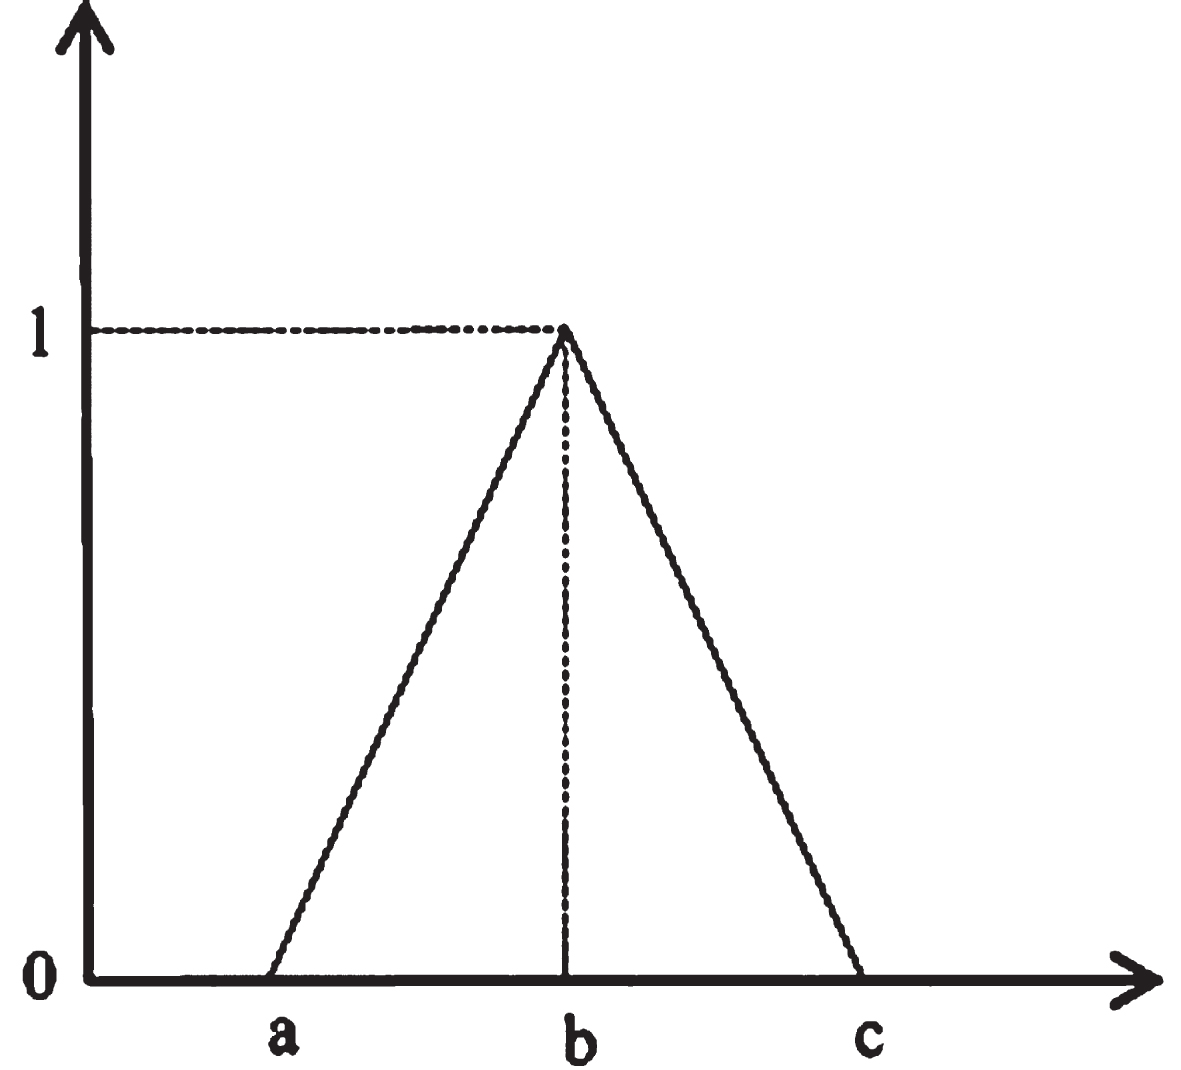
A triangular fuzzy number.
Defuzzification is an important step in fuzzy modeling which involves converting fuzzy values into crisp values. Many defuzzification techniques are introduced [18]. Graded mean integration technique [5] is one of the defuzzification methods Equation (1).
Dempster Shafer theory of evidence (DST) [2, 15] is a theory of uncertainty management. DST can be regarded as a general extension of Bayesian theory that is used for integrating data acquired from independent sources as well as dealing with incomplete data [28]. While in Bayes for two hypotheses h0 and h1 we have p (h0) + p (h1) =1, in the DS theory we have p (h0) + p (h1) + p (h0, h1) =1, where the p (h0, h1) represents uncertainty. In situations where knowledge of experts (or subjective information) is used, the DS belief structures are useful to represent uncertainty [9, 38]. Some of the principle concepts of DST are reviewed below.
Evidence theory first considers the definition of a finite set of hypotheses called the frame of discernment. It is composed of N exhaustive and exclusive hypotheses defined as follows Equation (2):
Forming the frame of discernment, the power set is defined which is composed of 2N sets Equation (3) [15]:
A key point of evidence theory is the basic probability assignment (BPA). For any subset of frame of discernment H = {H1, H2, …, H N }, a BPA could be defined as a function from P (Θ) to [0,1] having the following properties Equation (4) [43]:
Fusion is a solution to obtain more reliable results in case we have uncertain and incomplete data. DST provides a function to combine two BPAs m1 and m2 to yield a new BPA with decreased uncertainty Equation (5) [2].
K in Equation 5 is a normalization constant, k = 0 corresponds to the absence of conflict between m1 and m2, and k = 1 implies complete inconsistency between m1 and m2.
It is possible to use a combination rule to combine J information sources defined as Equation (6) [2]:
It should be noted that when evidences highly conflict with each other, the classical Dempster rule of combination is not efficient [26, 44]. Different methods are proposed to deal with the combination problem when evidences conflict [7, 52]. One of the efficient methods to handle conflict between information sources is the use of discounting rule introduced by Shafer in [15] Equation (7). Discounting coefficient can be seen as reliability coefficient that determines the strength of the reliability of the evidence, unlike Dempster rule of combination that assumes equivalent importance for evidences.
Given the discounting coefficients, the discounted beliefs are incorporated into the Dempster’s rule of combination.
The term ‘pignistic’ was proposed by Smets [37] to fix the meaning of the belief functions used to represent uncertainty denoted by ‘Bet’. Pignistic probability is a crisp estimate in a belief interval and can be determined using Equation (8).
Equation (8) is also called Pignistic Probability Transformation (PPT).
The proposed methodology consists of three main steps (Fig. 2). The first step involves acquiring necessary data. In this step, the most important criteria which are critical for predicting building damages are determined considering literature review and local professionals’ advice. The selected criteria are classified into two main categories, namely the criteria which influence ground motion intensity (i.e. hazard parameters), and the criteria pertinent to structural properties influencing building damages (or structural parameters). Based on the identified criteria, the concerned data are gathered and prepared to be used in a GIS environment. In order to judge on ‘weights of the selected criteria’ and ‘the relationship of the sub-criteria with vulnerability classes’, an expert team is formed.
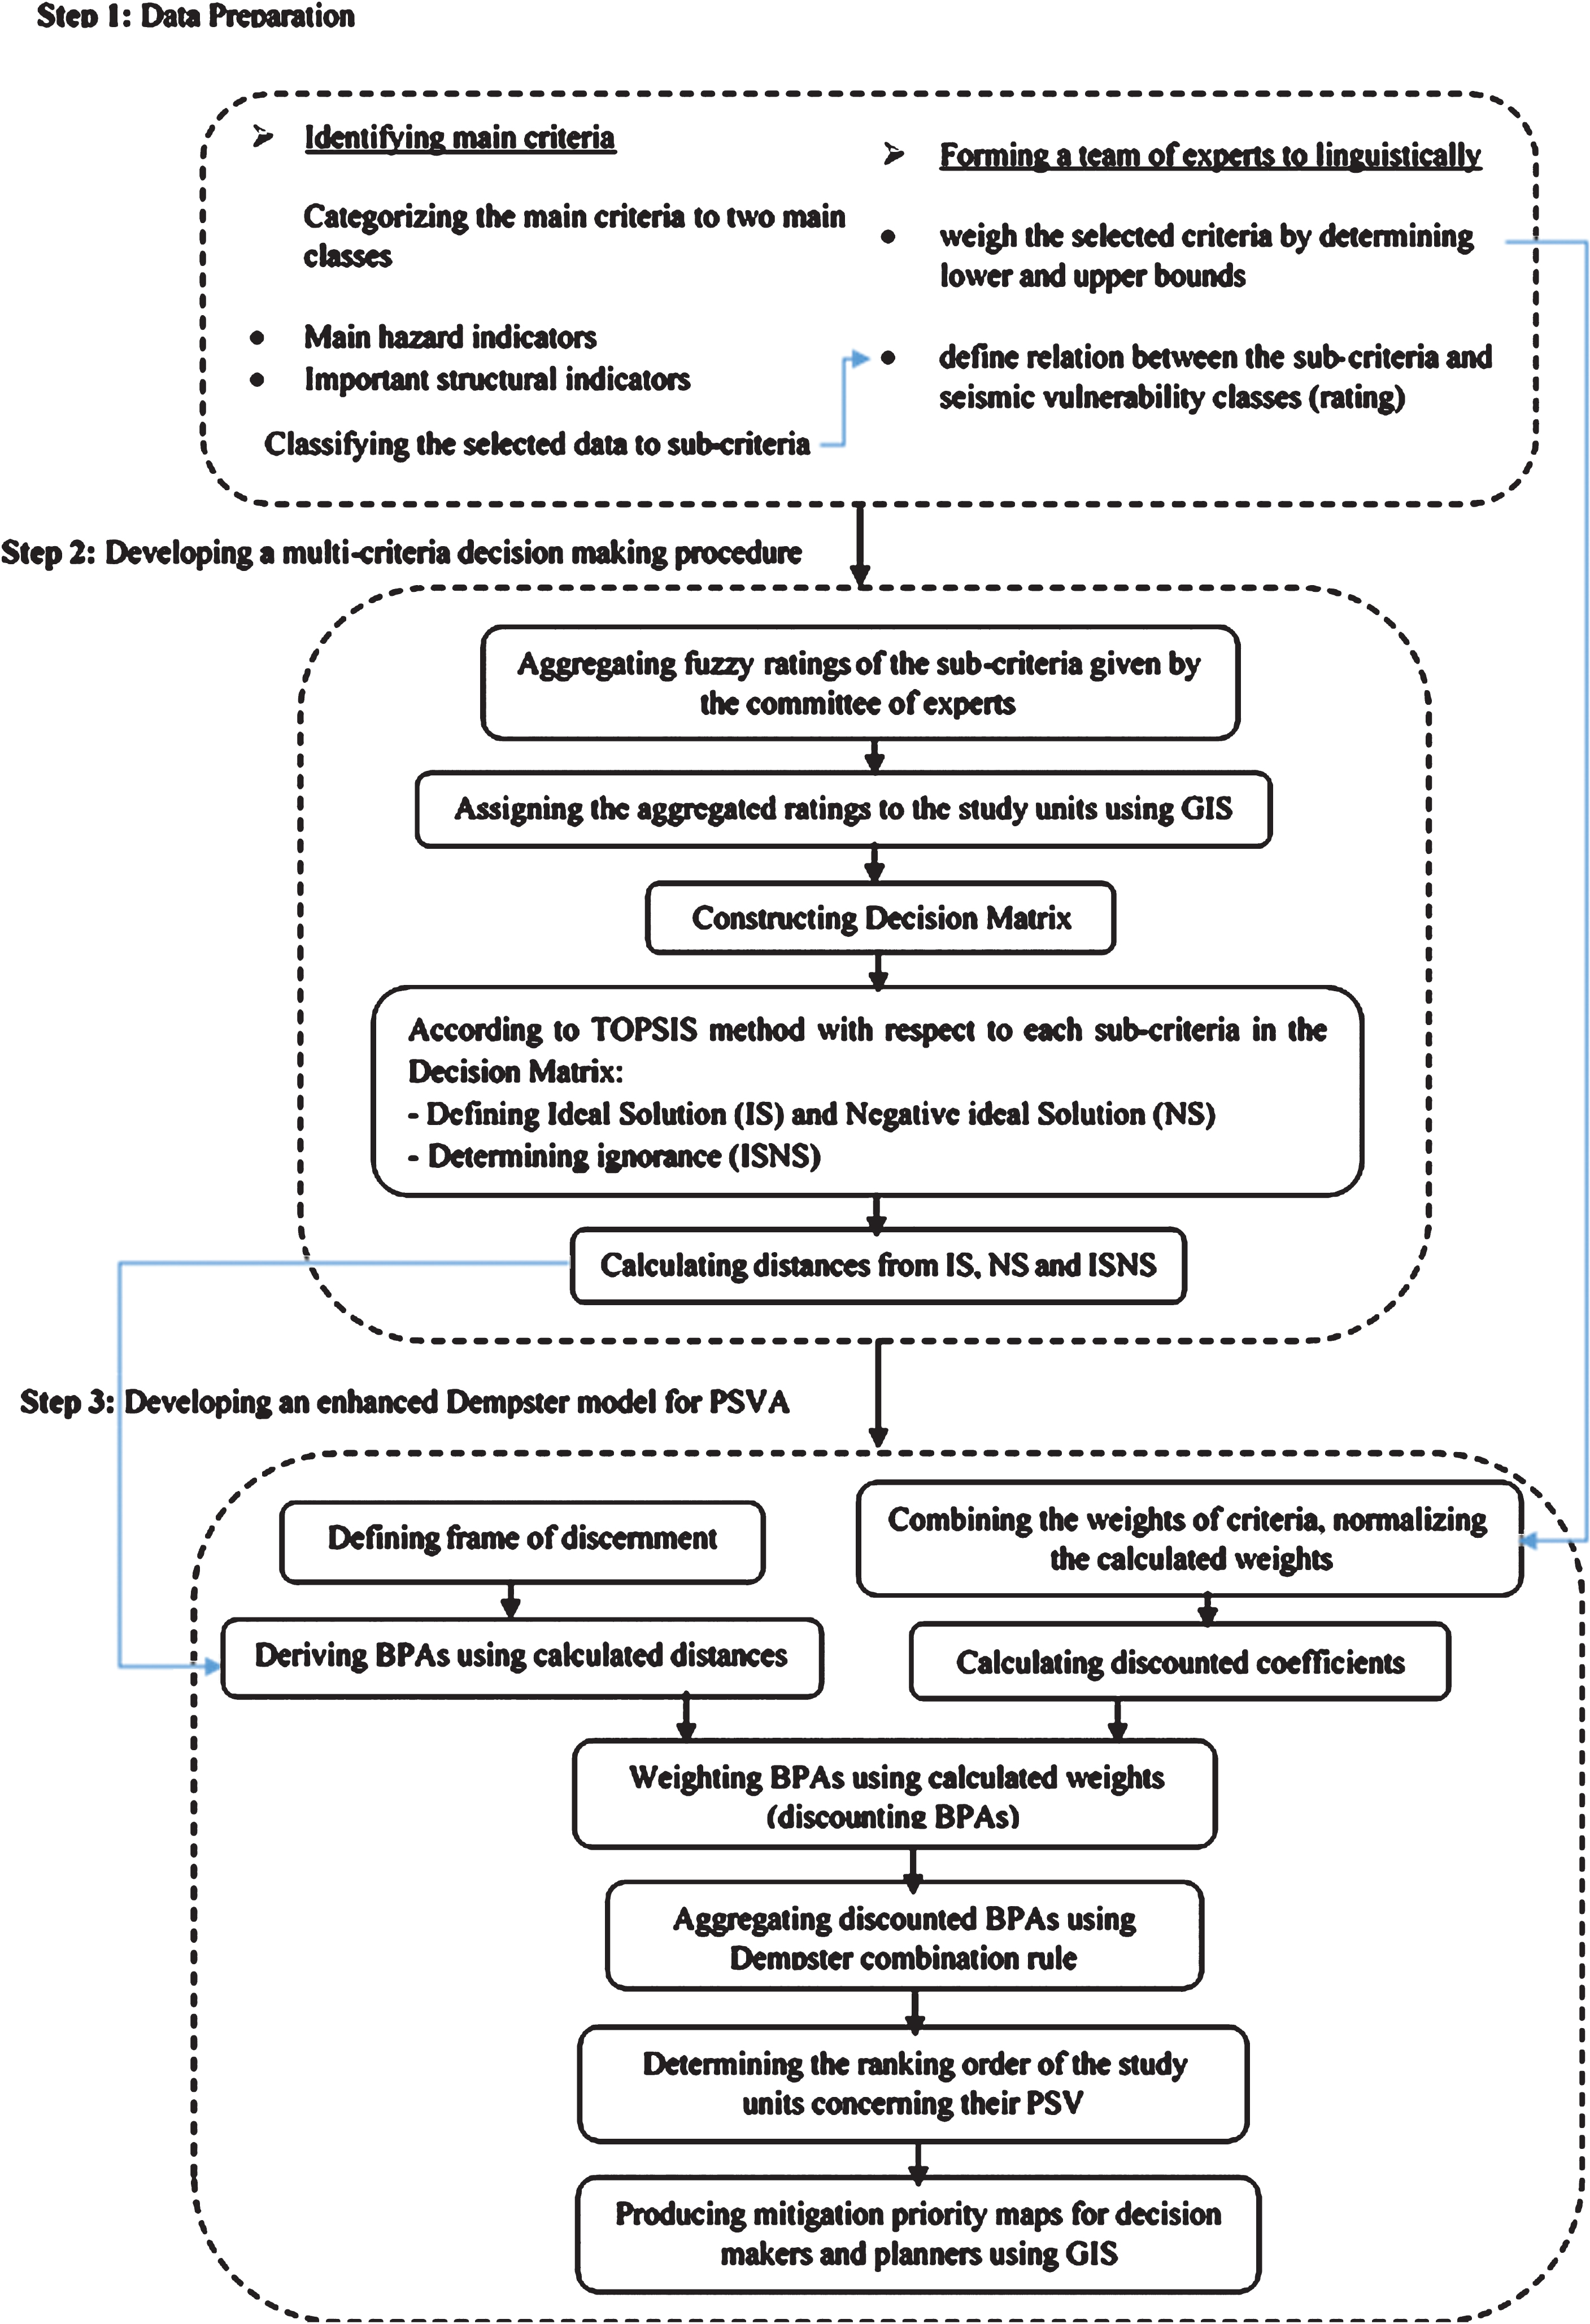
A flowchart of the proposed methodology for developing a knowledge-based PSVA under uncertainty.
In the second step, a multi-criteria decision making procedure for PSVA is developed. FS is used due to the vagueness or imprecision of the influencing criteria weights and the relationships of the criteria with the five vulnerability classes, given by the experts. The framework for the proposed MCDM is based on Technique for Order Preference by Similarity to an Ideal Solution (TOPSIS) [6]. It is a simple, highly trustable method for earthquake vulnerability assessment among MCDM methods [55]. The decision matrix (DM) is constructed and an ideal solution (IS) and a negative ideal solution (NS) are defined for each column of the DM. The related distances are calculated.
The third step is devoted to developing an enhanced DS-based model for PSVA which concerns the basic probability assignments (BPA) derived from the distances calculated in Step 2, as well as the reliability of the contributing criteria as the discounting coefficients of the fusion process. In this research, the studied urban units are classified based on their seismic vulnerability of buildings. The vulnerability maps are produced using a GIS-based approach.
Tabriz, a metropolis in the northwestern part of Iran, (Fig. 3a) has many old historical and culturally significant buildings. There are several densely populated districts and towns built in the hazardous areas adjacent to NTF in Tabriz (Fig. 3b).
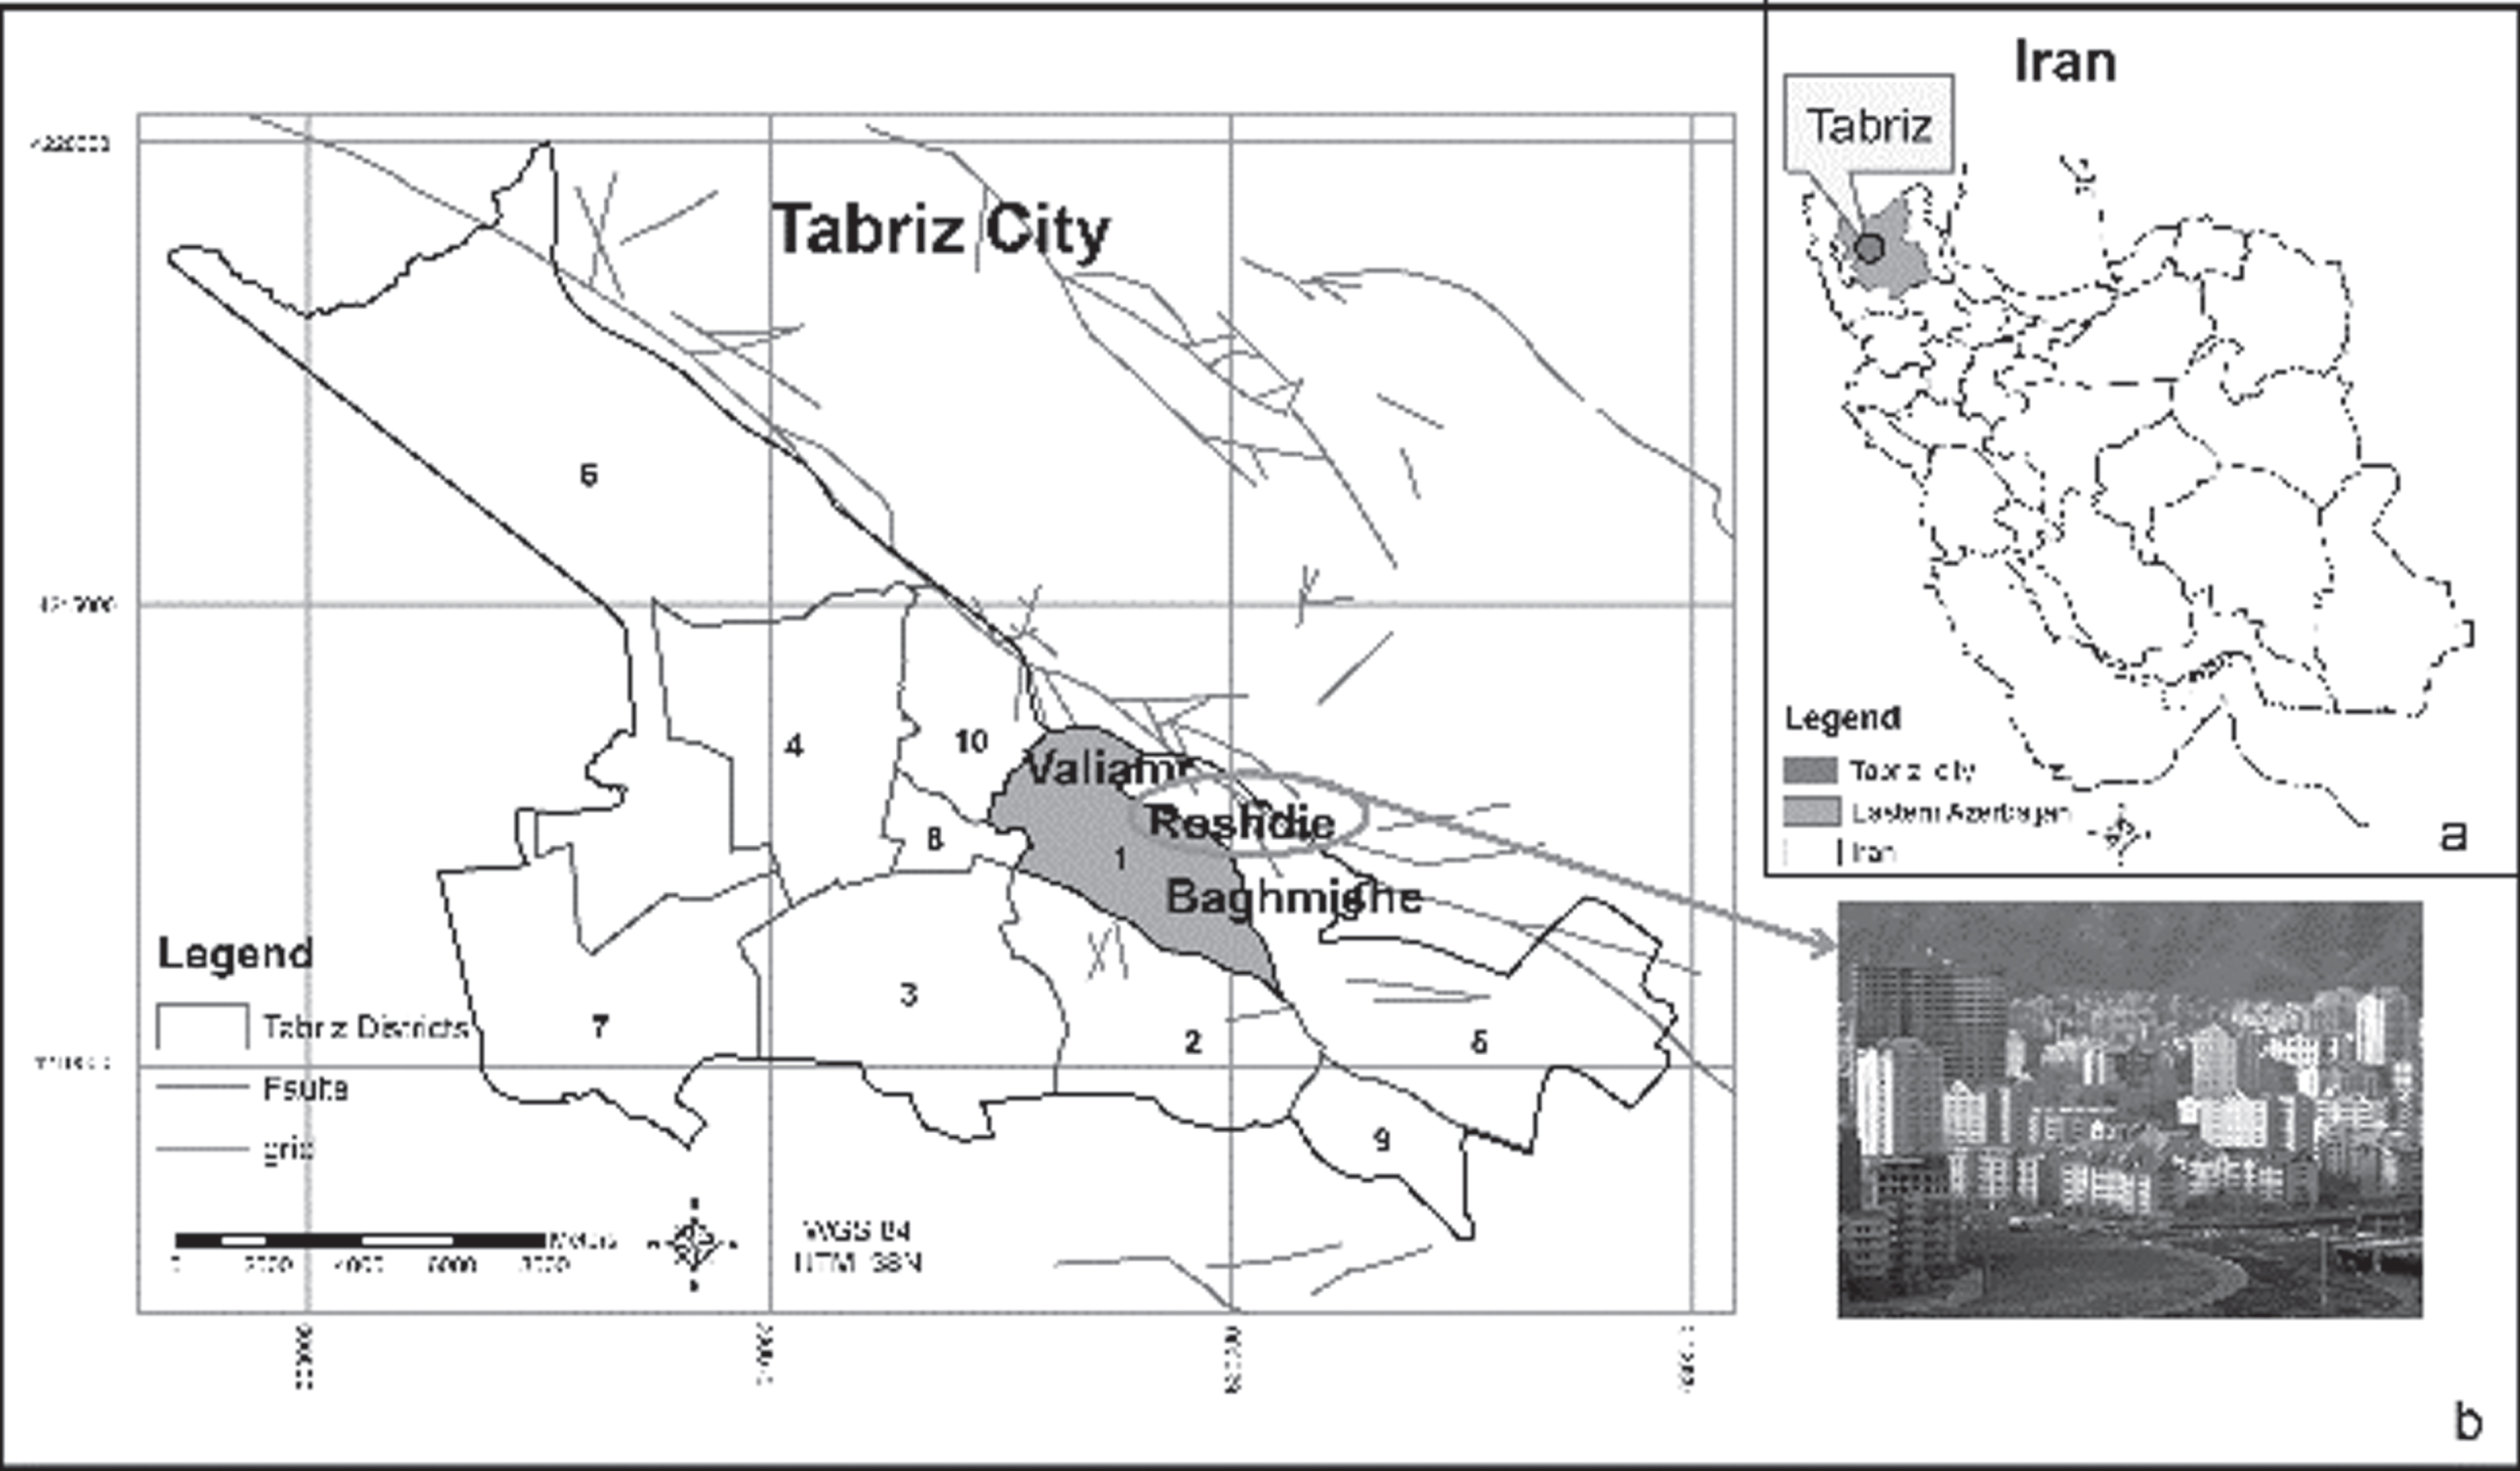
a) Study area. b) Tabriz Municipality Districts and some dense parishes near NTF.
One of the districts adjacent to NTF is District One, which is approximately 1900 hectares, containing over 63,300 dwellings with more than 250,000 inhabitants. District one consists of 156 urban statistical units. The mentioned units are identified by the Statistical Center of Iran (SCI). They are mostly used for decision making purposes by local and governmental planners in urban areas. Statistical units of District One are selected as the study area to illustrate the applicability and suitability of the proposed methodology.
The worst earthquake scenario among Tabriz historical earthquakes with maximum magnitude (Ms∼7.7), which occurred due to the NTF movement, is hypothesized as the earthquake scenario of the present study. The remaining parts of this section describe the implementation of the three steps of the proposed methodology.
There are some limitations in the availability of data for assessing PSV in Tabriz including: a) like many other earthquake prone urban areas around the world, there is a lack of statistical data related to earthquake events, b) there is a lack of proper vulnerability classes predefined for the buildings and/or numerical vulnerability relations regarding the existing buildings in the city. To deal with the incomplete data, it is a reasonable solution to take advantage of experts’ knowledge [22].
In this research, the preferences of a group of experts are used. Seven experts with backgrounds/experiences in ‘engineering seismology’, ‘earthquake engineering’, ‘geology’, ‘geotechnical engineering’, ‘structural engineering’, ‘soil mechanics and foundation engineering’ are selected.
The experts are asked to: a) determine the weights of the selected criteria concerning their importance in PSV, linguistically, and b) express the influence of each criterion on the vulnerability of the buildings, using linguistic variables. Table 1 demonstrates the fuzzy numbers used to represent the linguistic variables in this paper.
Linguistic variables of the criteria weights
Linguistic variables of the criteria weights
Table 2 shows the selected criteria, the relative importance of each criterion and the weights of the sub-criteria aggregated from the experts’ judgments. The data regarding the selected criteria were collected for statistical units in district One of Tabriz municipality.
Used criteria/sub-criteria and their weights
In general, a multi-criteria decision-making (MCDM) problem can be expressed in a matrix format in which the rows are decision alternatives denoted as A = {A1, … A m } and the columns are the criteria with which the alternatives are evaluated, denoted as C = {C1, … Cn} (Fig. 4). The members of Decision Matrix (D) represented as rij are the ratings of each alternative Ai with respect to each corresponding criterion Cj.

A decision matrix format.
In this paper, the alternatives of the decision matrix are the urban statistical units containing 156 rows corresponding to Tabriz District One statistical units and the columns are the adopted 9 main criteria presented in Table 2. To construct the decision matrix (D), the fuzzy influences of the criteria in causing damages given by the experts (Table 2) are assigned to each statistical unit concerning its attributes. Graded mean integration technique [5] is used to defuzzify the ‘D’ members.
Concerning each column in the D, the statistical unit which has the highest mitigation priority (i.e. maximum value of each column) is considered as the negative ideal solution (NS) and the unit with the lowest mitigation priority (i.e. minimum value in the column) is considered as the positive ideal solution (IS). Also, the ‘uncertainty’ represented by ‘ISNS’ is defined using Equation (9)[54].
This study proposes a computational method to subsume and reduce the incorporated uncertainties in PSVA problem through an approximate reasoning approach using DST. Frame of discernment contains two members, namely IS and NS, as described in Section 3.2. Basic probability assignments (BPAs) are defined using Equation (10) [54]. In Equation (10) d (IS), d(NS) and d (ISNS) are representing the distances of the alternatives in ‘D’ to the IS, NS and ISNS.
Dempster combination rule is used to aggregate the BPAs. However, concerning Dempster’s combination rule’s inefficiency for decision making in conflict situations, the reliability of the criteria is concerned by defining the discounting coefficients in this research [15]. The more the discounting coefficient of the criterion is, the more the effect of the criterion in the data fusion process.
The relative weight of each criterion (R . W (c
i
)) is calculated considering the lower and upper bounds of the criteria weights (Wlb (ci) and Wub (ci)) given by the experts Equation (11). Discounting coefficient concerning each criterion is obtained using Equation (12). The r . w (ci) in Equation (12) illustrates the average of all the ‘R . W (ci)’s given by the experts concerning each criterion, shown as ‘relative importance’ in Table 2.
The discounted BPAs for each criterion (ci) are calculated using Equation (13).
Dempster combination rule (see Equations 5 and 6) is used to combine the discounted BPAs for each urban statistical unit, programmed with MATLAB in this study. Three BPAs were obtained for each statistical unit namely; M (NS) demonstrating the belief supporting the hypothesis that the unit has priority in mitigation activities, M (IS) demonstrating the belief supporting the hypothesis that the unit does not have priority in mitigation activities and M (ISNS) which illustrates the uncertainty, i.e. the belief supporting the hypothesis that there is no knowledge if the unit has priority in mitigation activities. The sum of M (IS), M (NS) and M (ISNS) must equal to ’1’ concerning each urban statistical unit, as described in [2, 15].
In order to determine the ranking order of the study units concerning their priority in mitigation activities pignistic probability transformation (PPT) is calculated using the obtained beliefs [37]. Bet (NS) illustrates the statistical units’ priorities for mitigation activities Equation (14) representing a value between 0 and 1 for each statistical unit.
The physical vulnerability classes of the studied units based on the calculated Bet (NS)s are illustrated in Table 3.
The vulnerability classes based on Bet (NS)
Keeping in mind from Section 3.2 that NS was the unit with the highest mitigation priority (or with maximum PSV) and IS was the unit with the lowest mitigation priority (or with minimum PSV), M (NS) map demonstrates a map that ranks the studied units based on ‘priority in mitigation activities’. M (IS) map ranks the studied units based on ‘not having priority in mitigation activities’. The produced belief maps are represented in Figs. 5, 6. M (ISNS) map illustrating the ‘uncertainty’ map is represented in Fig. 7.
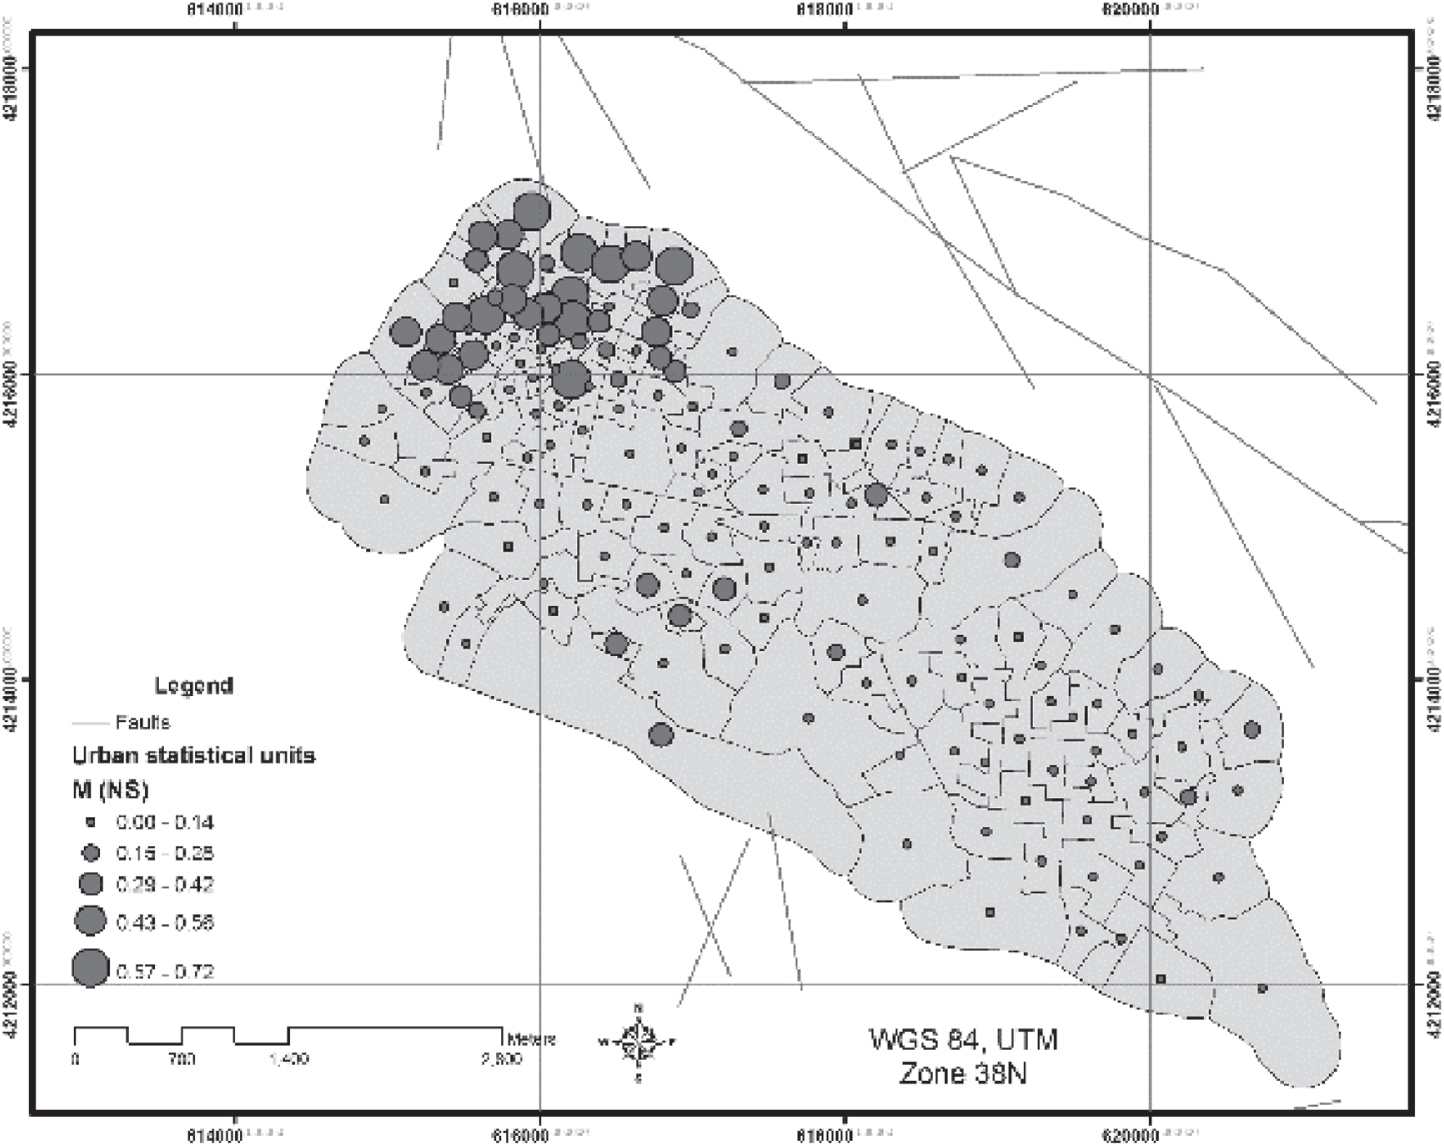
Map of mitigation priorities: M (NS) map.

Map of mitigation non-priorities: M (IS) map.
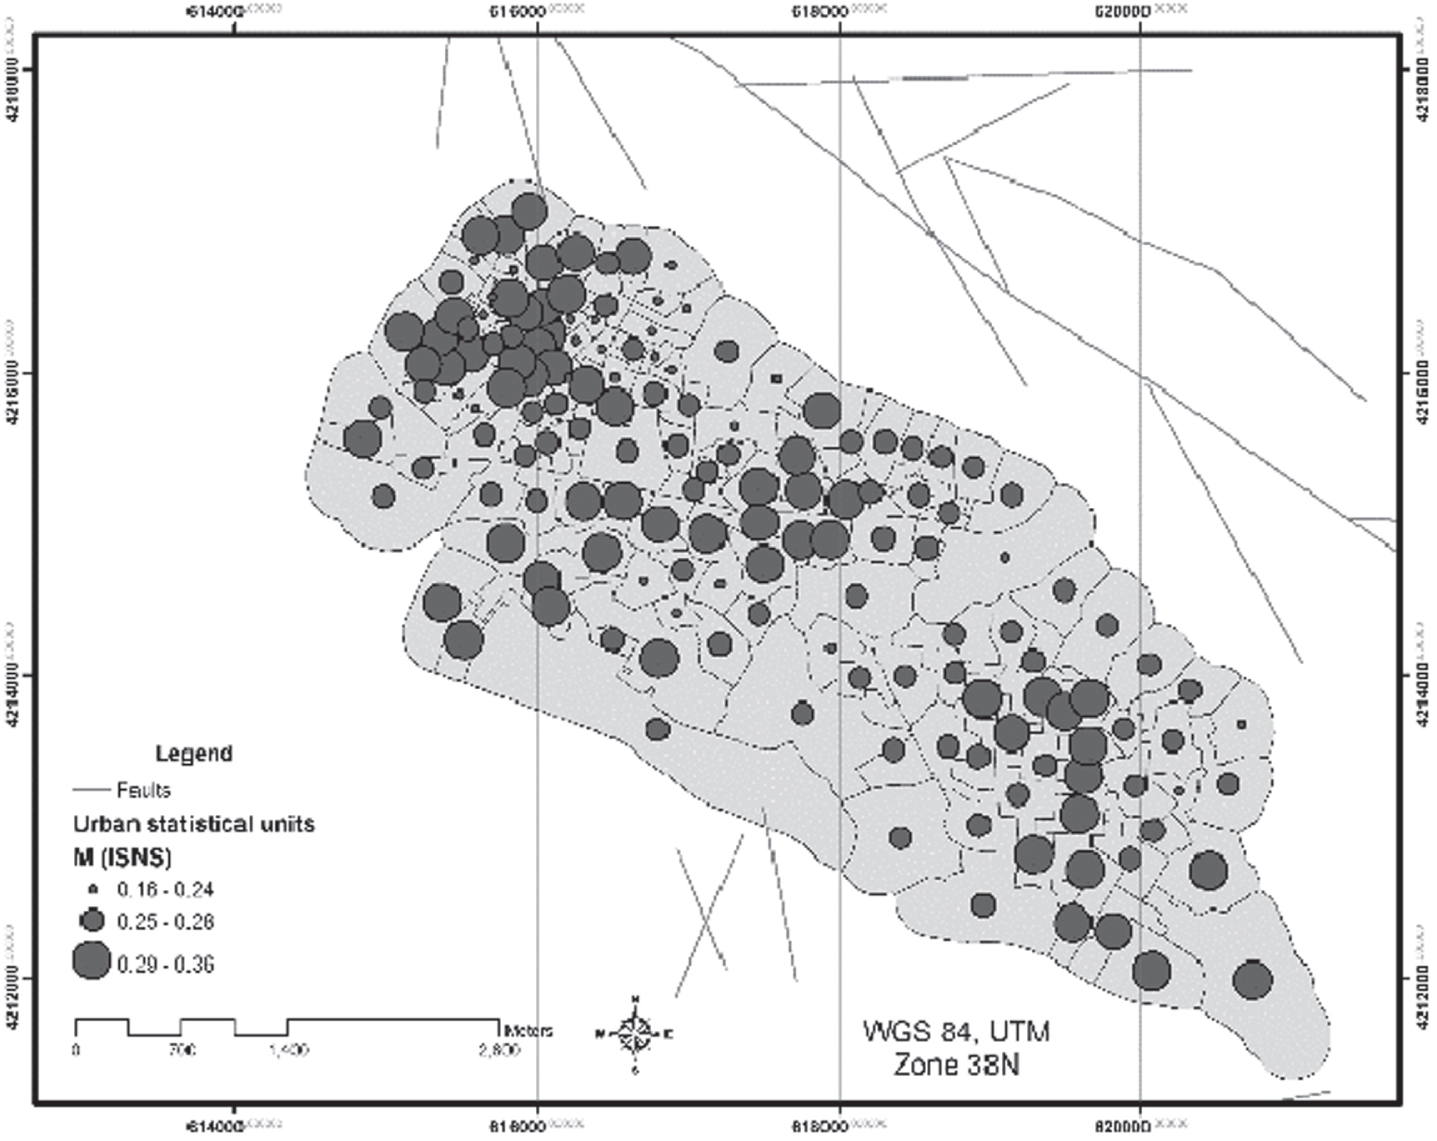
Map of uncertainty about mitigation priorities (M (ISNS)).
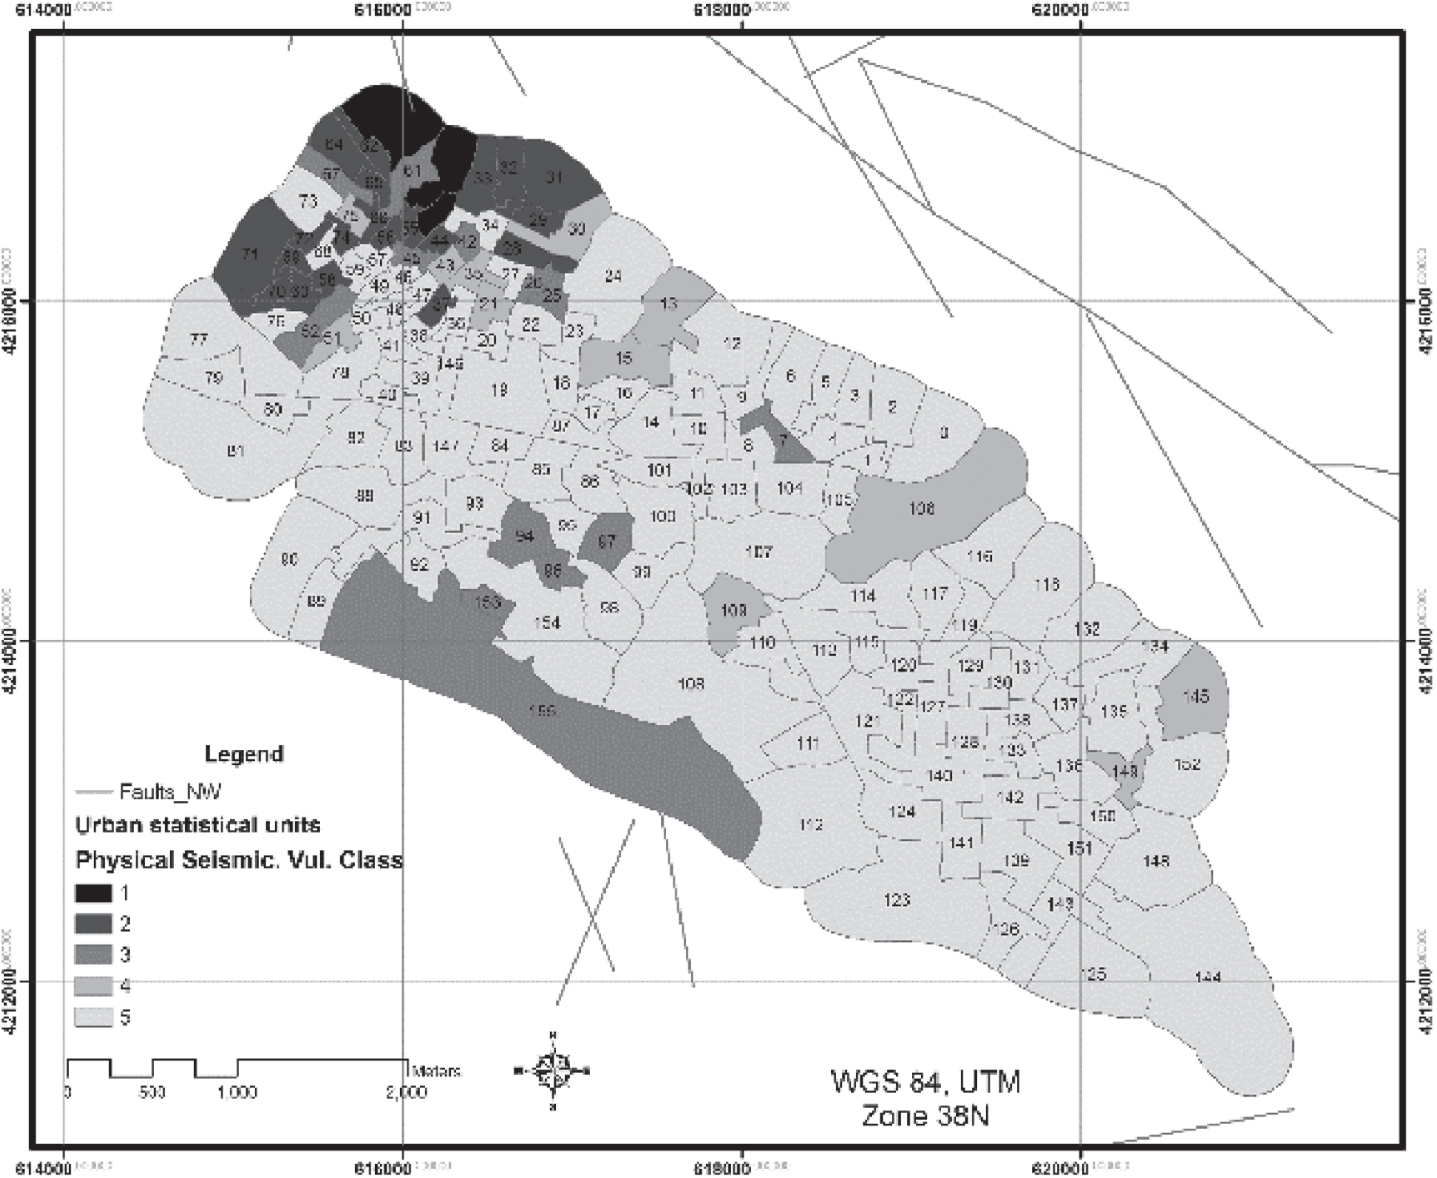
Finally, the statistical units are categorized into five vulnerability classes based on the calculated Bet (NS) (see Table 3). As shown in Table 3, the units which are categorized in ‘vulnerability class 1’ have the highest priority in mitigation activities due to the very high destruction of buildings predicted and so on. According to the proposed model, the north-west parts of District One are expected to have the highest PSV (see Fig. 8).
Unit IDs vs. the ranking order of the units based on predicted physical vulnerability.
Table 4 illustrates a summary of the predicted PSV of the statistical urban units in the study area.
Statistics of the PSVA in the study area
In this study to evaluate the proposed model’s accuracy in estimating PSV, since there were no available data on seismic damages of Tabriz, real earthquake data of some villages in Eastern Azerbaijan province (Iran) were considered as the reference data (see Fig. 9). The villages are near Tabriz at a distance of about 70 Km from the city in the north east part of Tabriz, hit by two earthquakes in Aug. 11th, 2012 caused by the movement of Ahar faults. The seismic intensity of these villages provided by GSI was the only available earthquake data near the study area (Fig. 9).
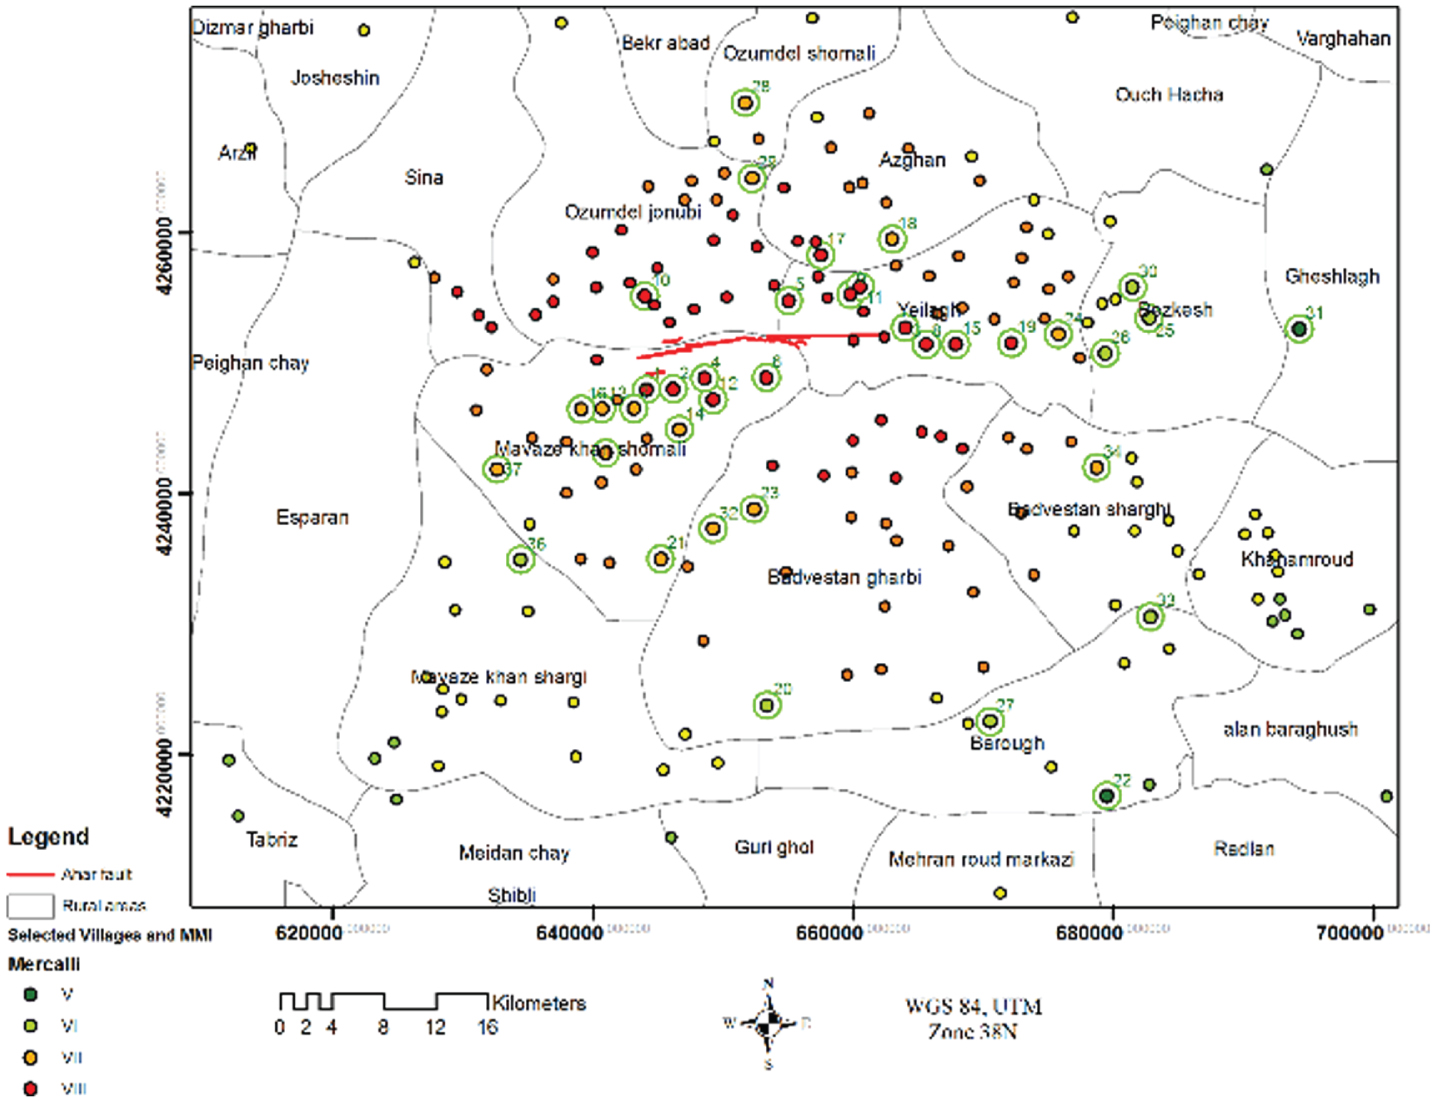
The selected villages of Ahar, Varzeghan for validation.
In this research, 37 villages with available required input data (see Table 2) were selected for examining the accuracy of the model outputs as represented in Fig. 9. 28 villages from the total amount of the selected villages had experienced seismic intensity VII or VIII in the scale of Modified Mercalli Intensity (MMI) which were the maximum earthquake intensity occurred in the area. The other 9 villages had experienced seismic intensity of MMI = V or VI.
The following steps were taken to evaluate the accuracy of the model; 1) the input data on the area required for the model were collected from local and national organizations. 2) Taking into account the spatial attributes of the selected villages obtained using GIS tools, the fuzzy rules about the relation between the criteria of the model (attributes of the selected villages) and seismic vulnerability classes were assigned. The decision matrix was formed. 3) The obtained BPAs for the villages concerning each criterion were aggregated using enhanced DS combination rule as described in the third step of the proposed method. Finally, PSV classes of the studied villages were acquired.
Four vulnerability classes (Class 1 through Class 4) were obtained for the studied villages based on the obtained Bet (NS)s. Concerning that there was a limited number of villages with available required input data and the rough information on the building damages caused by the earthquake available in Modified Mercalli Intensity scale, it was not achievable to use precise measures for validation. In this study, to estimate the accuracy of the model, the predicted vulnerability classes of the villages were compared to the associated seismic intensities.
As shown in Fig. 10, the comparison of the proposed model’s outputs with real seismic intensities indicates that: A) No villages were classified in vulnerability Class 5 by the model which represents areas with very low or no damages. This prediction is correct since concerning the reference data there were no villages without building destructions among the selected villages. B) The majority of the villages which were ranked as Class 1 and Class 2 by the proposed model were the villages which experienced seismic intensity VIII and/or VII, (56% of the villages in these two classes were the villages whichexperienced MMI = 8 and 31% were the villages which experienced MMI = 7). And none of the villages with seismic intensity MMI = V were assigned to Class 1 or Class 2 (see Fig. 10). This is an effective estimation concerning that the foreseen vulnerability Class 1 and Class 2 represent the areas with complete and/or extensive destructions which sufficiently match to intensities VIII and VII. C) Concerning the predicted vulnerability Class 3 and Class 4, as represented in Fig. 10 the percentage of villages with MMI = VIII decreased to 24% from 56% and the percentage of villages with MMI = VII, VI, V increased to 43%, 24% and 9% from 31%, 12% and 0% respectively. It was practical concerning that the vulnerability classes 3 and 4 intend to represent moderate/slight damages rather than complete/extensive destructions which are better-matched to intensities VI and V. Therefore, the validation results indicate that the proposed method can successfully produce realistic outputs concerning PSV, especially for higher vulnerability classes that are more crucial for mitigation/preparedness activities.

The accuracy of the proposed method through validation.
It is important to assess the damages caused by an earthquake scenario in advance for mitigating the catastrophic consequences of the hazard. But it is a complex problem since there are different sources of uncertainty due to vague non-numerical (linguistic) data in addition to uncertainties in the available numerical relations. However, it is necessary to develop pragmatic, simple and efficient methods for PSVA, especially in high seismic risk areas that lack essential earthquake damage observations or vulnerability indices of buildings. Against related works this study emphasizes on analyzing the uncertainties associated with PSVA and proposes a new simple decision making method independent from study area to estimate realistic seismic damages to the buildings. The proposed method reduces the incorporated epistemic uncertainties using integration of fuzzy TOPSIS and enhanced DST rationally. The proposed method also uses GIS to provide vulnerability maps that are effective tools for representing the severity and spatial distribution of the expected damages for decision makers and managers. The proposed method can assist local/central planners and administrators in pre-earthquake mitigation/preparedness programs in earthquake prone areas.
The applicability of the proposed model was tested in a municipality district of Tabriz. It is observed that the existing buildings of 156 urban statistical units in Tabriz District One are categorized into ‘very low’, ‘low’, ‘moderate’, ‘high’, and ‘very high’ vulnerability classes with 69%, 8%, 8%, 13%, and 2%, respectively, against the most probable devastating earthquake scenario. The accuracy of the outputs of the model was examined, concerning some real data of the earthquake’s destructions available for some villages near the case study area. The validation results confirmed the acceptability of the outputs of the model beside the applicability of the proposed model for areas other than the case study. In future studies, more precise statistical tests can be applied in the validation stage depending on the available reference data.
Future applications of this study may include social or economic seismic vulnerability assessments to predict human and property losses based on physical damage predictions. The proposed model is also applicable for assessing vulnerabilities caused by landslides.
The present model can be applied in higher spatial resolutions than the considered urban statistical units, such as urban parcels in future studies. In this research, only a number of important effective criteria were considered, future applications might expand the criteria used as seismic vulnerability indicators. It was assumed that the experts involved have the same expertise levels in this study, the relative weights of the experts can be taken into account in future studies. Developing a GIS-based software for modeling physical vulnerability and producing vulnerability maps can be the next step for future works. The use of possibility theory to deal with the uncertainties associated within a scenario-based earthquake risk assessments can also be an interesting expansion of this study.
Footnotes
Acknowledgments
The authors express sincere appreciation to the local/national organizations for providing the required data for this research. Additionally, the authors express their gratitude to Dr. Masoud Hajialilue Bonab from Tabriz University for his valuable comments on the questionnaire prepared for gathering the experts’ opinions in this research. The research is financially supported by Vice-President for Research, University of Tehran, Grant No. 8103002/6/43, which is highly appreciated.