
Abstract
Recent studies have shown sparse representation learning is a potentially promising method in pattern classification, but very few focused on class imbalanced problems involved in its applications and practice. This problem is particularly important, since it causes suboptimal classification performances, especially when the cost of misclassifying a minority-class example is substantial. Unlike the prior test sample sparse representation on balanced data sets, which cannot reflect the data distribution in real applications, we proposed a novel sparse representation learning algorithm called Balanced Sparse Representation Classifier (BSRC), considering the contribution from heavily under-represented of minority classes. Our solution first estimates the contribution of training sample in each class, and then identifies the nearest neighbors with the largest contributions. After that, the test data is expressed based on linear combination of all the nearest samples. Finally, the decision has been made according to sum of contribution for each class. Moreover, we also present the kernel extension of the proposed classifier to deal with complex data. Experimental results also show that with the proposed learning approach, it is possible to design better method to tackle the class imbalance problem in sparse representation learning.
Introduction
The class imbalance problem [1] has been an active area of research over the past several years, because it is common in machine learning tasks such as medical diagnosis [2] text classification [3] face recognition [4]. The traditional classification is difficult to handle the real-world data sets with imbalanced class, in which the training set of the majority class far surpassed the training set of the other minority class. Since the minority is heavily under-represented in comparison to the majority ones, the classifier tends to misclassify the minority as the majority to obtain higher accuracy. It has been an increasingly important issue as many problems in machine learning and pattern recognition involve building adaptive classifier on different data distributions. Existing approaches to solving the class imbalance problem mainly include data level methods and algorithmic level methods. We focus on binary classification only and study the improved sparse representation methods at the algorithmic level.
Here, we investigate the test sample sparse representation method addressing the class imbalance problem, which is common in real applications. This problem is particularly important, since it causes suboptimal classification performances, especially when the cost of misclassifying a minority-class example is substantial. In this letter, a new balanced classifier based on test sample sparse representation, called Balanced Sparse Representation Classifier (BSRC), is proposed to build classifier with applicability and flexibility as follows.
Different from the previous method, BSRC represents test sample based on subset of training data for each class, which is less susceptible to under-representation due to the small sample size. Combing merit of the kernel method and sparse representation in the new algorithm, the proposed method also inherits all the advantages of kernel technology. This improvement suits real-world data, no matter whether the data set is balanced or not.
After the related work section, the BSRC and the kernelized extension are described in detail.
Related work
In this section, we briefly introduce some related works, including solutions to class imbalance problem and sparse representation Learning.
Learning on class imbalance dataset
The main solutions to class imbalance problem include data level, algorithm level, integration, and ensemble learning methods.
Data level. The main idea at the data level is to change the distribution of the original data sets by increasing the number of class samples or reducing the majority of class samples. According to the different balance strategies, they are divided into over sampling method and under sampling method. Over sampling method is to increase the minority class samples, including the sample generation technique [5], security samples generation technique [6], samples near the border generation technique [7], adaptive synthetic samples generation technique [8], hierarchical clustering samples generation technique [9] and so on. The under sampling method is to abandon part of majority class samples including random under sampling [10], under sampling based on genetic algorithm [11], dynamic under sampling [12] and so on.
Algorithm level. The main idea of the algorithm level method is to reduce the loss of information of minority classes through modifying the existing classifier. And then the classifier with the adjust classification boundary is constructed to reduce the bias to majority classes. Many studies have improved the traditional classification algorithms, such as decision tree based on class confidence proportion [13], kNN algorithm based on class confidence [14], SVM algorithm based on swarm optimization [15] and so on. In addition, there are some cost sensitive methods, which consider the sample misclassification cost. These methods can assign different costs ratios for misclassified cases, i.e. more expensive to misclassify an actual minority class sample into majority class, such as cost sensitive SVM [16], cost sensitive KNN algorithm [17], cost sensitive contrast pattern-based classifiers [18]. But the biggest obstacle of these methods is that many data sets do not give cost sensitive matrices [19].
Integration method. These methods combine the advantages of data level and algorithmic level methods on the basis of reducing the shortcomings [20]. The most popular approach is combining data level solution with ensemble classifier to yield efficient learning methods [21]. In addition, a lot of research has been devoted to the combination of sampling methods and cost sensitive methods [22]. At the same time, the integration method also brings together the shortcomings of the combined methods, so that the analysis of the relationship between the combined methods is needed.
Ensemble method. At present, the combination of sampling ideas and ensemble learning methods is widely used in dealing with class imbalance problem, including SMOTEBoost combining the over sampling with the Boosting method [23] and RUSBoost integrating the under sampling with the Boosting method [24]. The subsequent EasyEnsemble combines Bagging, random undersampling, and AdaBoost [25]. Recently, a new ensemble method transforms the imbalanced problem into multiple equilibrium problems, without changing the original data distribution [26]. However, such algorithms may suffer from overfitting problems and data loss problems.
Most recently, Ofek etc. [27] proposed a fast clustering-based under sampling method named Fast-CBUS for binary-class imbalance problems. Kuo etc. [28] proposed a new preprocess method based on particle swarm K-means optimization to deal with the class imbalance problem in prostate cancer prognosis. Roy etc. [29] combined dynamic selection and data preprocessing for choosing the best ensemble given a test instance.
Sparse Representation Learning
The sparse representation method is currently an active research subject and increasingly attracting attention in pattern classification [30–32]. This method selects out of all the training data a few that most compactly represent the test data and hence naturally avoids the problem with under-fitting or over-fitting [30][33]. However, when the data sets are the combination of imbalanced data and small sample size, the lack of representative data presents a new challenge to the community [1].
The model of sparse representation is simple and easy to understand and operate, through extracting all information of each class. And then it obtains a correlation coefficient for classification. The more information the sparse representation can obtain from the original data sets, the more effective for classification. But the effectiveness is founded on the rich information of each class. The data sets are class imbalanced in most cases, result in limited information can be exploited from the minority class [1]. It is concerned with the performance of learning algorithms in the presence of under represented data and severe class distribution skews.
Motivated by idea of the algorithm level, we try to combat the class imbalance problem in the widely used sparse representation method, via exploiting the information from each class to fully represent the test data.
Combating the Class Imbalance Problem in Sparse Representation Learning
Theoretic Foundation for Sparse Representation
In sparse representation method, test sample y can be represented in terms of all of the training samples as [30]:
Massive algorithms based on the sparse representation theory have been proposed to effectively tackle real world learning tasks [32], on the basis of assumption of sparse representation classification (SRC) method that the test sample can be sufficiently represented by samples from the training data. Recently, Xu et al. [34] proposed the Two-Phase Test Sample Sparse Representation (TPTSSR) method for face recognition. Their experimental results show this method can improve the classification accuracy on balanced data sets. However, they only exploited global information and tended to lose local information. Most recently, Liu et al. [35] proved that the local information is effective for classification, and proposed weighting method named WTPTSSR to extend the two phase method. However, the test data representation is suffered from the heavily under-represented of minority classes, without considering the the class imbalance problem in the first representation step.
These improvements are all proposed on some evenly-distributed data set. However, labeled data in the real world applications are class imbalanced in many cases, these strategies cannot be applied directly. In order to combat the class imbalance problem in sparse presentation, we developed Balanced Sparse Representation Classifier (BSRC) and proposed a kernel version BKSRC.
When applying sparse representation, the number of samples that represent the different classes is imbalanced. This problem is particularly important, since this imbalance causes suboptimal classification performance, especially when the cost of misclassifying a minority-class example is substantial. Motivated by this consideration, the test samples are represented for each class in BSRC. Let
We can compute the contribution of j-th training sample in i-th class as
For each class, we identify the K nearest neighbors, which have the K greatest contributions, denoted by
The second phase of BSRC is similar to that of the TPTSR. We combine all the neighbors from each class, i.e.
Balanced Sparse Representation Classifier
Kernel method provides nonlinear model analysis to increase the computational power of linear classifier. Transforming the original feature space into the kernel space, the test data y can be expressed using transformed training data φ (x). In the transformed feature space, the testing data φ (y) can be expressed as:
Like BSRC, we also compute the deviation of the test data y between the contribution of this data,
We select K-nearest neighbors corresponding to the K smallest values of
Balanced Kernel Sparse Representation Classifier
[1]Kernel function (φ (x)) is introduced to reduce computation, for mapping the data nonlinearly into a feature space.
In this section we evaluate BSRC and BKSRC algorithm empirically. Firstly, we conduct experiment on visual data sets and non-visual data sets with different imbalance rate. And then, we also investigate the performance of both method on large data sets. As we will show later, BSRC and BKSRC improves the performance over the state-of-the-art methods on class imbalance data sets.
Experiment on Visual Data Sets
The experimental data sets are three baseline face data sets: YaleB [39], PIE [40], and AR [41].
The Yale Face Database B Contains 5760 single light source images derived from 10 subjects of each under 576 viewing conditions. Every subject has been captured in a particular pose with ambient illumination. The PIE face database of CMU contains 41,368 images derived from 68 distinct subjects of each under 13 different poses, 43 different illumination conditions, and with 4 different expressions. The AR face database includes 126 distinct subjects of each providing 26 color images, with different facial expressions, illumination conditions, and occlusions.
Note that, target subject is used as minority class, and all other subjects are used as majority class. For example, 567 samples of one person in YaleB data are used as the samples of minority class, and the left (5760-567=5193) samples of 9 persons are used as the samples of majority class. And the target class is random select. Note that, without loss of generality, 10 × 3-fold cross validations have been conducted. The value of K is determined by the cross-validation method [37].
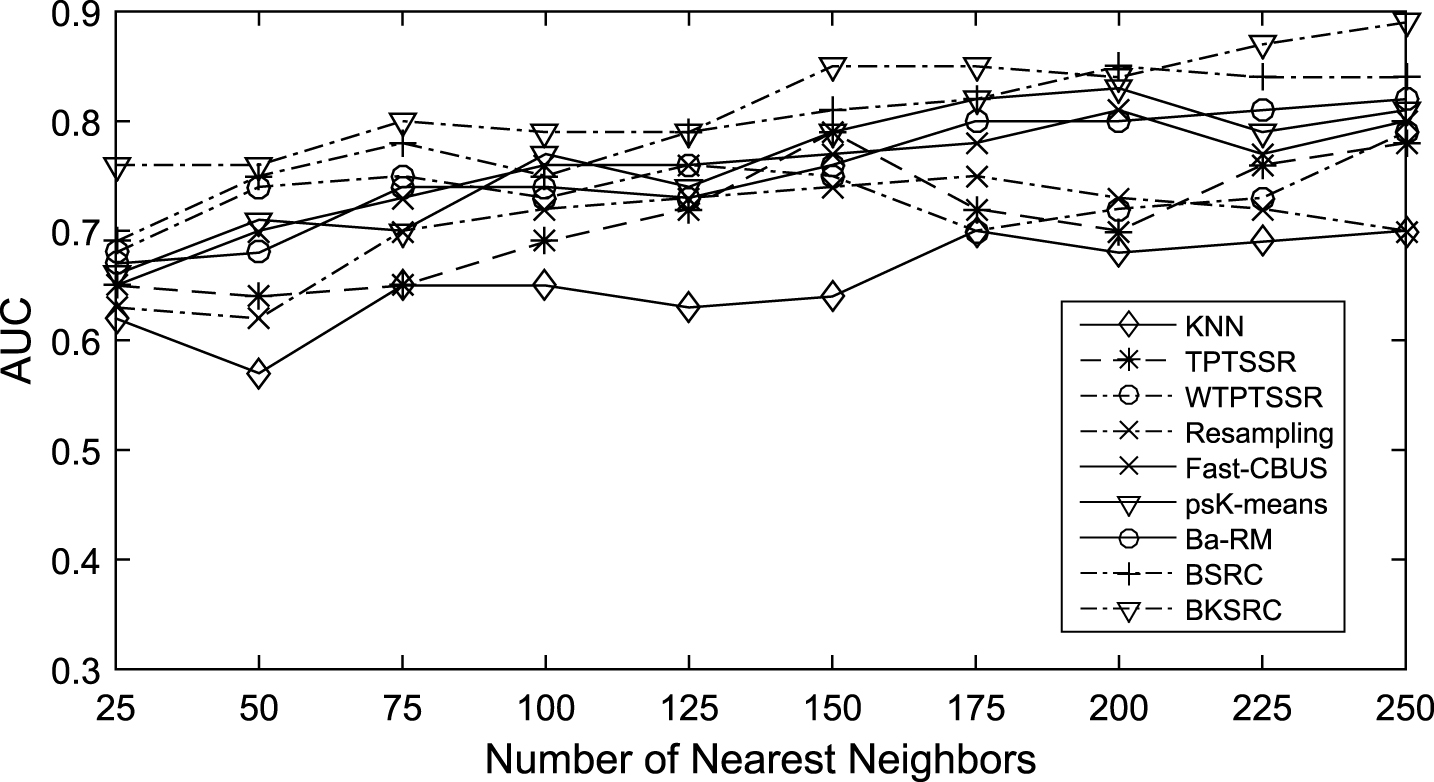
In order to investigate the performance of BSRC and BKSRC (Gaussian kernel K (x, y) = exp (- ||x - y||2) and Both γ and μ were set to 0.01 here), we compare it with KNN [42], Resampling [43], TPTSSR [34], WTPTSSR [35], Fast-CBUS [27], psK-means [28], and Ba-RM [29]. We compare the performances using the area under the receiver operating characteristic curve (AUC) value[44], which is a good singular metric when dealing with the class imbalanced problem in various application [44][45][46]. Our methods can achieve very good performances when suitable numbers of nearest neighbors are used to represent the test samples.

Performances compared on YaleB.
Performances compared on PIE.

Performances compared on AR.
From Fig. 1, we can see that BSRC and BKSRC are superior to other algorithms on YaleB data sets with the increasing numbers of nearest neighbors, except for the cases when the numbers are smaller than 125. But even in these cases, the performances of the BSRC are comparable to TPTSSR, WTPTSSR, Fast-CBUS, psK-means, and Ba-RM.
Fig. 2 clearly shows that our methods are always able to obtain much higher AUC values than all the other sparse representation algorithms and specific unbalance methods on PIE data set. Both of the figures show that our algorithms can improve the AUC performance, by providing suitable numbers of nearest neighbors. That is to say, the quality of the representation of test data not only depends on algorithms, but also depends on the representation and information of the absolute number of each class.
For the AR data, BSRC and BKSRC are superior to other algorithms after the numbers of nearest neighbors at hundred as shown in Fig. 3. These different improvements may be caused by a variety of reasons, such as the quality of different face data, the number of each class, the representation ability of each class, and so on. Note that we can also believe our methods have good performances, since the numbers of samples per class in the AR is less than the YaleB and PIE.
Information of KEEL data sets
In order to investigate the performance of the BSRC method, we also conduct experiment on the non-visual data sets from KEEL data set repository [47], which is used as baseline data for class imbalance problem research, as shown in Table 1.
AUC performance comparisons for each data set with low imbalance rate
AUC performance comparisons for each data set with low imbalance rate
AUC performance comparisons for each data set with medium imbalance rate
AUC performance comparisons for each data set with high imbalance rate
On all the data sets with different imbalance Rate, BKSRC is the best among the nine methods compared. The line w/t/l summarized at the bottom of the table, means that TNB wins in w data sets, ties in t data sets, and loses in l data sets, compared with the algorithm at the corresponding column. We summarize the highlights as follows.
From Tables 2, 3 and 4. we can see that the BSRC and BKSRC win more than 6 out of 11 cases. Both two methods have the best performances on 8 data sets with low imbalance rate as shown in Table 2. The original sparse representation method, TPTSSR and WTPTSSR, only win in 1 case respectively. And BKSRC has the best performances on more than 6 data sets. BKSRC has better performances on more than 8 data sets with medium imbalance rate, as shown in Table 3. Compared with all the nine methods, BSRC has better performances on more than 6 data sets except for BKSRC. From Table 4, we can see that the BSRC method only loses 1 case compared with all the method except for BKSRC, while BKSRC method loses 2 cases compared with all the method except for BSRC.
These different improvements may be caused by a variety of reasons, such as the size of samples, number of features, rate of imbalance, and so on. It demonstrates that BSRC and BKSRC yield the best performance, due to the more suitable information representation for imbalanced data classification.
The CIFAR-10 and CIFAR-100 are labeled subsets of the 80 million tiny images dataset. They were collected by Alex Krizhevsky, Vinod Nair, and Geoffrey Hinton [48].
The CIFAR-10 The dataset is divided into five training batches and one test batch, each with 10000 images. The test batch contains exactly 1000 randomly-selected images from each class. The CIFAR-100 is just like the CIFAR-10, except it has 100 classes containing 600 images each. There are 500 training images and 100 testing images per class.

Performances compared on CIFAR-10.

Performances compared on CIFAR-100.
In order to investigate the scalability of the proposed method, both of the data sets contain large number of samples. Here, we also give a brief computational complexity of solving the equation. The global sparse representation matrix can be obtained by the solution to Equation (4). However, the computational complexity of the sparse representation point is found from the whole sample set, and the computational complexity of the sparse representation of a sample is O (t2 (N - 1)), in which the number of none zero weights is t, the number of the samples in the subset is (N - 1). Since the number of samples in this set is much less than that in real applications, the computation complexity is approximate to O ((N - 1) 3).
Compared with the global sparse representation matrix, It is obvious that because only need to find sparse representation points in the neighborhood in Equation (8) rather than in the whole data set, the local sparse representation method obtains the theoretical computing complexity of a sample O (t2K max ), where t ⪡ K max ⪡ (N - 1). This step has far less computational complexity than global sparse representation.
From the experiments, we can see the performances of BSRC and BKSRC are better than other methods, as shown in Figs. 4 and 5. It means the proposed method is still an optimistic extension of the sparse representation on large data sets.
Proposed is new sparse representation learning algorithm, BSRC, for imbalanced data classification. Experiments on popular data sets demonstrate the promising performances of our method. This is attributed to BSRC having two prominent characteristics. Firstly, it inherits the merit of sparse representation, which can avoid the problems with under-fitting or over-fitting. Secondly, since it is designed to relieve the loss caused by class imbalance, it improves the performance of the classifier on class imbalanced data. Moreover, we extend the proposed classifier to a kernelized version (BKSRC) with the kernel trick. This improvement is more suitable for real-world data, no matter whether the data set is balanced or not.
In the future, we will study how to combine other sparse representation learning methods with the sample level and algorithm level methods, and investigate the influence of class imbalance in classification on more data sets. This is an interesting issue to be explored, which might shed light on the design of more powerful classifier algorithms.
Footnotes
Acknowledgements
This work was supported in part by the National Natural Science Foundation of China (Grant Nos. 61502404, 61573297, 61672442), Natural Science Foundation of Fujian Province of China (Grant Nos. 2016J01326, 2016Y0079), Distinguished Young Scholars Foundation of Fujian Educational Committee (Grant No. DYS201707), International S&T Cooperation Program (Grant No. E201402000). We thank the anonymous reviewers for their great helpful comments.