
Abstract
The aim of this paper is introducing a method based on Fuzzy Time-To Failure (FTTF) to improve reliability analysis of complex engineering systems based on fault tree analysis. This method focuses on the quantitative part of fault trees (either static or dynamic) analysis and will compute failure probabilities. FTTF model is developed to estimate the reliability of system and solve aforetime methods problems. The presented FTTF model is able to figure out any construction consist of static and dynamic gates with FTTF distributions integrated on Fuzzy Monte Carlo Simulation (FMCS) techniques to analyzing Possibilistic functions associated with the fuzzy probability distributions for each basic event. Using fuzzy algorithm, gates FTTF are generated, and Top-event TTF evaluated. Some case studies are used to demonstrate the priority of this method in exact evaluation in compared with other solving methods (like: BN, Analytical solution, Markov chain and traditional fuzzy fault tree modeling), but has much less effort while having higher accuracy. Finally, this model is implemented in an Emergency Detection System (EDS) which is a useful system in aerospace and space applications.
Keywords
Introduction
Most useful tools and techniques have been developed to analyze complex engineering systems reliability either qualitatively or quantitatively. A very useful and popular method is so called Fault Tree Analysis (FTA) [1]. The fault tree is a graphical demonstration of the failure routs associated with a particular system failure (the TOP event) to basic failures (basic events) [2, 3]. This method over time has been extended into the more versatile method of Dynamic Fault Tree (DFT) Analysis. A Dynamic Fault Tree is a model for the reliability evaluation of the systems that cannot be captured by Static Fault Trees (SFT) [4]. As a Static Fault Tree, a DFT is composed by a top event which represents the top undesired event (TE, top event) to the events established in low levels or basic events (BEs) that, constructed in accordance with the logic of the fault scenario [5]. Occurrence of top event in DFT depends not only on the event dependencies and sequencing of occurrences, but also on constitution of component and probability density distributions of these events [6]. With a DFT, computing the probability of failure during a certain mission time is feasible. Calculating this failure probability with common Time-To-Failure (TTF) distributions due to computational simplifications shows inexact results for failure behaviours of real-industrial systems. The prime reason for the use of the DFT are such as dependency-sequence events [7], spares capability and redundancy allocation [8], and priorities of events occurrence [9, 10]. Thus, the method can easily provide an integrated representation of system behavior from viewpoint of qualitative and quantitative toevaluate the reliability of complex engineeringsystems [11].
Many studies and researches in various fields of FTA for accurate assessment of systems reliability have been studied. Broadly, there are three quantitative approaches to the analysis of complex system fault tree: methods based on state space [12, 13], combinatorial methods [14], and the methods based on modular approaches (combination of the two mentioned methods) that are used for analysis of dynamic fault trees [15, 16]. Quantitative analysis of the systems with more complexity and intersection terms, either by means of minimal cut/path-sets or using binary decision diagram (BDD) is very time consuming or difficult to analyze owning to shared terms [17], also, the results will be less accurate [18]. For an accurate assessment of system reliability based on limited data, the extension principle of fuzzy theory based on triangular fuzzy membership functions are used for basic event failure probabilities and Fuzzy-Markov approach is used to analyze dynamic fault tree [19]. Fuzzy set theory proposed by Zadeh [20] demonstrated to be a useful and prevalent methodology which makes the confront with these cases where rough estimation of an initial input value plays a vital and useful role in dealing with the inexact output amounts or results. In this subject, many papers and researches have been issued to depict the utilization of fuzzy set theory into the system reliability evaluation using fault tree analysis. Tanaka et al. [21] proposed an fuzzy statistic approach with trapezoidal fuzzy numbers for each event failure probabilities to estimate the cut sets of fault trees. Singer [22] substitute the exact probability value of failure probabilities for basic and top events with triangular fuzzy numbers. Misra and Weber [16] for analyzing his work look up on the fuzzy extension principle, Liang and Wang [23], explained fault tree analysis by means of fuzzy arithmetic operations. Singer [22], Lai et al. [21] and Sawyer [24] proposed fuzzy set theory into safety and reliability analysis to counter uncertainty in probabilistic assessments. While accomplishing a system reliability evaluation, not only component operation states but also component failure occurrence probabilities are generally assumed to be known. So that, components statues must be defined in either functioning state or failed state (in case of repairable systems) [25].
Each of the current studies has strengths and weaknesses depending on the system and method of analyses. However, fault tree analysis has two main entitled outputs: “the probability of TOP event” and “how this event could”. Nevertheless, most of the efforts and studies have been made in quantitative analysis of fault tree and methods that can provide an easier and more integrated analysis. “Probability of TOP event” is one of the most significant parameters in each fault tree analysis that is based on a backward and deductive approach and by means of gates lead to the basic events. Based on exact analysis of a dynamic fault tree, the occurrence of a top event depends not only on the event dependencies and sequencing of occurrences, but also on the component failure probability density distributions of these events. Calculation of failure probability may be computationally expensive and sometimes incorrect. In most cases, exact evaluation of system reliability due to component limited data especially owning to failure rates, is difficult. Practically, due to two main symptoms this is not always the case in real industrial systems [19]: (1) the probability failure rate of components/systems often vitiate over time, so failures of these components/systems may not follow a certain density function in time. Specially, we can’t exactly identify the failure rate of a component or a system due to various kinds of operating conditions. In addition, vagueness of system behavior, and the dynamic operating environment introduce additional difficulties in estimating the accurate failure probabilities of basic events. (2) Attaining adequate and accurate failure data is expansible, formidable, or even impossible for many real and complex systems. This is sensible especially for those systems which have very low components failure rates or have a new designs. In these statuses, use of crisp values for failure behavior is not realistic or possible [26, 27]. In most cases, exact evaluation of system reliability due to component limited data especially owning to failure rates, is difficult.
This paper continues the development of our research in the fields of improving accuracy in importance sampling with integrated approaches such as Fuzzy-Strata and Fuzzy-Clustering [28] sampling; dynamic fault tree analysis based-on Monte carol simulation using fuzzy failure distributions [29]; and reliability estimation of multi-state system based on fault tree analysis [30, 31]. In this paper, the Fuzzy Time-To-Failure (FTTF) model is extended to estimate the reliability of system and solve aforementioned problems. Accordingly, Exponential fuzzy failures are used to achieve fuzzy probability membership function for occurring of fault tree Top-event. In order to analyzing Possibilistic functions associated with the fuzzy probability distributions for each basic event, Monte Carlo Simulation (MCS) approach which widely useful in reliability fields is implemented. Using fuzzy arithmetic, events Time-To-Failure (TTF) are generated, and then, Top-event TTF evaluated. Some case studies are used to illustrate almost exact evaluation of this method. For this purpose, the results are compared with other solving methods (such as: Bayesian Network, Analytical solutions and Markov chain). In addition to accurate evaluation and equality of results with exact solution, much less time consuming and effort is required. Finally, reliability analysis of Emergency Detection System (EDS) as a practical system in aerospace and space industries has been investigated by using this model.
The remainder of the paper is structured as follows: Section 2 presents fault tree analysis. Section 3 presents possibility theory that is used to illustrate remarkable role in many diverse areas of science and technology notably in reliability and safety analyses of systems. It is also used to illustrate capabilities and advantages of simulation approach in Section 4. In Section 5, examples and case studies for analyzing fault tree behavior in order to comparison of existing method results with other approaches are presented. Section 6 presents the results of reliability analysis for EDS as a practical system with our method. Lastly, Section 7 presents conclusions and futurework.
Fault tree analysis
Fault tree analysis as an exhaustive and graphical approach, is a perfect engineering technique in the reliability, availability, maintainability and safety (RAMS) fields. Dynamic Fault Tree (DFT) iscomplementary division of Static Fault Trees. The same as graphical representation of SFT, in addition, a DFT has dynamic structure model for the reliability evaluation of systems that the undesired top event occurring ways have priorities, redundancies, sparing and other functional dependencies [4]. They have the ability to also specify ordering in which the BEs occur. DFTs extend SFTs with the sequence-dependent, spares and priority gates [32]. The gates exert influences towards each other depending on their type and they define how failures propagate through the entire system. In FTA [33], trees construction (based on correspond gates) built up from the basic events to the undesired top event, and finally an overall model draw out. A reliability engineer can compute the chance of a system failing, during a specified mission time, with a FT and a list of failure rates, for every BE present. This information can be used to support engineering and management decisions, trade-off analysis and risk assessments. Each BE has a failure distribution. This is a statistical distribution and the ones mostly used are the Weibull and the exponential distribution [25]. An appropriate fault tree covers the most creditable faults that assessed by the analyst corresponsive to its top event and failure modes contribute to a specific analyzing system [34]. It is evident that this is a private elegance, so that may not complete. In this article, there are some main assumptions for the application of DFT associated with the system being analyze. Among these are: (1) the same as many authors, components are not repairable and (2) event occurrences are in binary models. For Boolean construction, we now define the basic FT constructs (SFT and DFT Gates) used in FT analysis [6].
Let us denote the TTF of the ith input event (or basic event) of the tree construction by τ
i
, i = 1, ⋯, n. In this paper to comparison the results with other existing methods, we suppose that all gates have two inputs A and B. So, mathematical speaking for the gates used in fault trees is as follows.
Static AND gate. Output occurrence of an AND gate to fail happens while all input components of the gate must fail. So, if τ
AND
represents the TTF of the output event, then, the probability of failure of the output of the AND gate in the time interval is given by
Phrase Static OR gate. Output occurrence of an OR gate to fail, happens if at least one of the input evens occurs. So, if τ
OR
represents the TTF of the output event, then, the probability failure of the output of the OR gate in the time interval is given by the:
We then define the TTF of the OR gate by
As shown in Fig. 1, the input events are A and B for both static OR and the AND gates. Hence, the OR gate contains the Demonstrations of results for OR (left) and the AND (right) gates. Summary Comparative Values (Analytical, BN and FTTF results) Dynamic SPARE gates. Spares gate have a primary input event or main event and one or more spares event or standby redundant input. Events in spare statues have two operation moods: an active mood and a standby mood. Any mood represented by its corresponding time to failure distribution. Standby spare mood while becomes active when the primary active event fails. A system with spare construction fails if all main and spares events fail. According to the standby moods of SPARE gate, this gate has three statues as: Cold, Hot and Warm spares. Hot Spare gate (HSP). Equivalent to AND gate, both standby and active moods of the spare have failure rates the same as main component.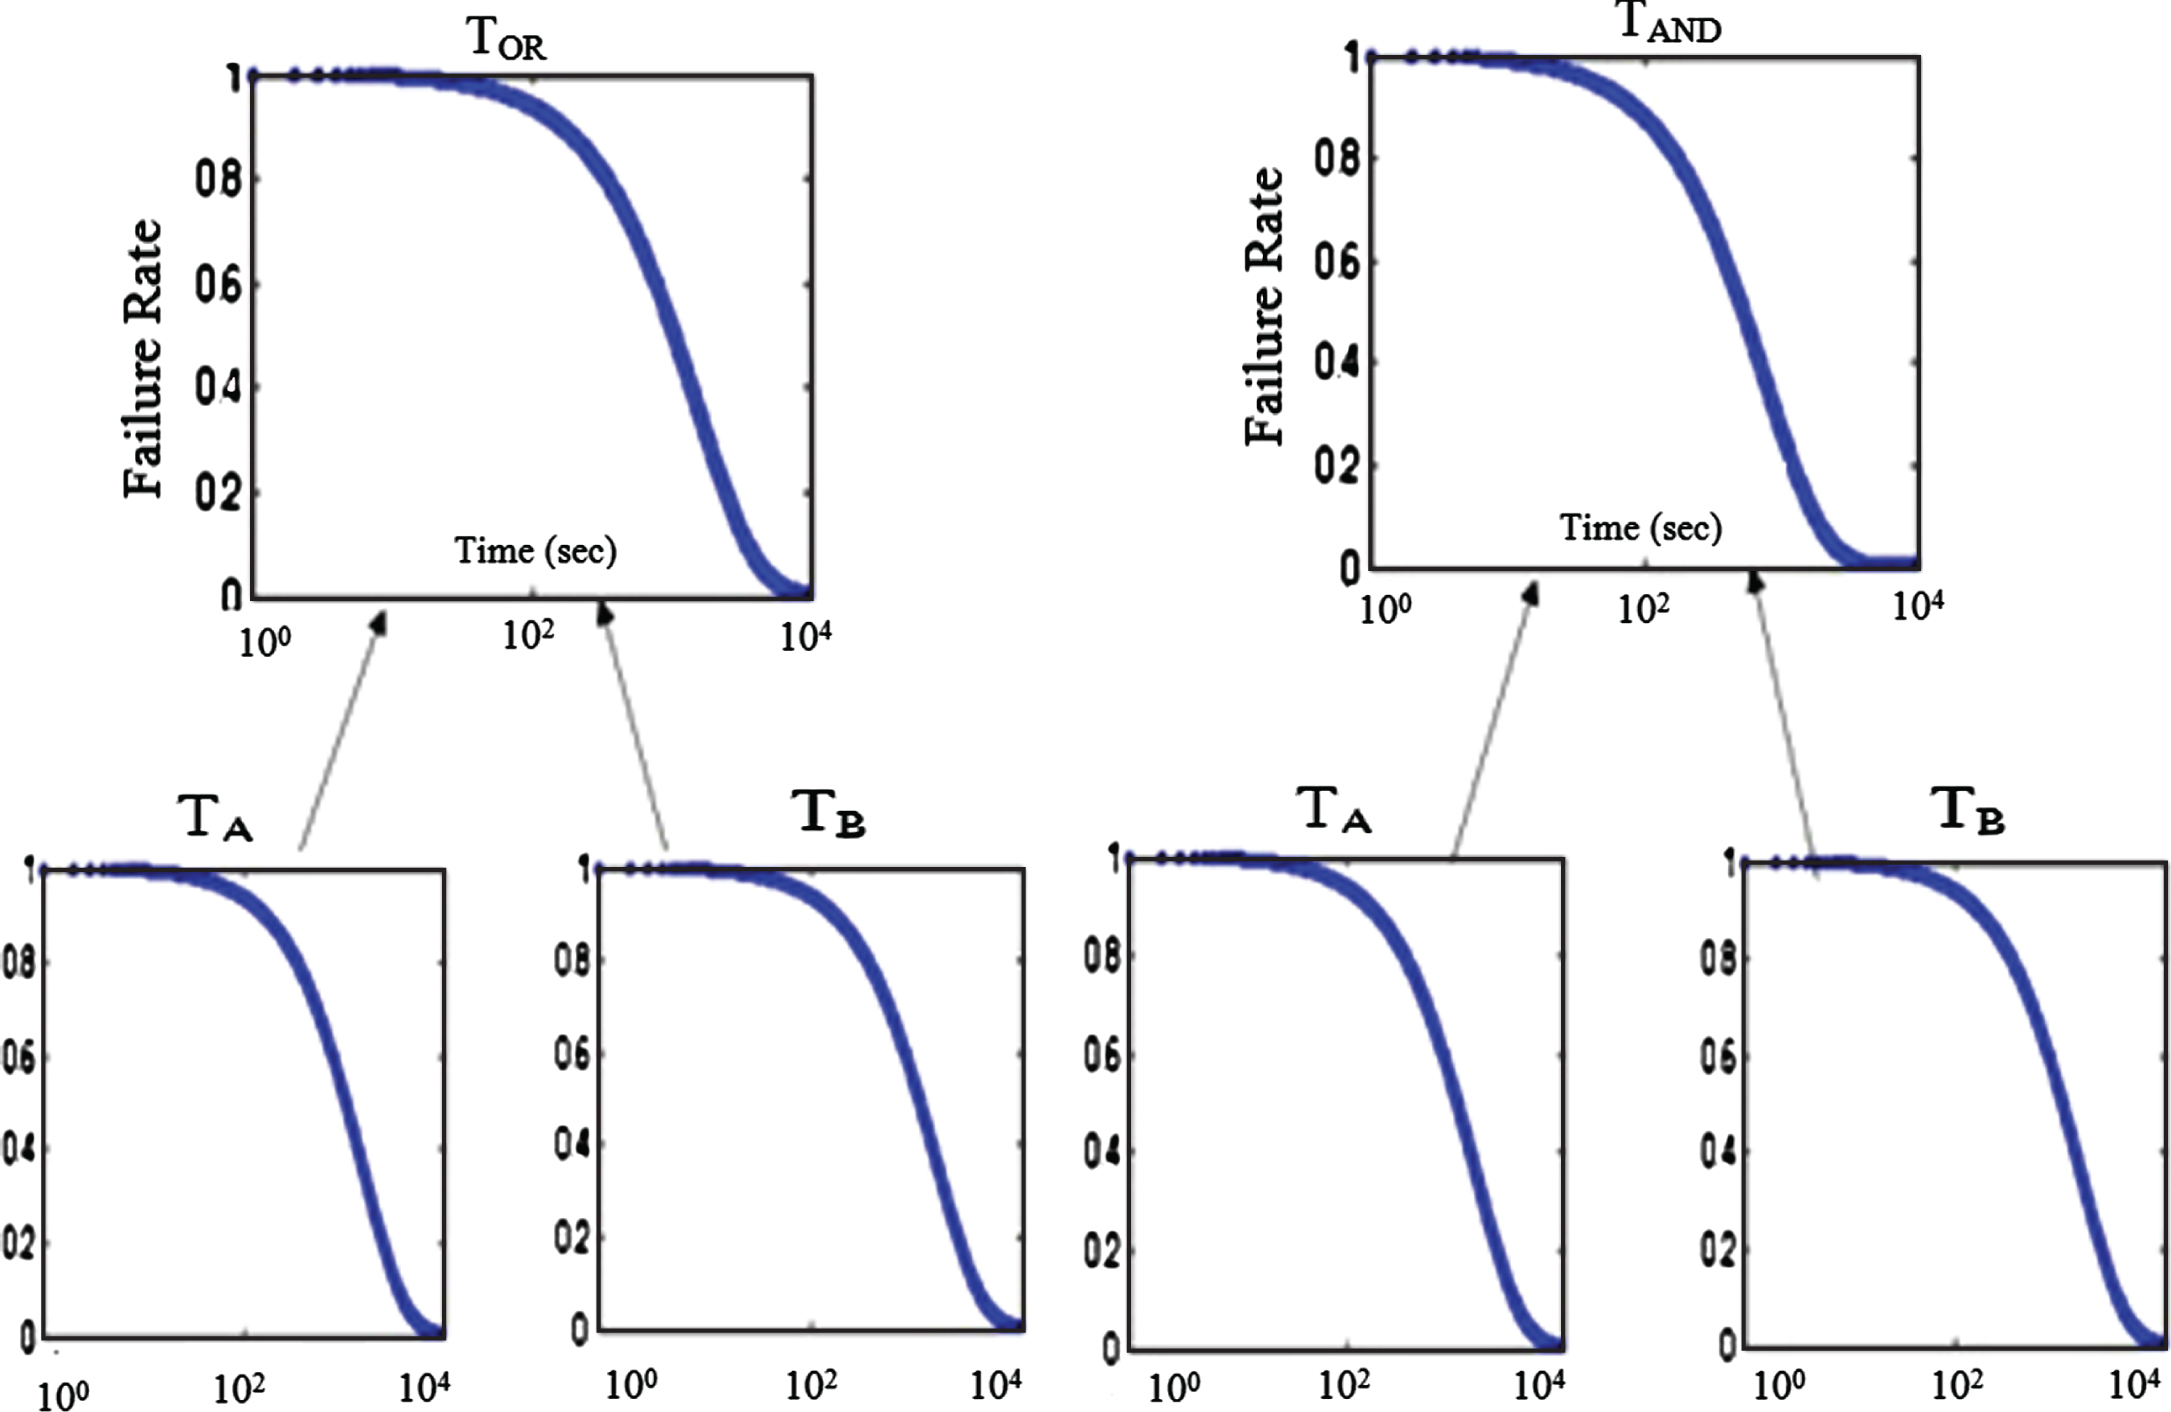
Executing the FTTF model for 100 MCS iterations results are shown in Fig. 2 and attained values given in Table 1, results for HOT Spare gate are compared with the estimates using Bayesian Network and numerical integration.
FTTF for Hot Spare gate (up: Spare’s standby mode cross with active mode, down: Spare’s standby mode is active mode). Cold Spare gate (CSP). In this mood, while in standby modes, the spare events never fail or hazard rate is zero. τ
main
explanatory the TTF of the main component and τ
i
is the TTF of the ith spare component when in active mood. Therefore, the time to failure probability of a system with a standby configuration fails in the time interval[0, t] is given by
That is, the CSP gate probability density function is given by the convolution of the failure distributions of the main and active spare components. Executing the FTTF model for 100 MCS iterations results are shown in Fig. 3 and attained values given in Table 1, results for COLD Spare gates are compared with the estimates using Bayesian Network and numerical integration.

FTTF for Cold spare gate (CSP).
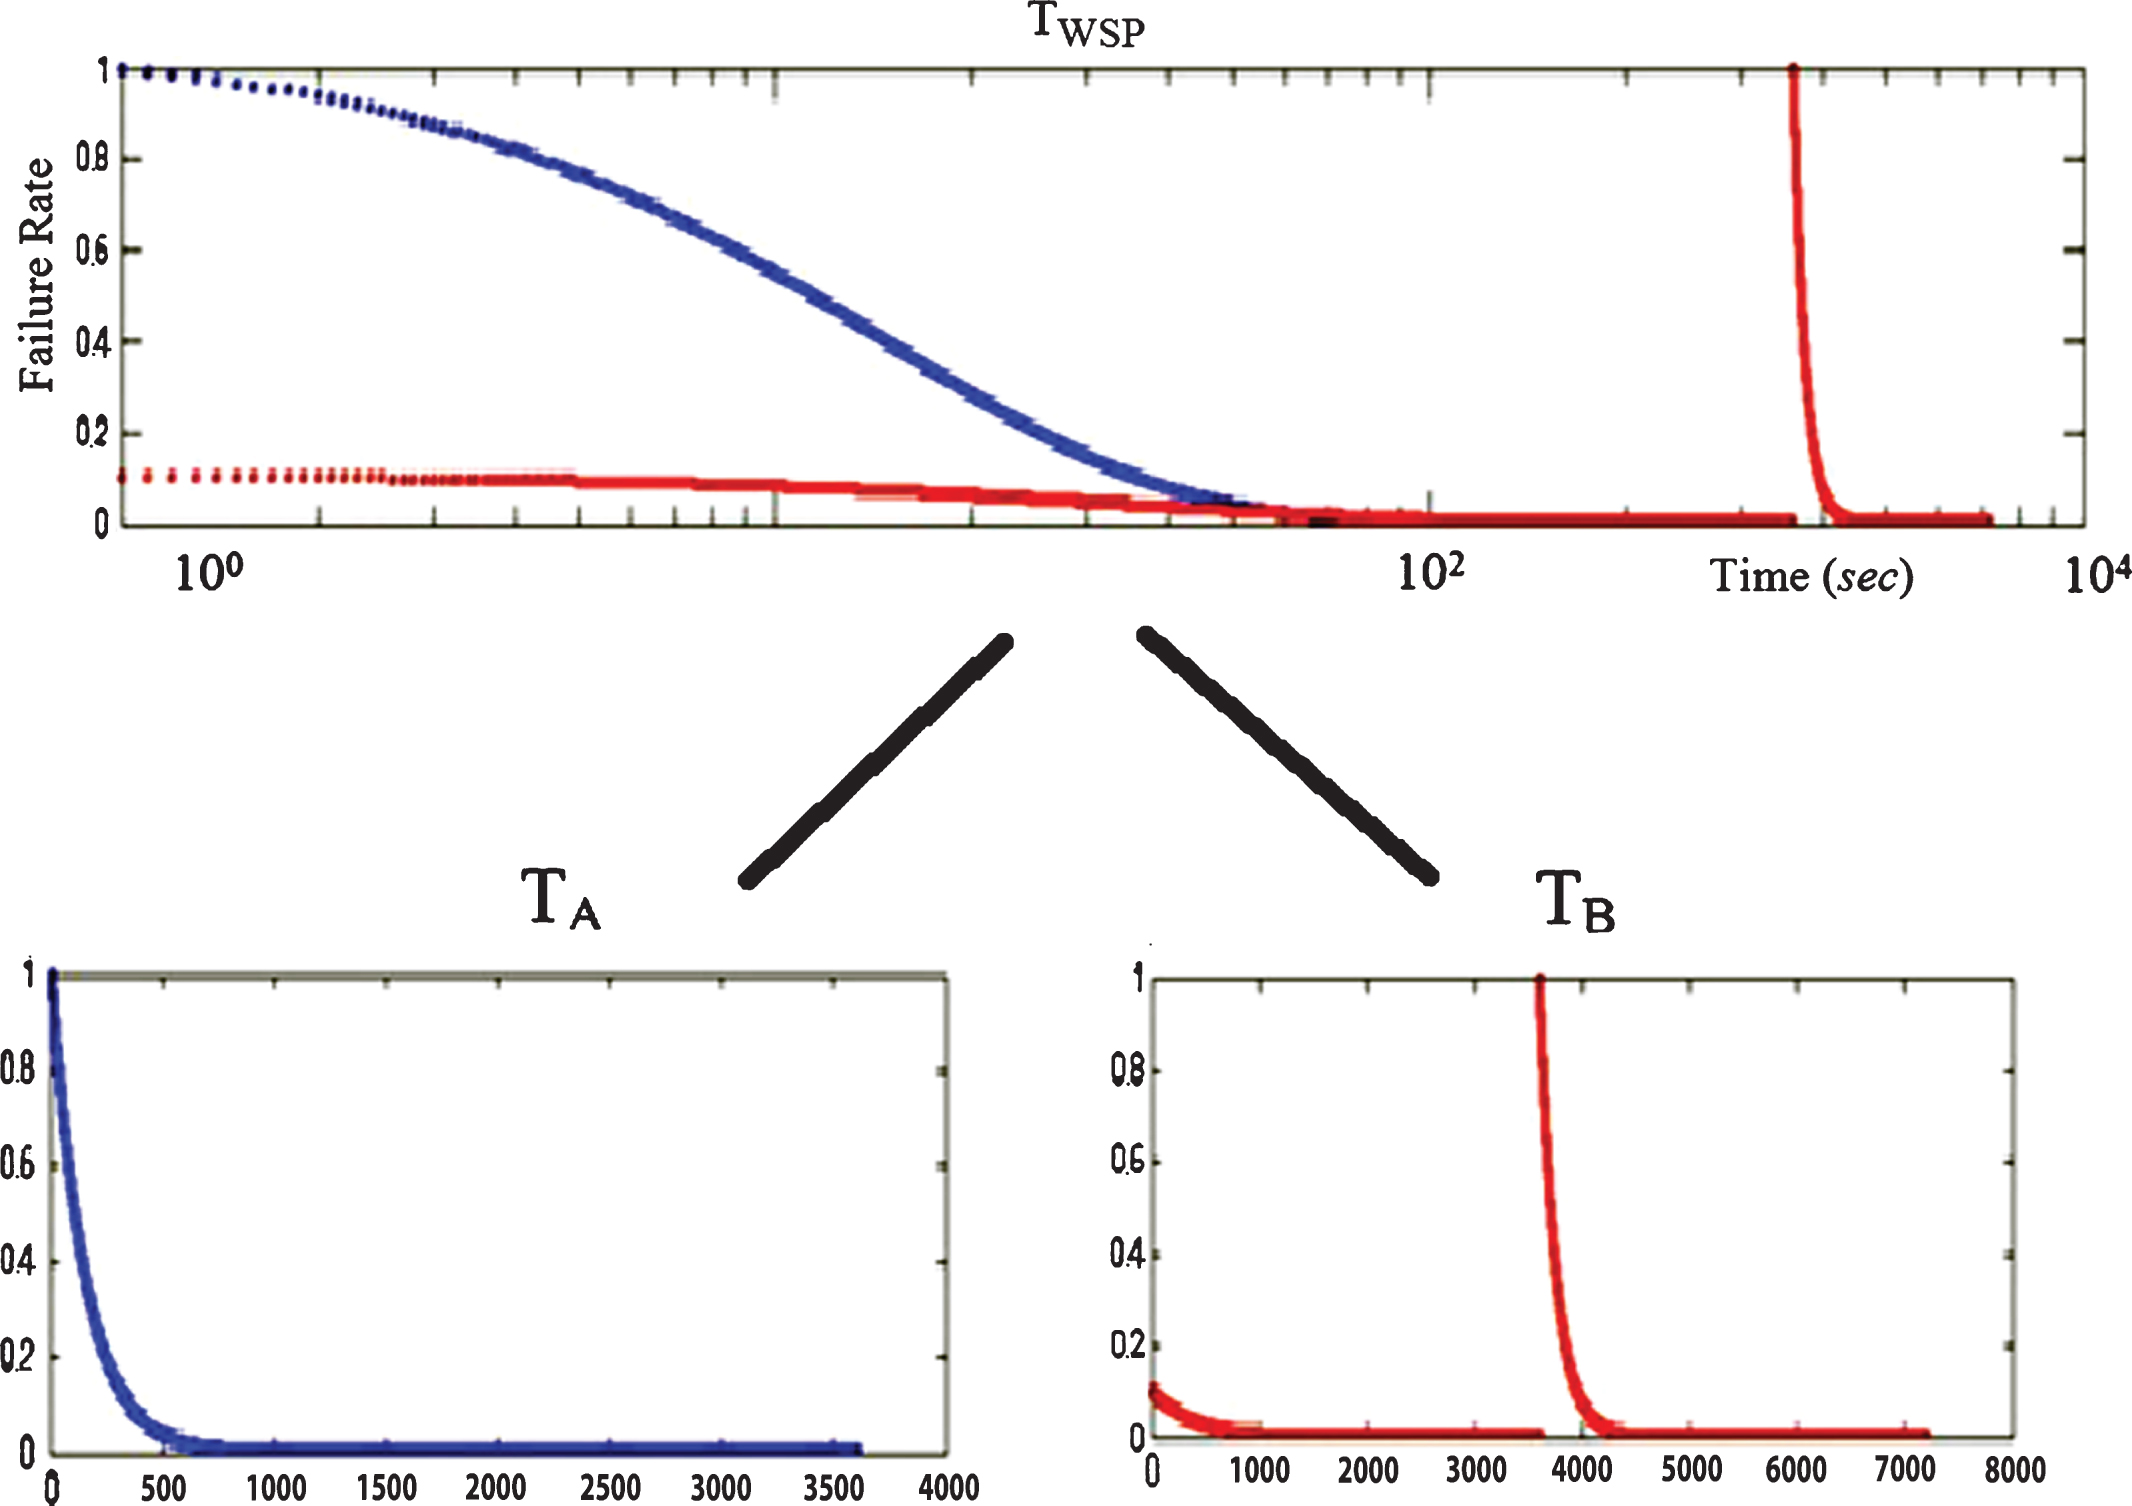
Warm Spare gate (WSP). In this mood, while in standby modes, the spare events hazard rate is less than in active mode. Consider a warm standby system consisting in one main component and one spare. Let us denote by τ
main
the TTF of the main component, TTF of the spare component in standby mode
Failures of spare component when in standby mode before the fails of main component at time t1 < t.
Failures the main component at time t1 < t, the spare component in standby mode is not failed at time t1. Moreover, failure of the spare component in the active mode happens during the time t - t1.
If the spare components have constant hazard rate such as exponential distribution, aforementioned statues can be directly written in terms of the components TTF by,
From the above expression, we can derive the failure distribution for warm spare gate with exponential probability distribution function by
Running the model for 100 iterations results are shown in Fig. 4 and in the summary values given in Table 1, results for WSP gate are compared with the estimates using Bayesian Network and numerical integration.
Dynamic SEQ gate. The Sequence enforcing gate (SEQ) model the failures that occurrence of events occurs in certain order. SEQ gates are a special case of the Cold spare gate, so the same model can be used for both types. SEQ gate of DFT, enforce occurrences of events in special order. All of input events are basic events. Assuming that G
i
is the time distribution to occurring ith input. Therefore, SEQ gate occurrence probability is given by Equation 3 as below. FTTF for Warm Spare gate (WSP). The Priority-AND gate (PAND). The PAND gate output happens while all of its input events fail in a predetermined order (left to right). Consider a system with PAND gate consist of two components, and denote by τ
i
the time-to-failure of the ith component, i = 1, 2. Time to failure of PAND represented by τ
PAND
. Then, the failure probability of PAND gate in the time interval [0, t] is given by
Accordingly, assumed that T1, T2, T3 are random input variables for PAND gate (subtrees). Such being the case, PAND gate occurrence probability is given by [15, 16].
We can find G (t) by means of integrating methods by calculating G1 (t), G2 (t) and G3 (t). To view this calculation, trapezoids integral have been used to exact solution. So, we have
Here, the number of steps/time intervals is (m) and h = t/m is the interval increment. Figure 5 shows a combinatorial fault tree draw out to dissolve a DFT, composed two cascade PAND gates.
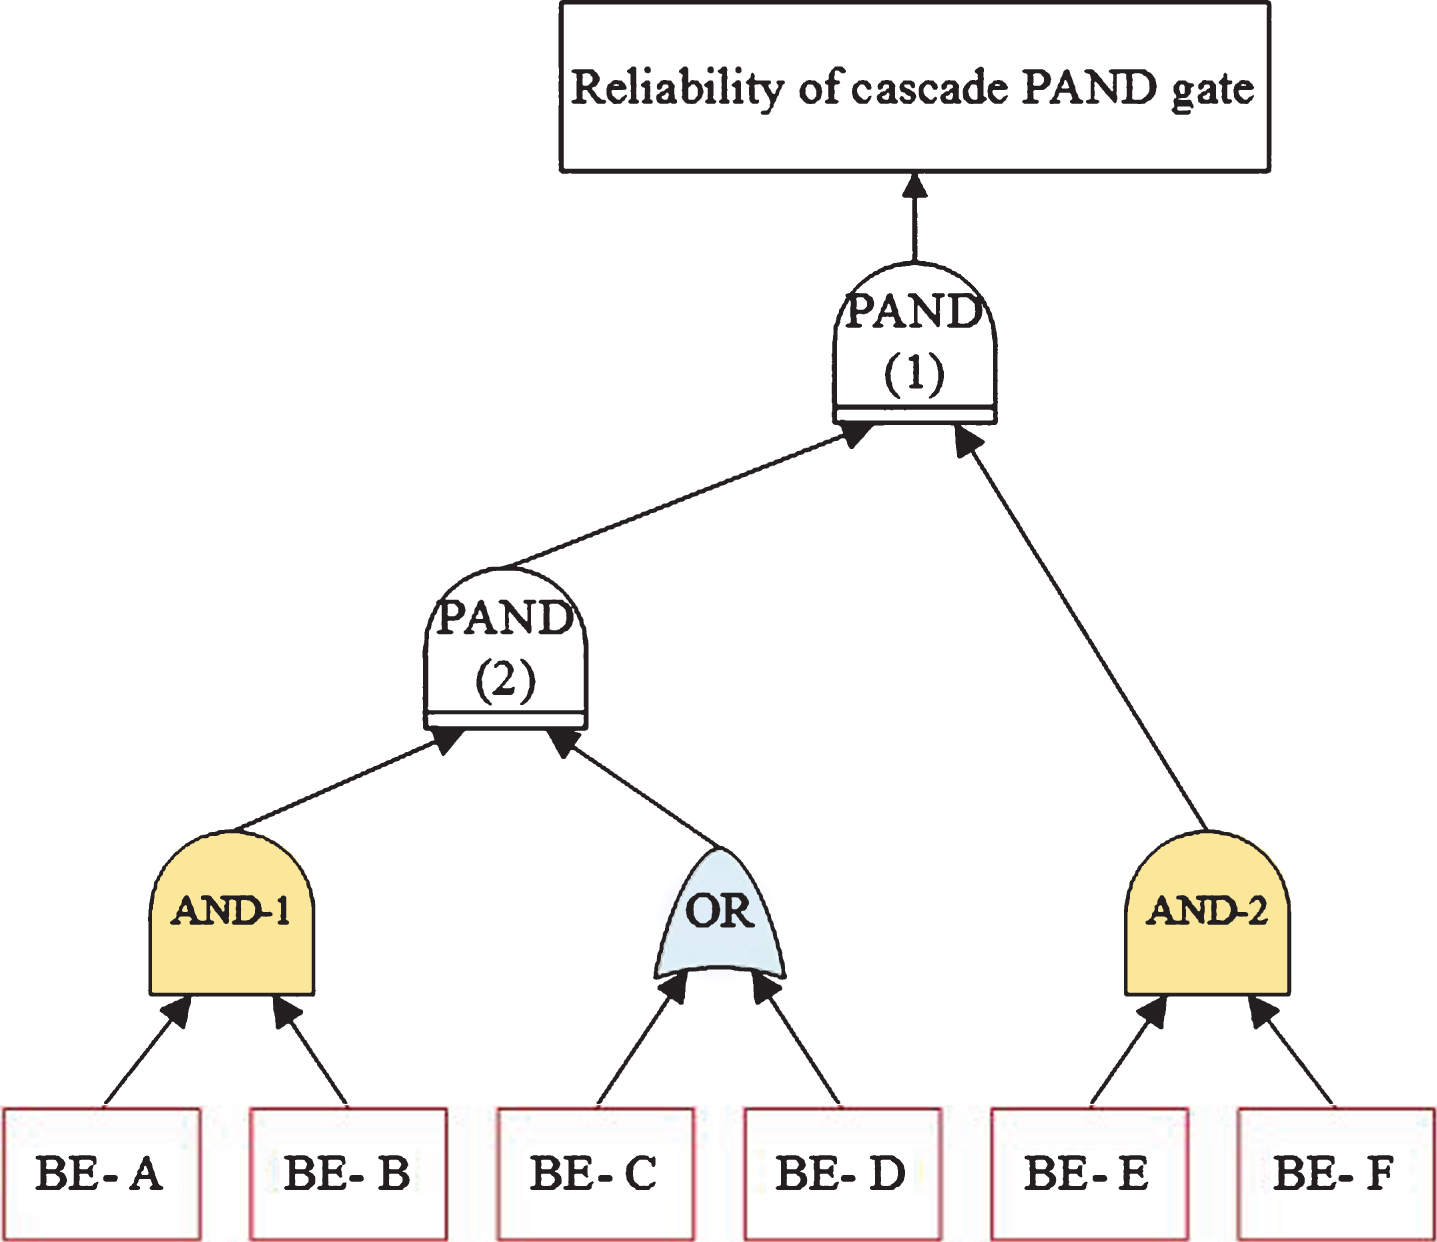
Fault tree of Cascaded PAND system.
The FTTF model for cascade system example is depicted in Fig. 6. Running the model for 100 iterations results are shown in Fig. 6 and in the summary values given in Table 1, results for PAND and SEQ gates that are used in application example are compared with the estimates using Bayesian Network and numerical integration.
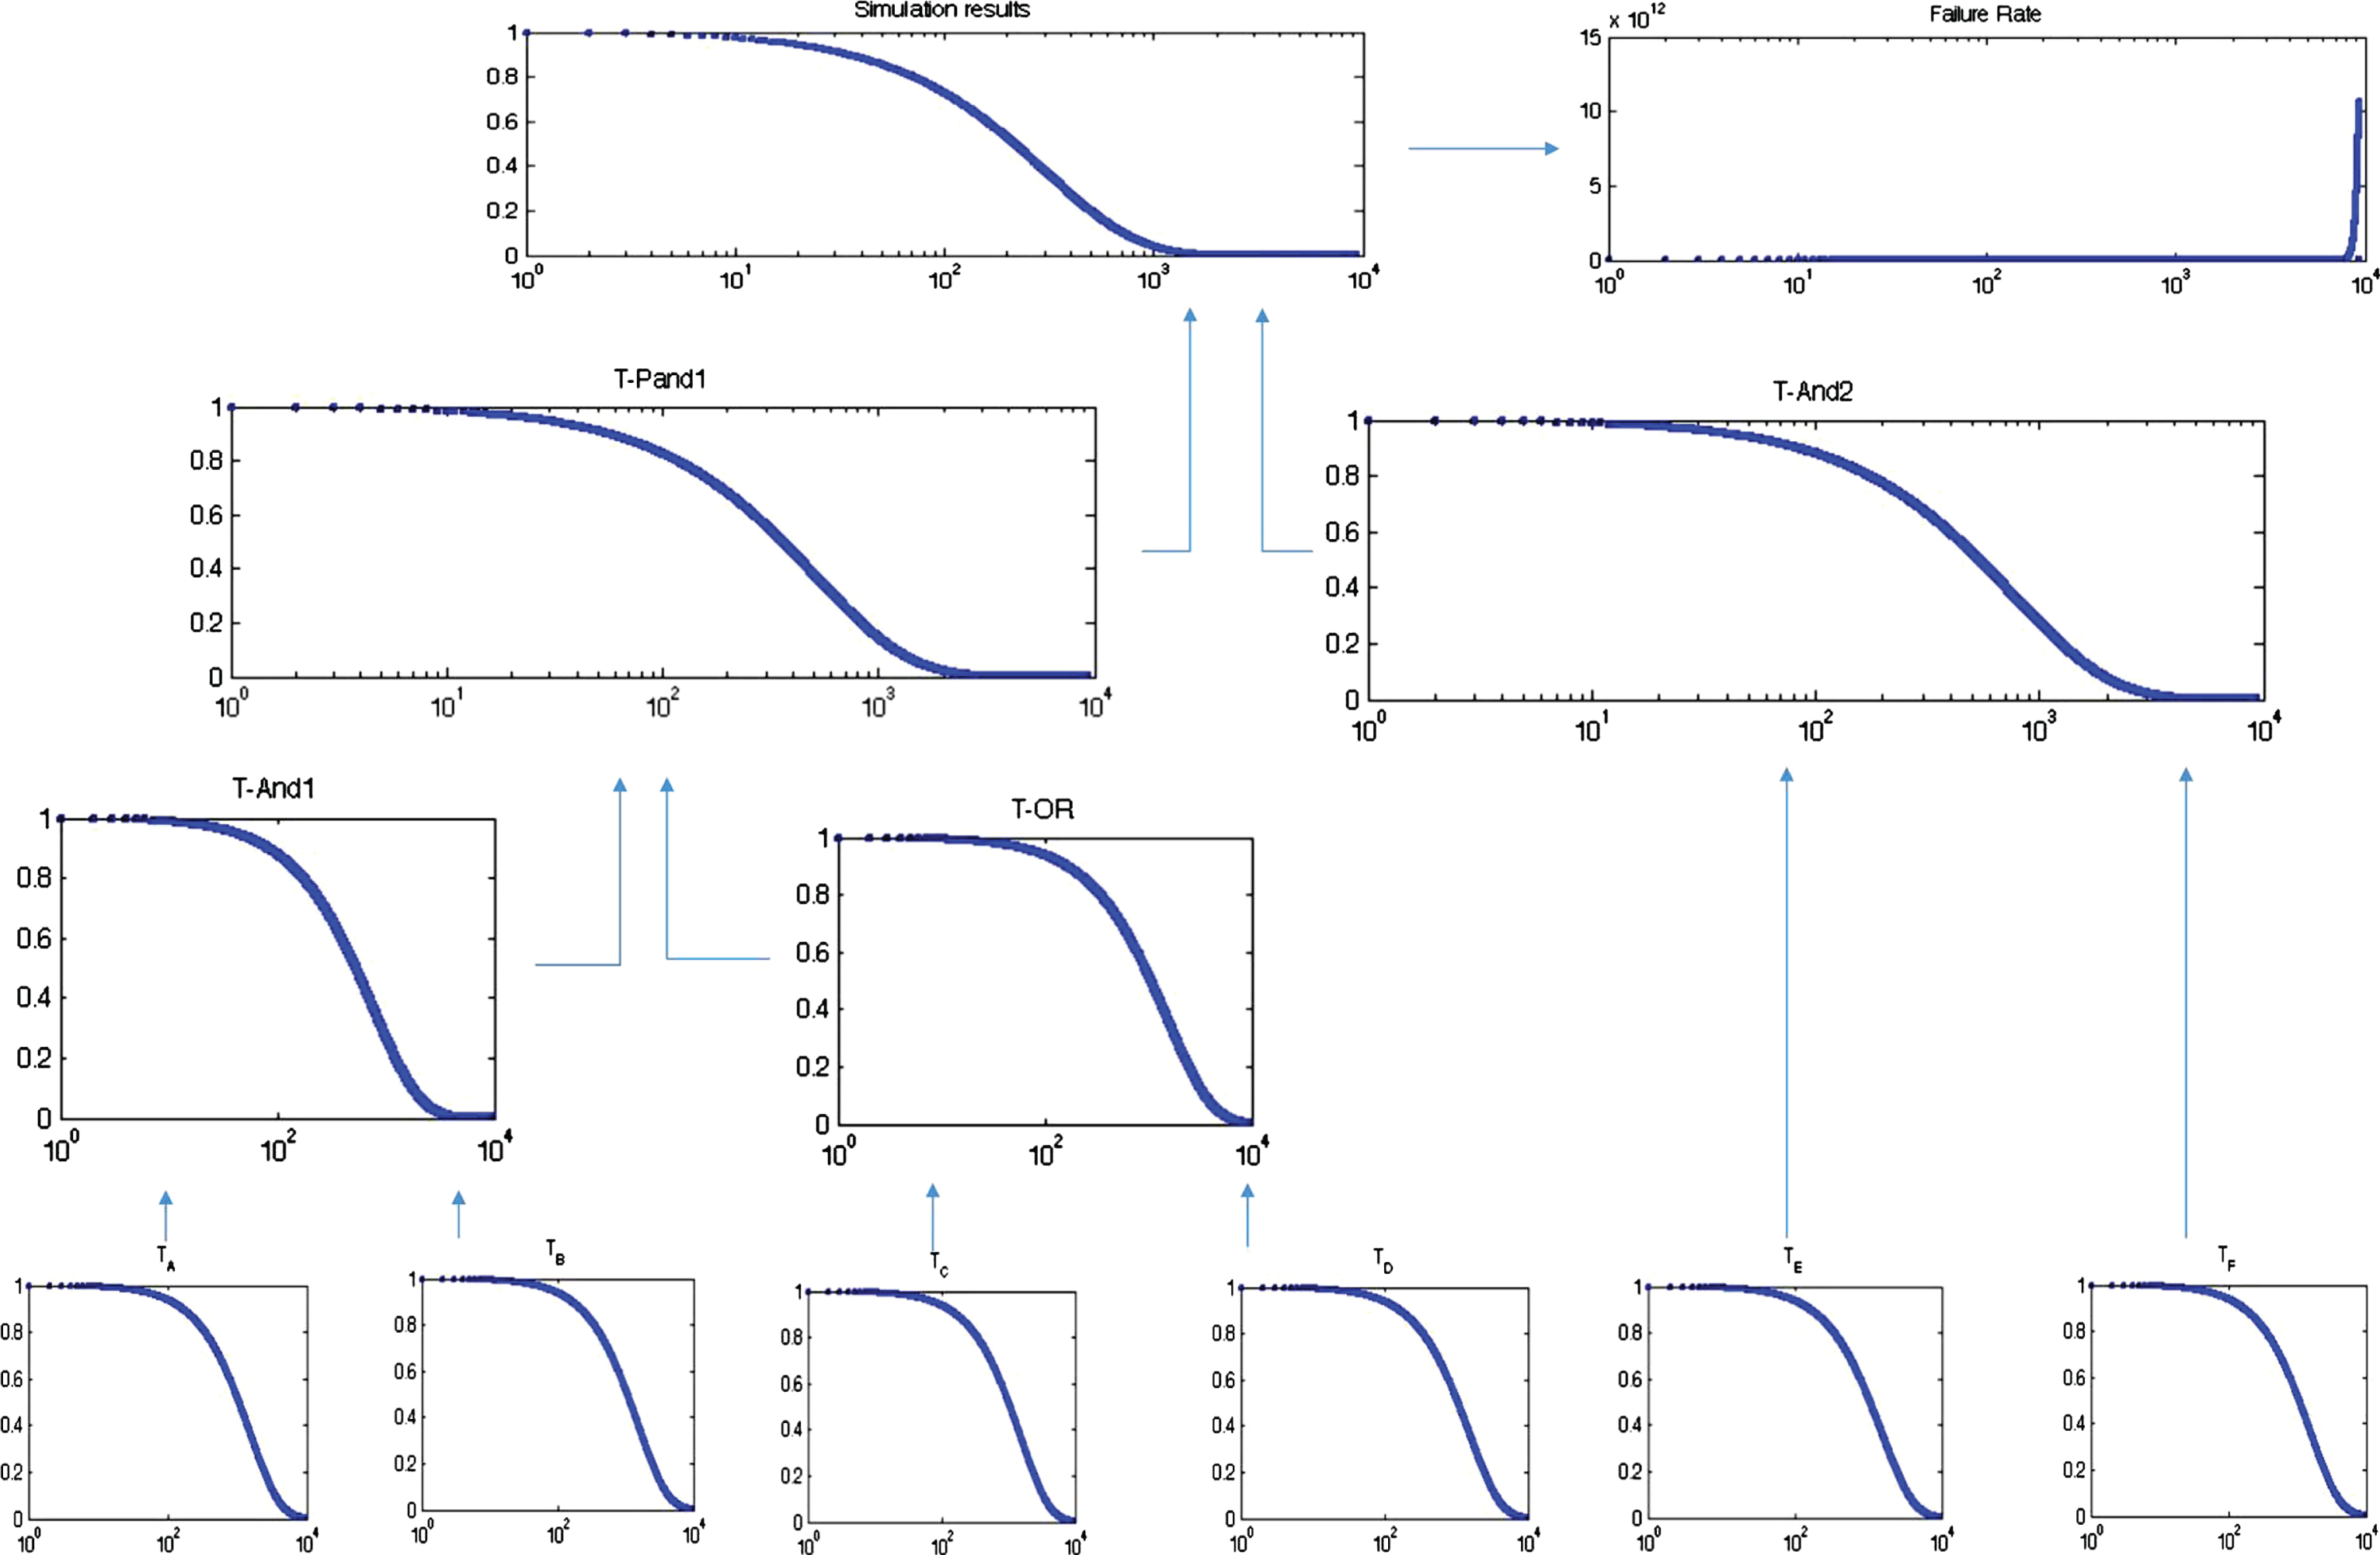
FTTF representation for Cascaded PAND system.
In recent years fuzzy sets theory has been playing a remarkable role in many diverse areas of science and technology, notably in reliability and safety analyses of systems. However, as a matter of fact, fuzzy theory, for example possibility theory, is compatible with probability theory. By use of a particular probability distribution for TTF, owning to inaccurate data, a lot of uncertainty imports into the results. In the absence of accurate data, rough estimations of the probabilities by the designer or by the use of expert opinions are required. To overcome this problem and limiting the confidence interval, fuzzy set theory with different membership functions (triangular, trapezoidal, and exponential) were considered.
Based on traditional time-to-failure theories, failures of fault trees with corresponding components occur suddenly at a single point of operating time. In these methods there is no aging and degradation factor that shows gradually fails in system components; besides the inaccuracy of knowledge and information that is obtained by experts based on experience [25]. Even the most expertise, accurate, and well-favored models for quantitative analysis of fault trees may give illusory results if applicatory and suitable failure rates are not treated at each event. Hereupon, the Possibility set theory has been introduced to cope of simplification and inexact assumptions in input variables. Unhappily, the result of above hypothesis can too limitative, specifically applied in real industrial that the time to failure of them assigned not only by exponentially distribution but also by other probability distributions such as; Weibull, Gaussian or lognormal probability distribution. Main parameter of fuzzy set theory is the membership function
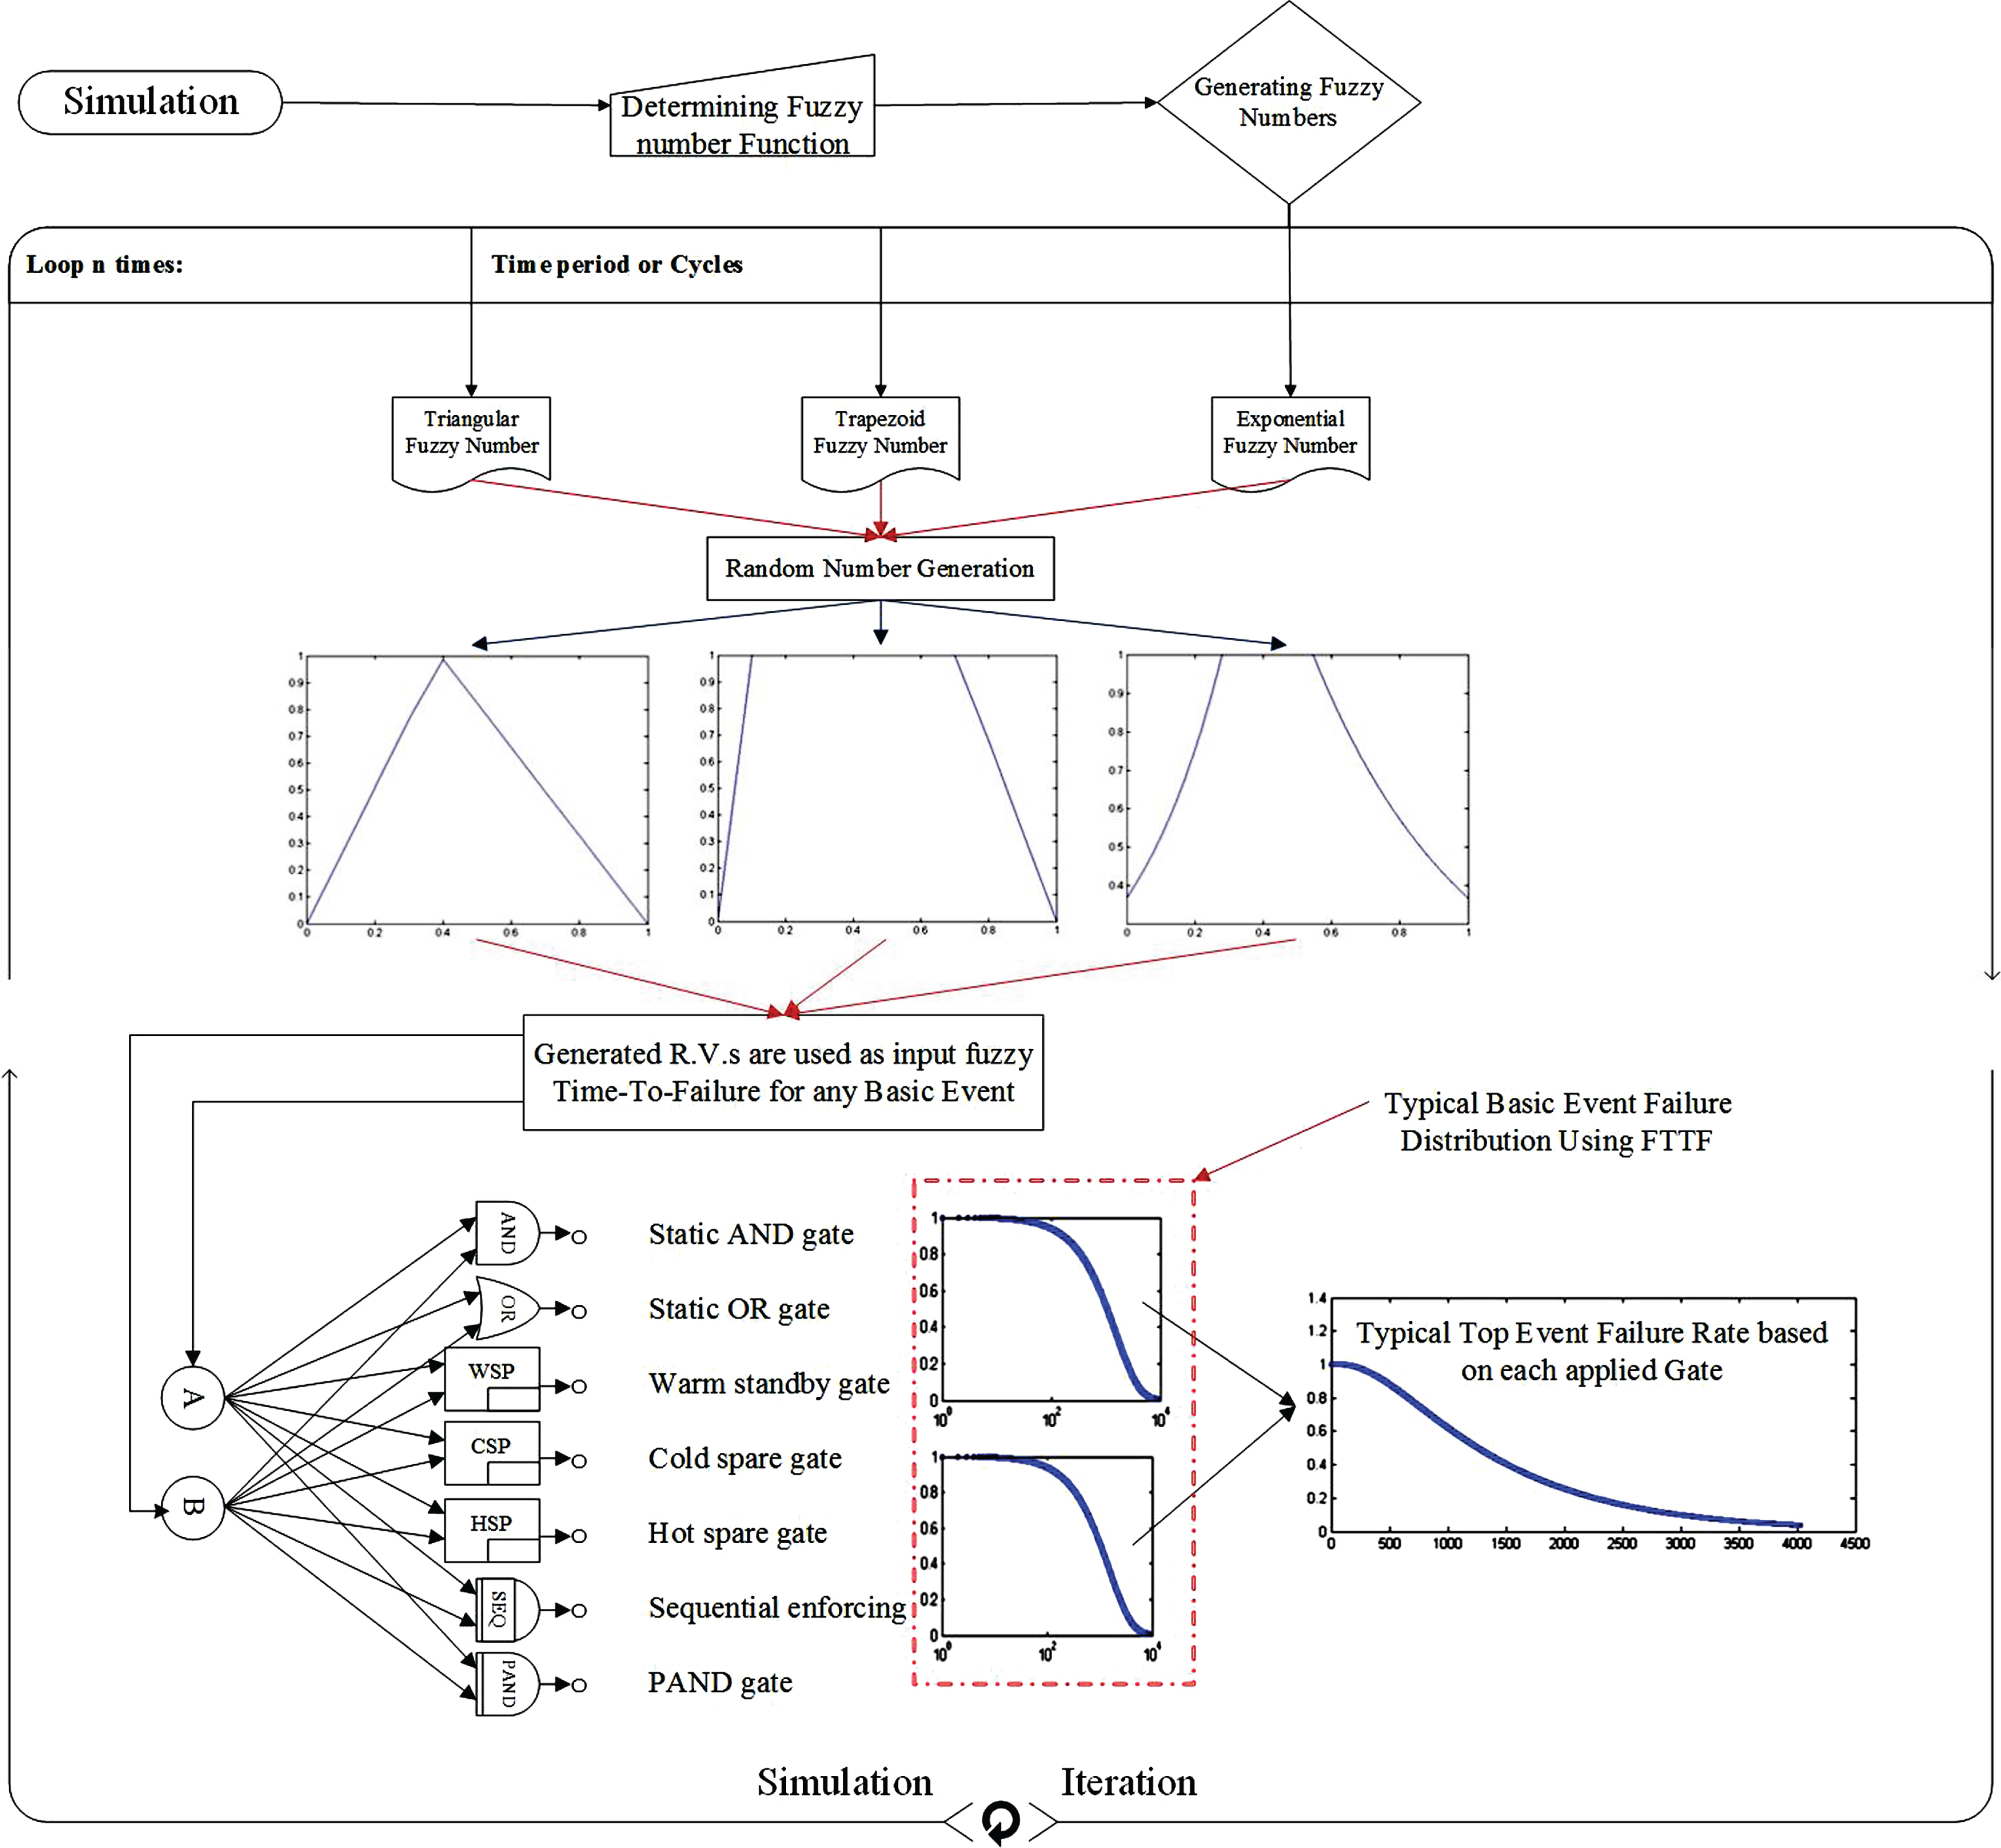
Proposed Fuzzy-Monte Carlo simulation based on fuzzy input numbers.
In many engineering fields, Monte Carlo simulation as an statistical technique is implemented to open sesame the problems, especially when analytical approaches are infeasible [36]. The base of this method stands on the generation of a spate random numbers, which classified in groups as clusters or strata corresponding to required sampling process. In this technique in order to perform simulation process, pivotal stochastic samplings for each independent variable are accomplished based on generated random variables; for this reason, an exact evaluation of a parameter with a Monte Carlo simulation cannot produce as it is calculate the average among of the generated random variable space [37]. Nowadays, due to growth of computer calculation power in simulation process and program execution, this technique enjoying superior accuracy. The main Excellency of the simulation methods in comparison with other approaches is that it can use any distribution for time to failure parameter in analyzing fault trees [25]. The other advantage of simulative methods relates to the clarity of iterative process: estimation of Top event probability of the fault tree requires the information of entire input events and component in simulation schema (i.e. the number of components and sub-trees, and correlation between events on the basis of connecting gates), whiles the other approaches such as the analytical solutions, these information and dependencies depict in a set of ordinary differential equations. Therefore, at the termination of each simulation, possibility [38] of retrieving information about the other portions of the fault trees like Basic and intermediate events, and connecting gate is feasible. Despite these advantages, it is necessary to point out that the simulation approaches have three prevalent disadvantages that are: computing cost, input’s event probability density function has sensitivity to ambiguity and uncertainty and the coherency and relation hypothesis among all inputs are required [39]. To counter and cope aforementioned disadvantages, the possibility approach based on fuzzy set theory is useful [29]. Fuzzy algorism, with a simple computational format is robust to temper variations in the probability distributions on input events and does not need to the researcher to suppose special relevancies among events for solving DFT in reliability evaluations. Theorists proposed that upper bounds of probability measures attains by fuzzy admeasures [40]. The kernel of the MCS in fault tree analysis is the failure distribution that assigned to each basic event [25].
In this paper, in order to overcome the limitation of time to failure distribution for BEs, we introduce a Fuzzy Monte Carlo Simulation (FMCS) method that the events have fuzzy time to failure. Based on possibility theory, the FMCS in comparison with traditional Monte Carlo Simulation approaches has two main advantages. Firstly, as aforementioned, the FMCS approach remarks inaccuracy in failure distribution for basic events and use the near to exact time to failure. Secondly, in spite of traditional MCS approach that fails in a single point of time, the Fuzzy Monte Carlo simulation is able to model components fail in either single point or gradually time to fail. The two aforesaid distinctions of the FMCS warrant generating the fuzzy time to failure of the input event. The generated component fuzzy time to failure for basic events go straight toward top event base on gates and in outrance compute the TTF of fault trees and attain the TTF of the whole system. Computing this TTF of system with the analytical methods despite fast and computationally cheap is complicated and impossible for complex systems in turn [41]; however, it uses limited distributions in analyzing the fault tress. Moreover, while the parameters correlations are exit, it isn’t suitable. Hereupon, the simulation based approaches can be widely used to counter aforementioned drawbacks; and also to overcome the problems of simulation technique, the fuzzy approach presented.
In this paper, as shown in Fig. 7, completion the loop of FMCS with specified iteration numbers encompass four steps: firstly, based on fuzzy arithmetic, fuzzy random variables are generate. Secondly, generated random variables are used as input Fuzzy Time-To-Failure for each basic event. Then, failure distributions for basic events by means of FTTF are evaluated. Finally, Top event failure rate and reliability of system are assessed according with the logics among events and correlations between components via gates.
Implementation of FTTF on emergency detection system
We now show how our FTTF framework can be used to analysis of a complex fault tree in a real industrial system. The case assembled in this article is the Emergency Detection System as a module of the air/space vehicle system. It is used for detecting emergency conditions in flying vehicle that designed to treat mechanical and electrical failures of the air and space vehicle systems. Figure 8 shows simplified corresponding non-repairable DFT model for reliability assessment based on simulation technique.
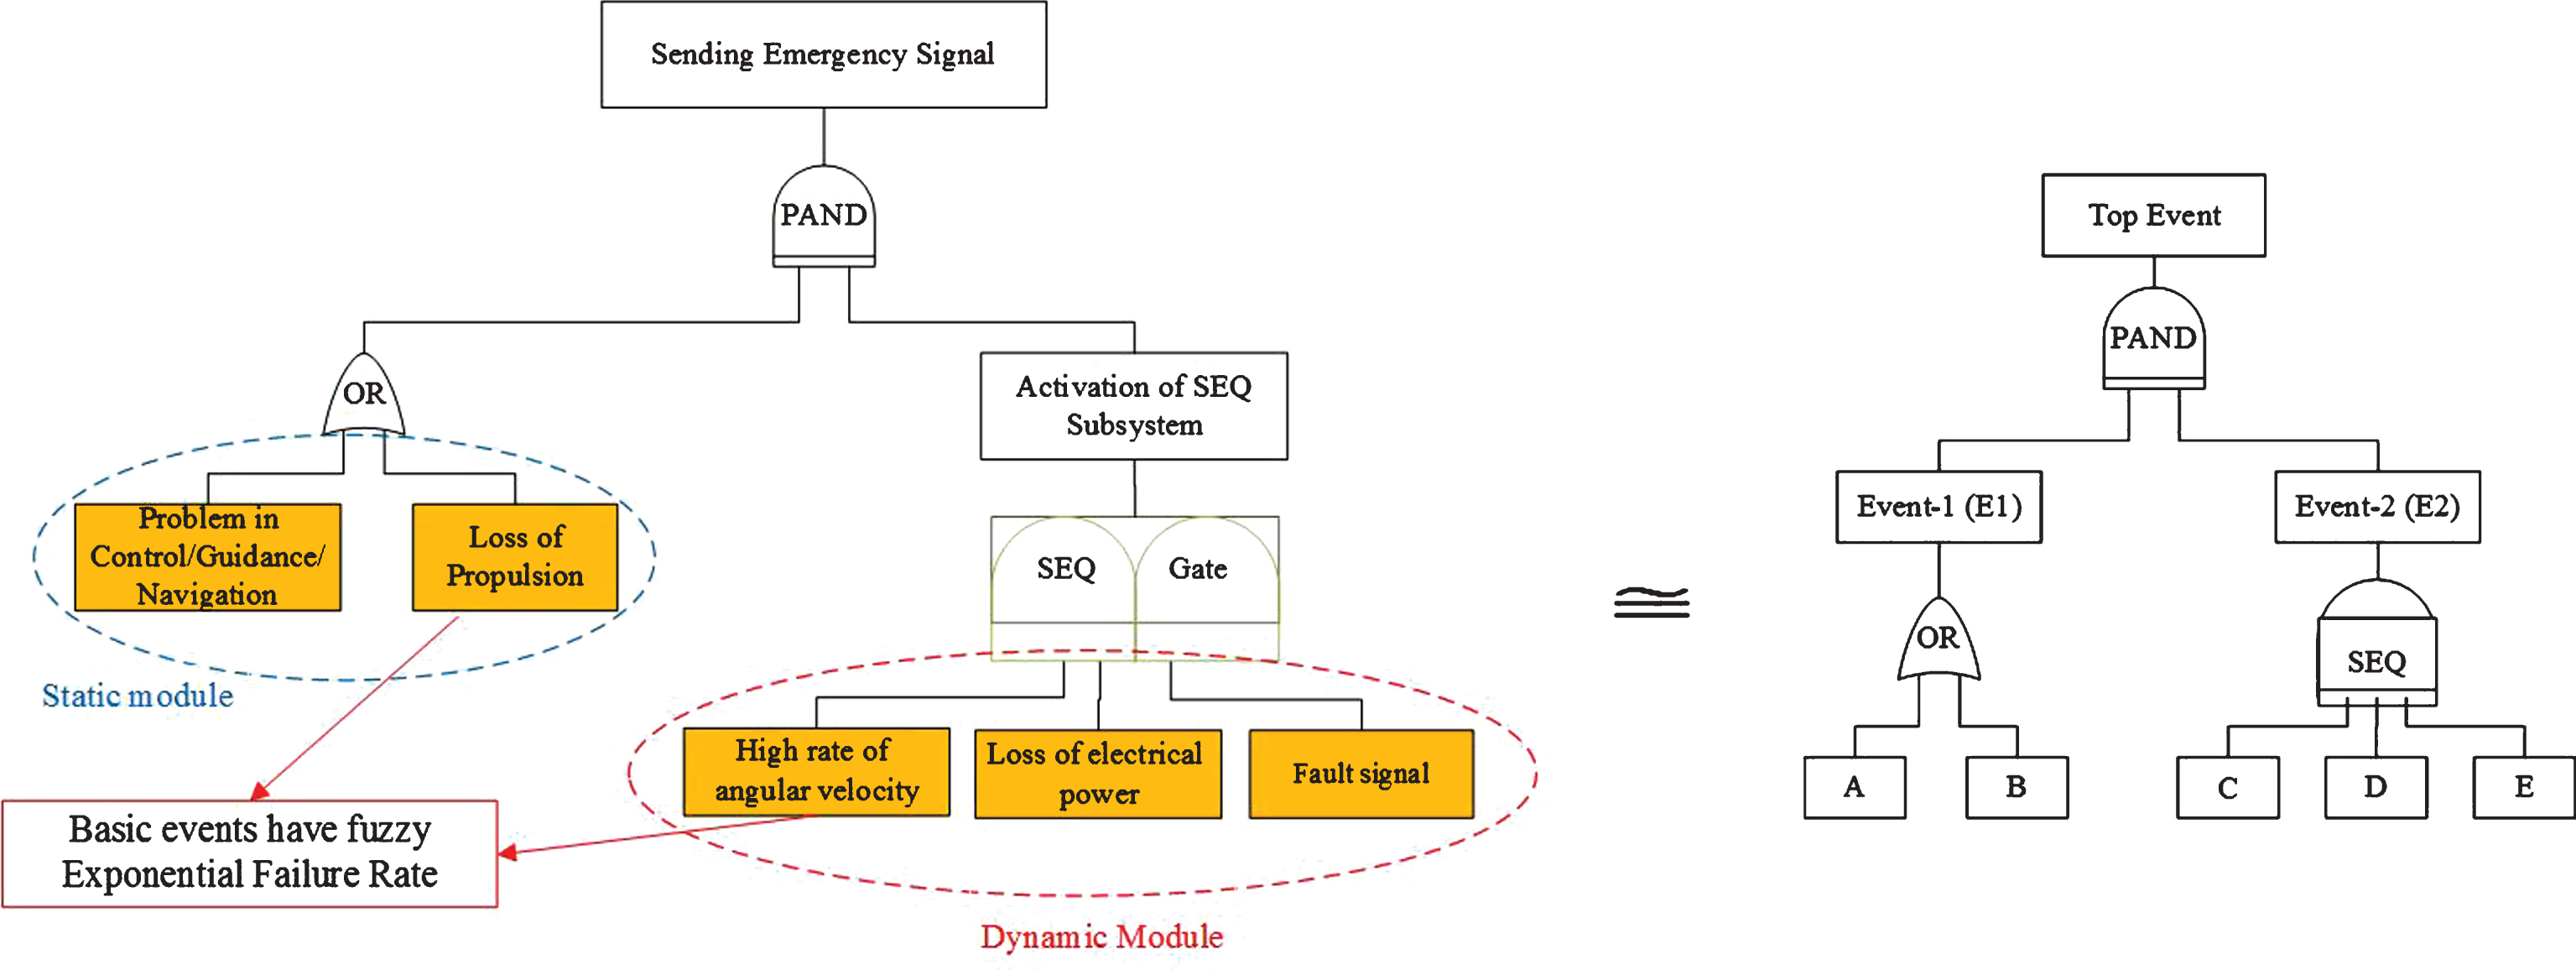
Dynamic Fault Tree of Emergency Detection System.
This DFT consist of “Sending Emergency Signal” Top event and contains two dynamic PAND and SEQ gates. The PAND gate in addition with two BEs has an event from SEQ output. The output of PAND gate occurs when all events occurred in a specified order (left to right). In addition, SEQ gate of DFT has three BEs that events in this gate occur with enforced sequenced order. The failure rate and corresponding density function for all of the components and basic events is fuzzy exponential distribution. Also, based on expert opinion and designer’s knowledge, basic events have λ BE = 49.9 × 10⁻⁶/h failure rate.
In reliability analysis, one of the main steps is to be able to dignity the failure probability of component, and for system consist of those components. As such, some particular criteria and mathematical schemas have been extended to delineate failure probability or reliability of systems. In this paper, computing the reliability of system is done based on events time to failure and using relations (connecting gates) between them. An analytical expression for thereliability of emergency detection system with priority and sequence enforcing of events can be derived by adding the reliability associated with the mutually exclusive events leading to system success. For simplicity, let us consider basic events in associated DFT have fuzzy exponential failure rates.
Since the Pr (τ
E
1
) = Pr (OR):
And similarly Pr (τ
E
2
) = Pr (SEQ), so we have
Thus, for the occurrence probability of Top event, we have:
The PAND system failure density function consist of one OR subtree and one SEQ subtree, is given by
The probability density function f τ SEQ (S) for the SEQ subtree, composed of three input components: C, D and E is f τ SEQ (S) = F C (S) + F D (S) + F E (S).
The second OR gate is in turn composed of two input components A and B, that failure distribution is given by f τ OR (r) = f A (r) R B (r) + R A (r) f B (r).
Hence, the reliability of EDS system is equal to {1- probability of failure}, so we have:
Assuming all the components have an exponential fuzzy failure distribution, we obtain
Where
Finally, we obtain
Demonstration of event failure distributions of EDS is depicted in Fig. 9 and consequently, generated failure rates using FTTF algorithm is demonstrated in Fig. 10.
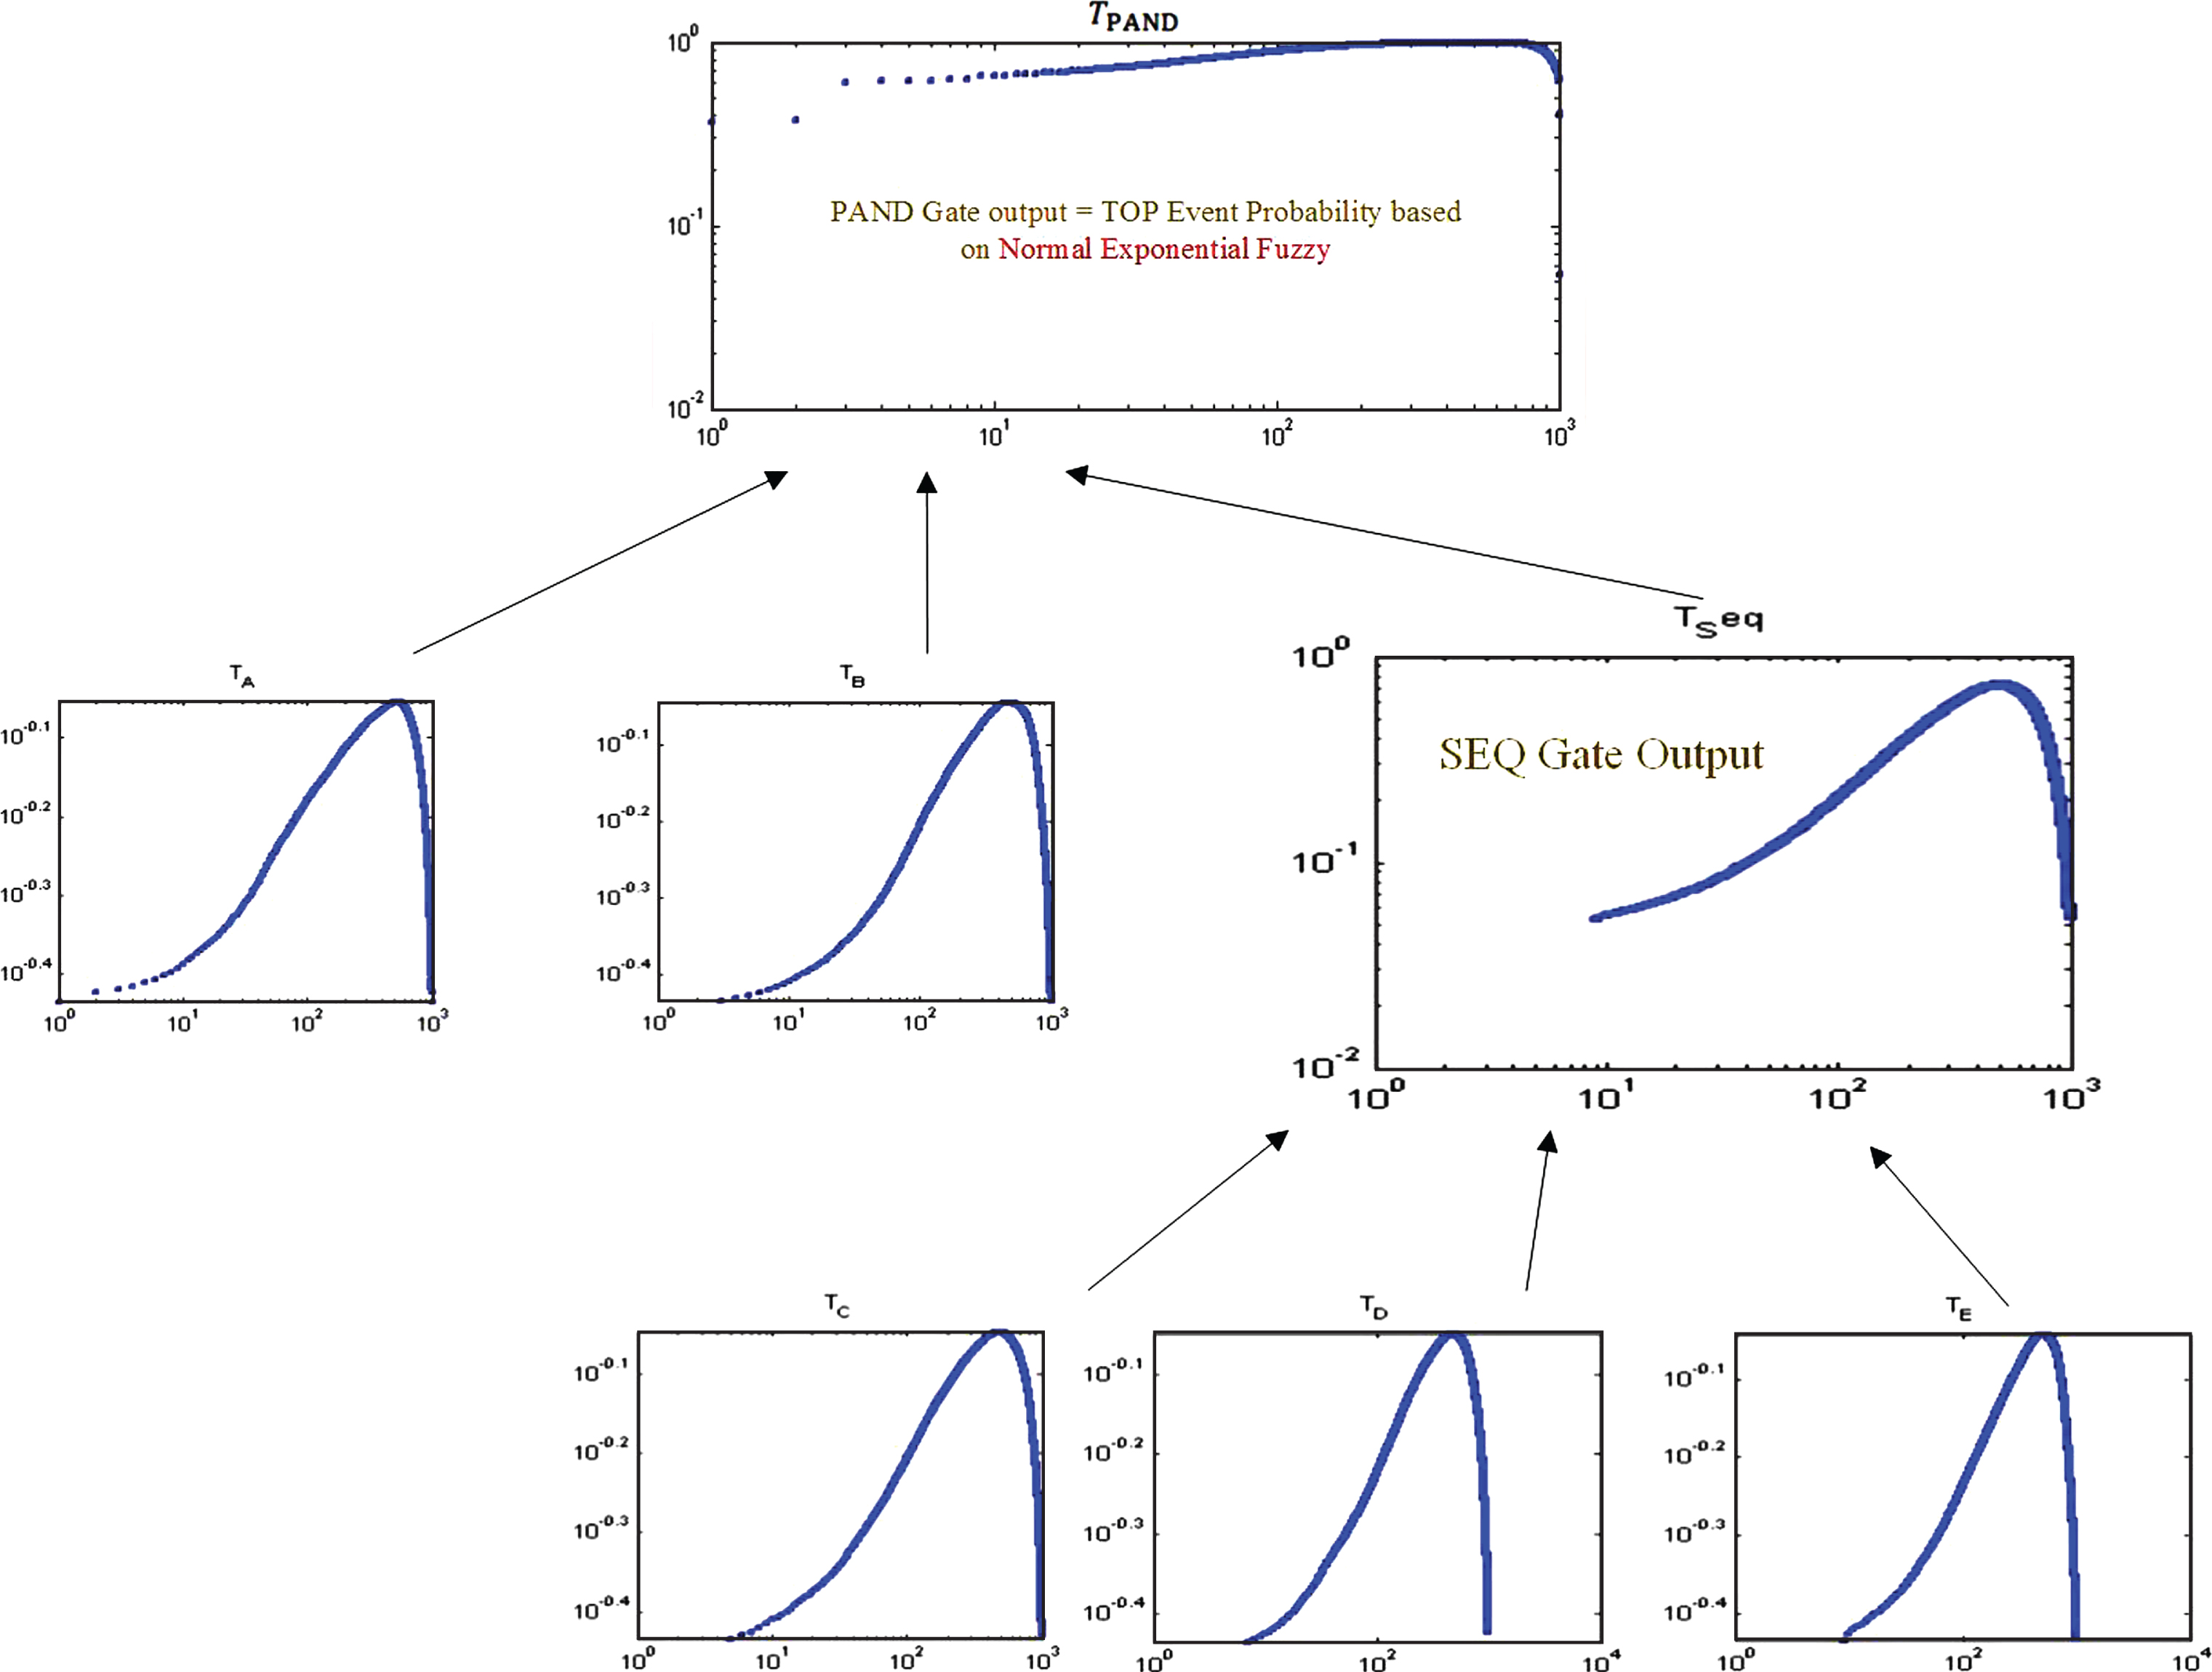
Event failure distributions of Emergency Detection System.

Generated Failure Rates using FTTF algorithm for Emergency Detection System.
In order to analyzing Possibilistic functions associated with the distributions for each basic event, a constructive and supple Quantitative based FT approach for reliability estimation of complex systems is presented based on Fuzzy Monte Carlo Simulation approach. Mathematically speaking, proposed approach presents integrate and multilateral framework and has less time consuming too. The modeling power of FT provides a versatile high-level modeling tool to express complex components dependencies and different behavioral modes. Likewise, the limitations on the analyzing of dynamic gates with common failure rates and probability density distributions are coped. This framework of modeling covers:
Static gates (AND, OR) Spare Gates Sequential failure gate Priority-AND (PAND) gate
In this framework, almost exact analytics for static and dynamic tree constructions is achievable. This method focuses on the quantitative part of fault trees (either static or dynamic) analysis and will compute failure probabilities. FTTF model is developed to estimate the reliability of system and solve aforetime methods problems. The presented FTTF model is able to figure out any construction consist of static and dynamic gates with FTTF distributions integrated on Monte Carlo Simulation (MCS) techniques to analyzing Possibilistic functions associated with the fuzzy probability distributions for each basic event. Using fuzzy algorithm, gates FTTF are generated, and Top-event TTF evaluated. Some case studies are used to demonstrate the priority of this method in exact evaluation in compared with other solving methods (like: BN, Analytical solution, Markov chain and traditional fuzzy fault tree modeling), but has much less effort while having higher accuracy. Finally, this model is implemented in an Emergency Detection System (EDS) which is a useful system in aerospace and space applications and the results show that this approach is a promising technique to improve the reliability analysis of a system with unknown failure occurrence probabilities of components. In the future work, we will extend the Fuzzy Time-To-Failure based approach over the lifetime of components. Since, it shows changes in the probability of failure. In addition, we will investigate event’s failure region attributes in order to real-lifeestimation.