
Abstract
The existing fuzzy data envelopment analysis (DEA) models for evaluating the relative efficiencies of a set of entities called decision making units (DMUs) converting multiple fuzzy inputs into multiple fuzzy outputs are limited to convex and normal fuzzy data, moreover, the constraint condition consists of the evaluated DMUs, and efficiency is evaluated through transforming the fuzzy DEA model into the crisp DEA model by applying an alternative α-cut technique. However, in many practical evaluation problems, the fuzzy data of inputs and outputs may be non-convex or abnormal, and the evaluated DMU may not be contrasted with the DMUs under evaluation, but with sample standards determined by production strategy. In such a case, the notion of restricted fuzzy set is proposed. The constraint condition is extended to a more general form, i.e., the constraint condition, in which the sample DMUs have similar behaviors, consists of one of sample standards determined by production strategy. The basic idea is to transform the fuzzy DEA model to the conventional DEA model by applying the formula of center of mass, and the relationship between the production frontier and fuzzy DEA efficiency is given. To reduce the computational load, an algorithm based on the golden section method is employed to locate the standard that the evaluated DMU best fits. Finally, a numerical example is provided to illustrate the proposed model.
Keywords
Introduction
In conventional data envelopment analysis (DEA) models, such as C2R model named after Charnes et al. [9] and BC2 model proposed by Banker et al. [6], the inputs and outputs are assumed to be precise. In addition, the constraint condition consists of the evaluated decision making units (DMUs).
In many real world applications involving performance measurement, inputs and outputs may be imprecise and fluctuated. Until now, there are many imprecise DEA literature, such as [30] and [31]. What we focus on in this paper are the fuzzy DEA models [5, 33], in which the data of inputs and outputs are expressed by fuzzy data, and the fuzzy data are convex and normal, efficiencies are evaluated through transforming the fuzzy DEA models into crisp DEA models by applying an alternative α-cut technique. For example, Kao and Liu [19] applied the α-cuts and Zadeh’s extension principle to transform the fuzzy DEA model to a series of conventional crisp DEA models. Without loss of generality, they assumed that all observations are fuzzy numbers which can be expressed by degenerated membership functions. Based on the fundamental C2R model, Guo and Tanaka [16] represented fluctuating data as linguistic variables characterized by symmetric triangular fuzzy numbers for reflecting a kind of general feeling or experience of experts. Moreover, different efficiencies were provided in different h-levels and parameter t, and center efficiency value was first proposed in the paper. Soon afterwards, León et al. [22] introduced LR–fuzzy numbers to express the data of production processes which cannot be precisely measured, and then developed some fuzzy versions of the classical DEA models by using some ranking methods based on the comparison of α-cuts. In 2005, Wang et al. [29] developed a new pair of interval DEA models for evaluating the efficiency of DMUs with ordinal preference information and/or fuzzy data, what is more, fuzzy data would be transformed into interval data by using the α-level set. A few years later, Jahanshahloo et al. [18] studied fuzzy DEA model by using a generalized L-R fuzzy number, and proposed a ranking method with l1-norm. Khoshfetrat and Daneshvar [20] proposed fuzzy C2R model with the lower bounds of fuzzy data for inputs and outputs, and the weak efficiency frontiers of the corresponding production possibility set were improved. In the following year, Angiz et al. [2] introduced an alternative linear programming model, in which some uncertainty information with the α-cut approach was included. In the next few years, Azadi et al. [4] developed an integrated DEA enhanced Russell measure (ERM) model in fuzzy context to select the best sustainable suppliers, and the fuzzy integrated DEA model is converted into the standard linear programming (LP) by α-cut technique.
Traditionally, the constraint condition consists of the evaluated DMUs. For instance, as extremely common DEA models, the C2R model [9] and BC2 model [6] suppose that the constraint condition consists of all the evaluated DMUs. Andersen and Petersen [1] extended DEA model which allowed for ranking efficient units, and the extended DEA model was identical to the BC2 model, except that the evaluated DMU was not included in the constraint condition.
However, in a practical evaluation problem the fuzzy data may be non-convex or abnormal. Moreover, it may be unreasonable to evaluate the DMUs by constraint condition which consists of the evaluated DMUs. For example, in the evaluation of travel agencies, the customer satisfaction is regarded as one of the output measures. It is common sense that the customer satisfaction is obtained by the degrees of satisfaction of customers in different age groups, and it maybe a fuzzy set which is non-convex and abnormal as shown in Fig. 1. Travel agencies from the same region can be evaluated by the evaluation standard which consists of all the evaluated travel agencies. However, travel agencies from different regions should not be directly evaluated by the same evaluation standard because of regional disparities, and the evaluation standards should be determined by the regional factors. Take outbound tourism as an example, it is an important part for travel agency business of developed regions, but it may be not contained in the travel agency business of the lagging regions. Clearly, it is unreasonable that the outbound tourism is included as an input measure to evaluate the travel agencies from different regions. Therefore, it is worth considering to evaluate the production efficiency of DMUs with fuzzy inputs and outputs by determined evaluated standards in this setting.
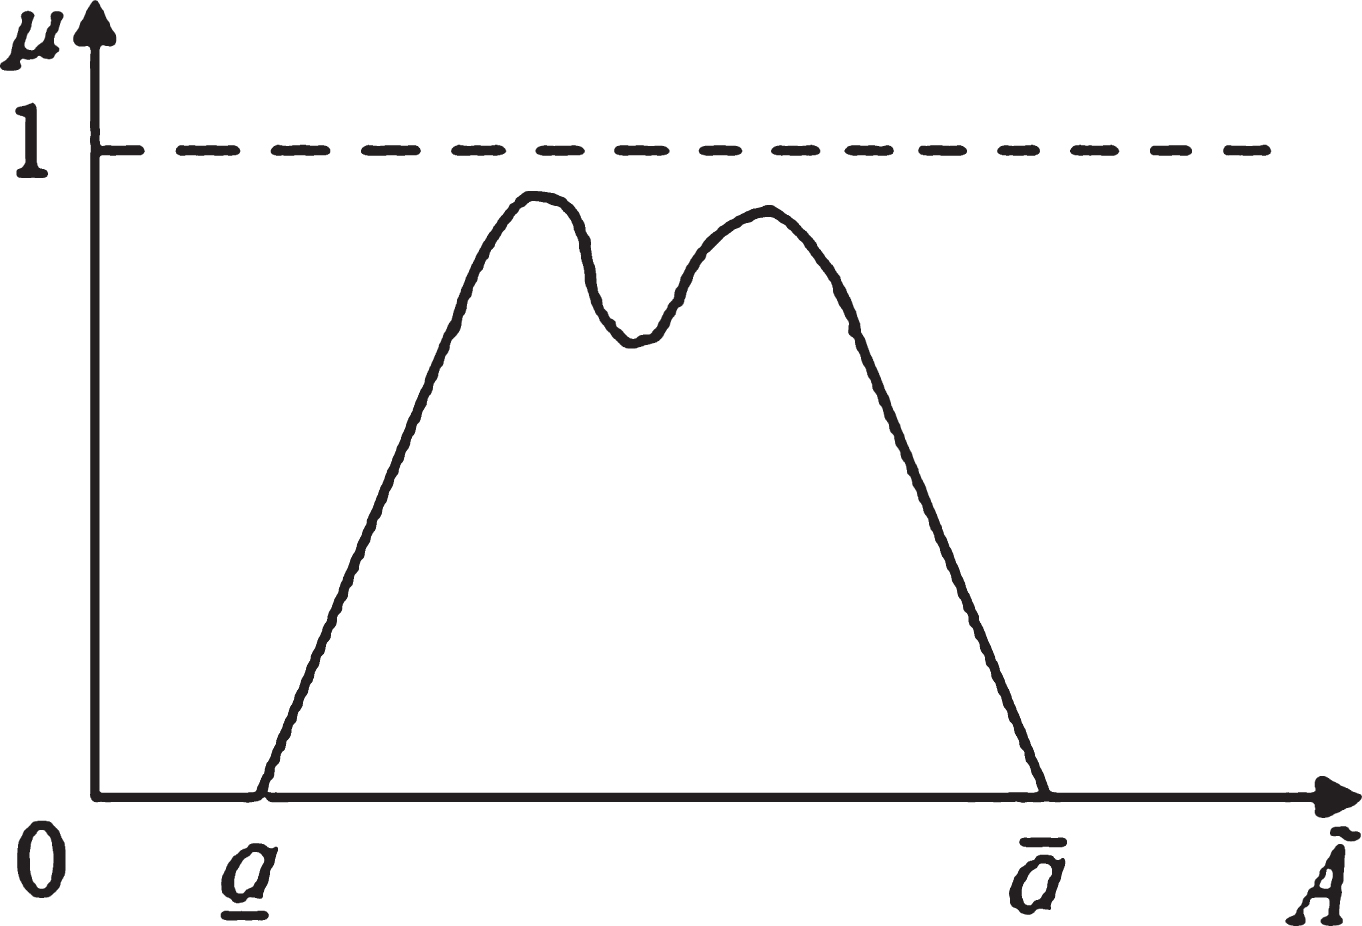
The non-convex and abnormal fuzzy set.
The paper is unfolded as follows. Section 2 introduces the C2R model, and fuzzy data, respectively. In Section 3, the notion of restricted fuzzy set is given, and a generalized fuzzy DEA model with determined standards is proposed. Section 4 expounds the relationship between the production frontier and fuzzy DEA efficiency. In Section 5, the algorithm to determine standards is described. In Section 6, a numerical experiment is given to illustrate the proposed model. At the end of the paper some conclusions are drawn.
In this section, we briefly review C2R model and fuzzy data.
C2R model
As an extremely common DEA model, the C2R [9] model supposes that there are n DMUs, each DMU consumes the same input type and produces the same output type. Let m, r be the numbers of inputs and outputs, and all inputs and outputs are assumed to be positive. The multiple inputs and outputs of each DMU are aggregated into a single virtual input and a single virtual output. The efficiency of the evaluated DMU is obtained as a ratio of its virtual output to its virtual input subject to the condition in which the ratio for each DMU is not greater than 1. The corresponding model is as follows:
The optimal objective values of
Let X be a classical set of objects, called the universe, whose generic elements are denoted by x. The membership in a crisp subset of X is often viewed as characteristic function μ
F
from X to {0, 1} such that:
The lower and upper points of any α-cut,
The generalized fuzzy DEA model with the restricted fuzzy set
The restricted fuzzy set
In the most existing fuzzy DEA models, the input and output are expressed by convex and normal fuzzy data, and efficiencies are evaluated through transforming the fuzzy DEA models into crisp DEA models by applying cut set. However, in practice, the fuzzy data may be non-convex or abnormal. In such a case, a restricted fuzzy set is given to express the uncertain data, and the definition is as follows.
The restricted fuzzy set
In this paper, the data of inputs and outputs are expressed by restricted fuzzy sets. In many real applications, the restricted fuzzy sets of inputs and outputs may be non-convex or abnormal, then the efficiency evaluation will be unsolvable by the existing methods. In such a case, we introduce the center of mass in the proposed model to evaluate DMUs. The following is a summary of the formula of the center of mass.
The graph (i.e., the curve l) of function y = f (x) is a smooth curve, x ∈ Ω, and ρ (x) is a density function of the curve l, then the center of mass X of the curve l in the x axis is as following.
As the membership function (i.e., μ (t), t belongs to the support of the restricted fuzzy set) is continuous, then μ (t) is integral, and the center of mass of
In this section, a generalized fuzzy DEA model is proposed. In the model, input and output data are expressed by restricted fuzzy sets. The formula of center of mass (3) is introduced into the model to deal with restricted fuzzy sets. There are many sample DMUs, and the sample DMUs are divided into several ordered sample standards by manufacturing strategy. Constraint condition consists of one of sample standards.
It should be noted that the evaluated DMU does not belong in the constraint condition. There are
The model (4) is equivalent to the linear programming model (5). In the model (5), ω = {ω1, ⋯ , ω
m
} and
The relationship between fuzzy DEA efficiency and the optimal objective value can be obtained as follows.
To better show the relationship between the production frontier and DEA efficiency, we consider the case of two inputs and one output. Note that DEA efficiency is independent of the changes of inputs and output by the same proportion, then we change the inputs and output in the same proportion for each DMU until the output data of all DMUs are equal. Next, the coordinate system is established with input 1 and input 2 as the x and y coordinate axes. For the DMU in the coordinate system, the closer it gets to the coordinate origin, the higher efficiency will be.
The relationship in the conventional DEA model
In the conventional DEA model, efficient DMUs are located on the production frontier, weak efficient DMUs are located on the weak production frontier, and other DMUs are located in the production possibility set [10]. As shown in Fig. 2, we can see that DMU A, B and C are DEA efficient, DMU D is weak efficient, and DMU E is DEA inefficient.
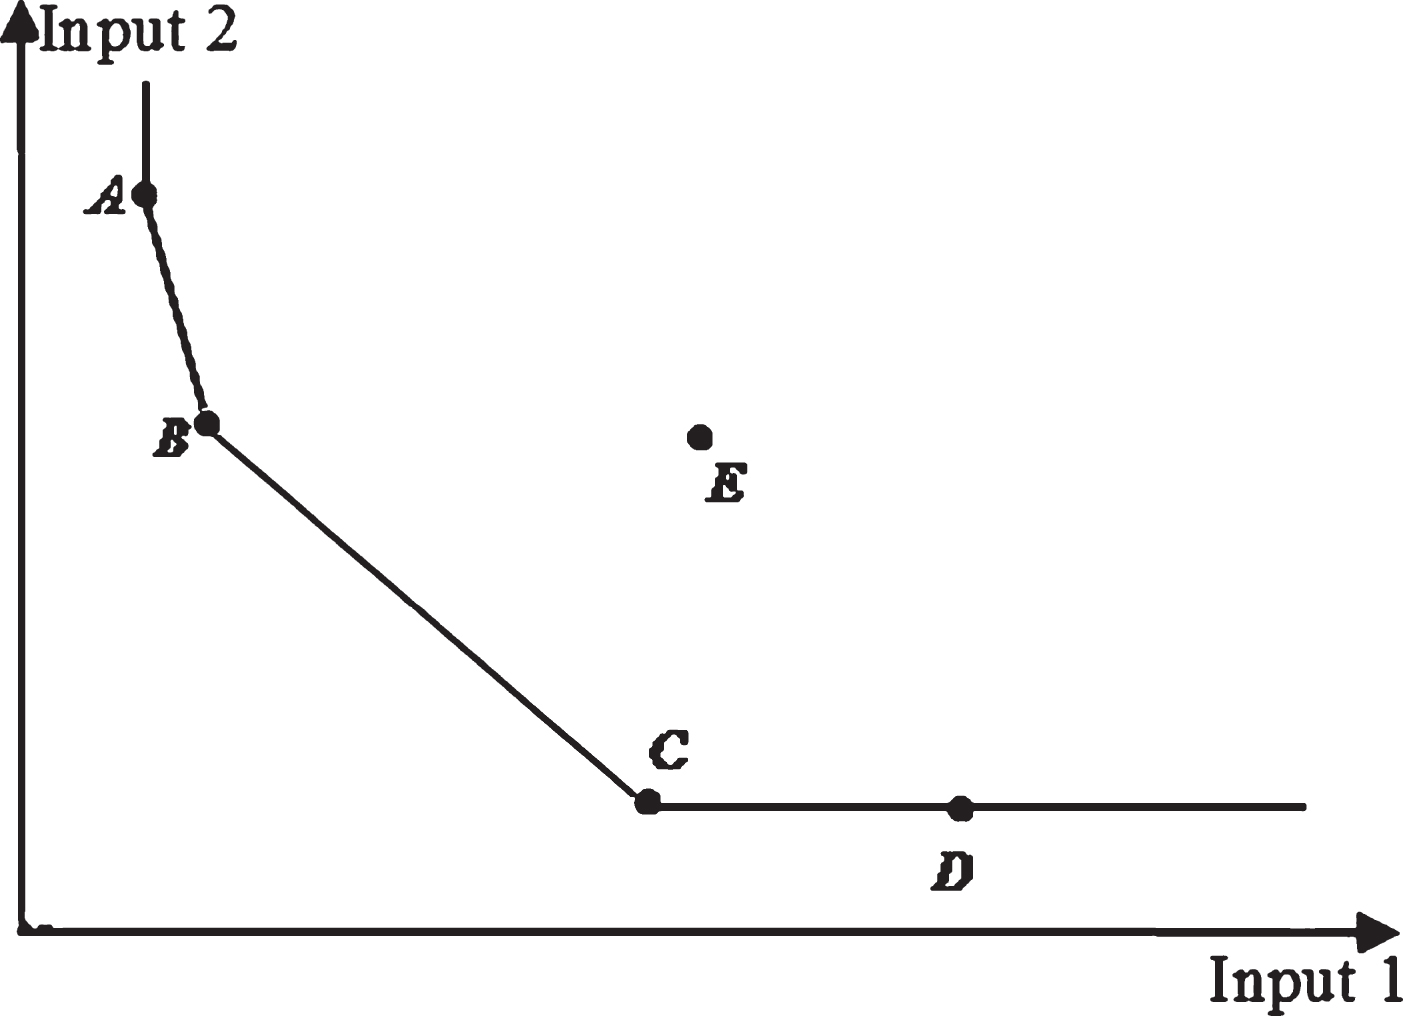
The relationship in the conventional DEA model.
In the proposed DEA model, the evaluated DMU does not belong in the constraint condition. The constraint condition consists of one of the sample standards determined by production strategy, and the production frontier is spanned by sample DMUs from the constraint condition. In order to illustrate the relationship between the production frontier and fuzzy DEA efficiency, now we suppose that there are three evaluated DMUs E1 - E3, and the constraint condition consists of the k-th standard with twenty sample DMUs S1 - S20. As shown in Fig. 3, the dots (•) denote the centers of mass of DMUs, the most and least efficient production frontier are shown by solid lines. The production frontier of sample DMUs S1 - S20 is shown in the shaded portion, we can see that the most efficient production frontier is spanned by sample DMUs S4 - S7, the least efficient production frontier consists of sample DMUs S10 - S12, and the other production frontiers that consist ofdifferent combinations of sample DMUs S1 - S20 are located between the most and least efficient production frontiers.
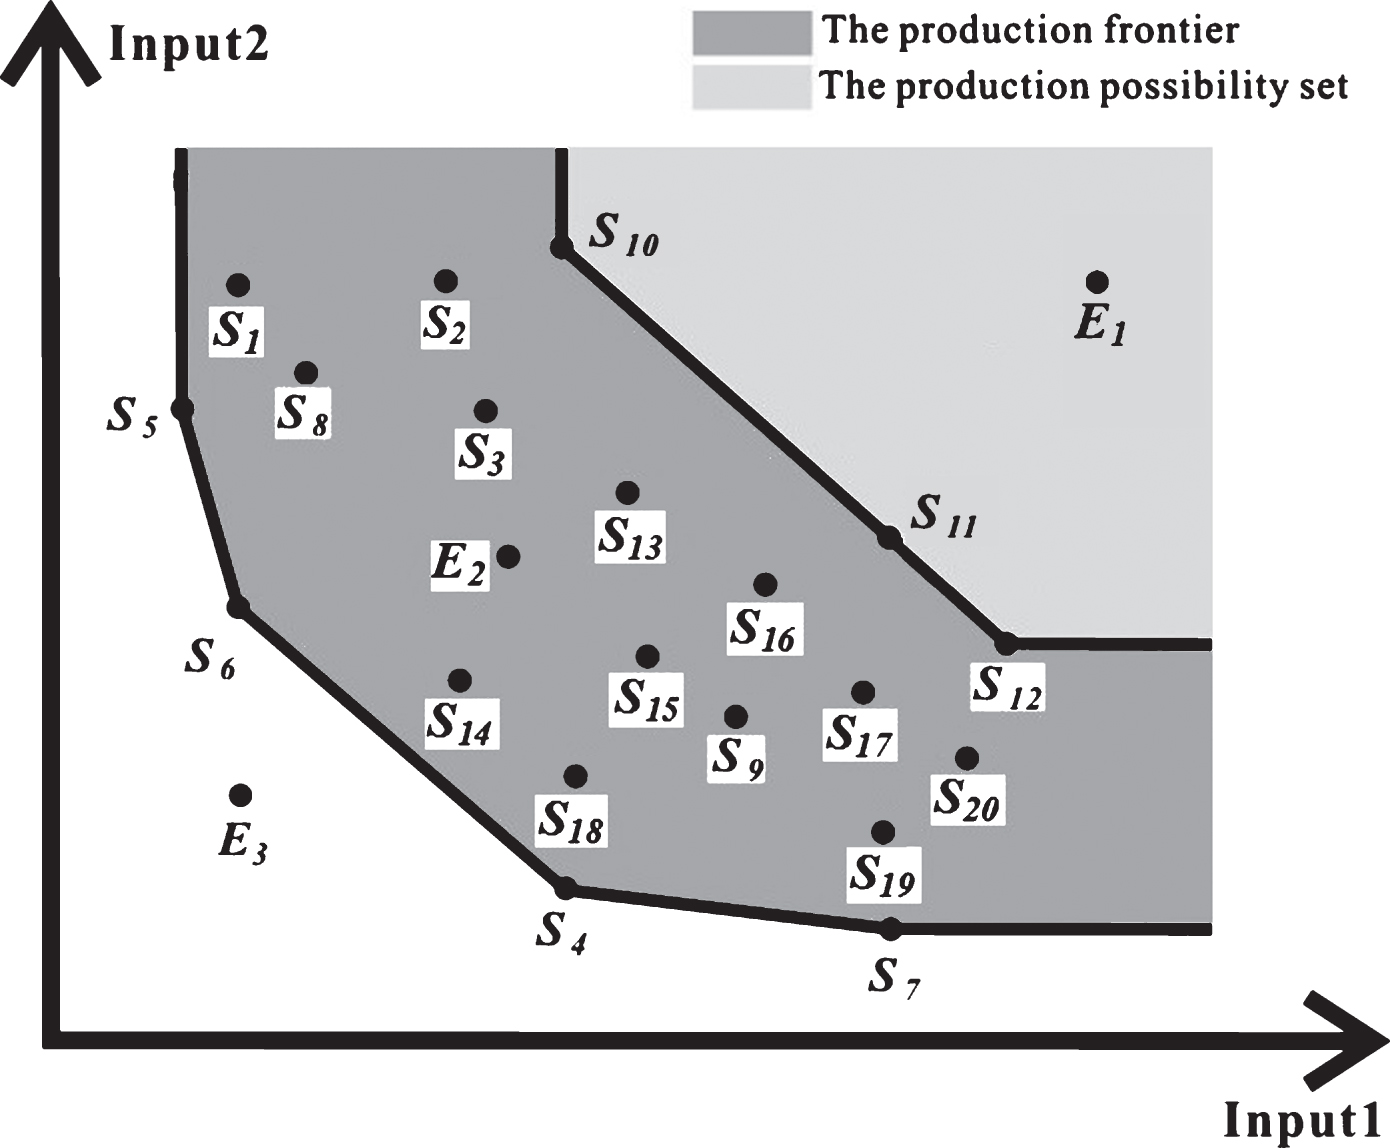
The production frontier and fuzzy DEA efficiency in the proposed model.
The evaluated DMU E3 is closer to the coordinate origin than the most efficient production frontier, then the efficiency of DMU E3 is higher than that of constraint condition, and the evaluated DMU E3 is fuzzy DEA super-efficient. The evaluated DMUs, which are located between the most and least efficient production frontiers, are fuzzy DEA efficient. For example, the evaluated DMUs E2 is fuzzy DEA efficient. The evaluated DMU E1 is located in the production possibility set of the least efficient production frontier, and then DMU E1 is DEA inefficient.
In the proposed model, there are many ordered standards determined by production strategy, and each standard corresponds to a constraint condition. The proposed model not only evaluate the efficiency of the evaluated DMU, but also locate the standard with which the evaluated DMU has similar behavior. If we locate the standard individually, there will be a large calculating quantity. In order to reduce calculation burden and quickly locate the standard, the golden section method [3] is introduced in this section. For convenience, we define
Let [x] denote the greatest integer which is not greater than x, α = 0.618 is the golden ratio conjugate. The algorithm is summarized as follows:
If F (s1) =0 (or F (s2) =0), then
Stop — DMU E is located in the s1-th (or s2-th) sample standard;
If F (s1) F (s2) >0, F (s1) >0, then
DMU E is fuzzy DEA super-efficient for all the standards;
If F (s1) F (s2) >0, F (s1) <0, then
DMU E is fuzzy DEA inefficient for all the standards;
If F (s1) F (s2) <0, then
Turn to Step 2.
If F (s1) F (s3) >0, then
s1 ← s3;
If F (s1) F (s3) <0, then
s2 ← s3;
If F (s3) =0, then
Stop — DMU E is located in the s3-th sample standard.
Else turn to Step 2.
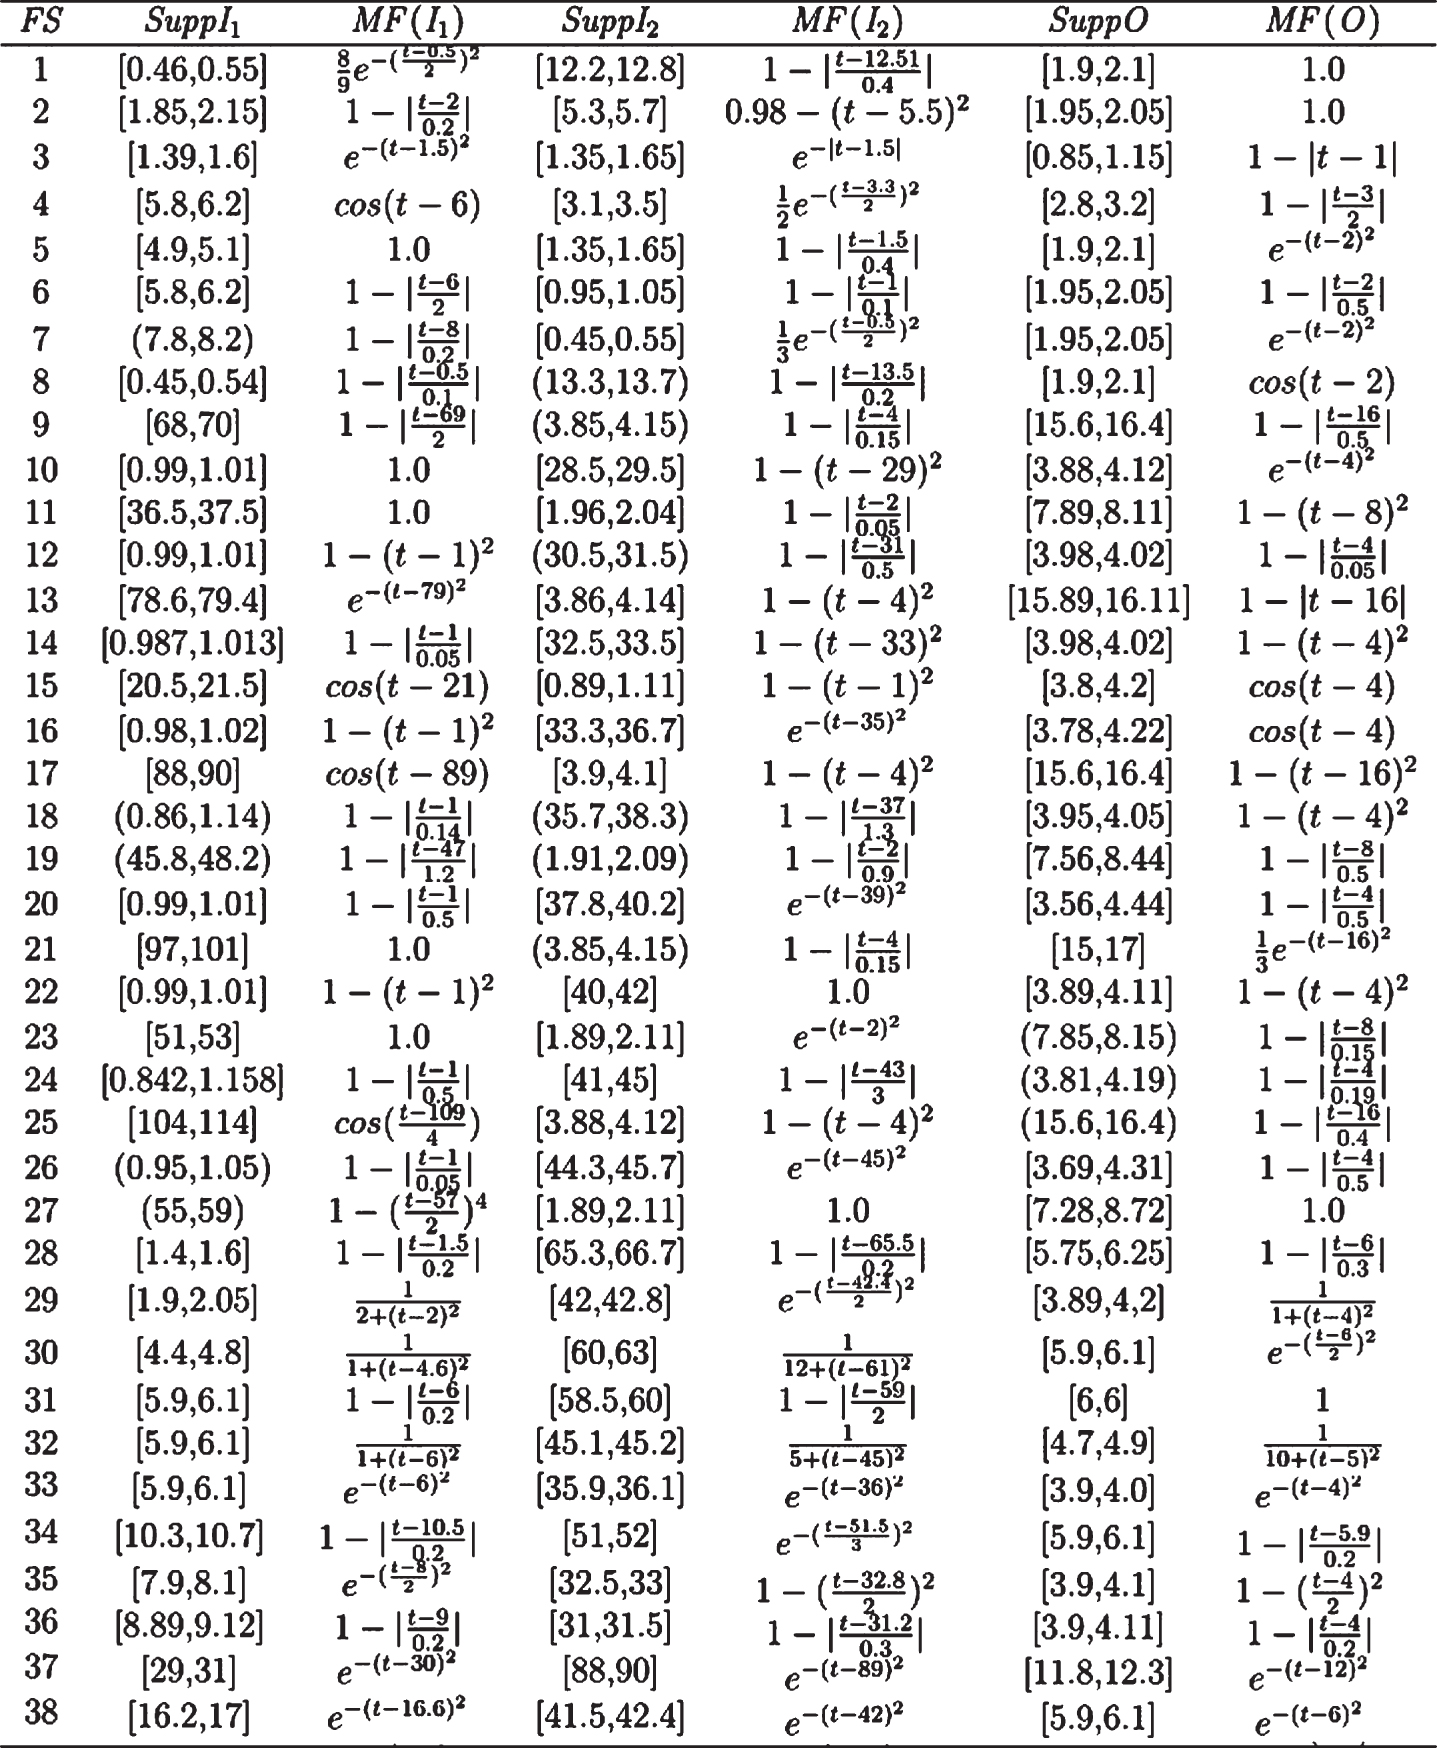
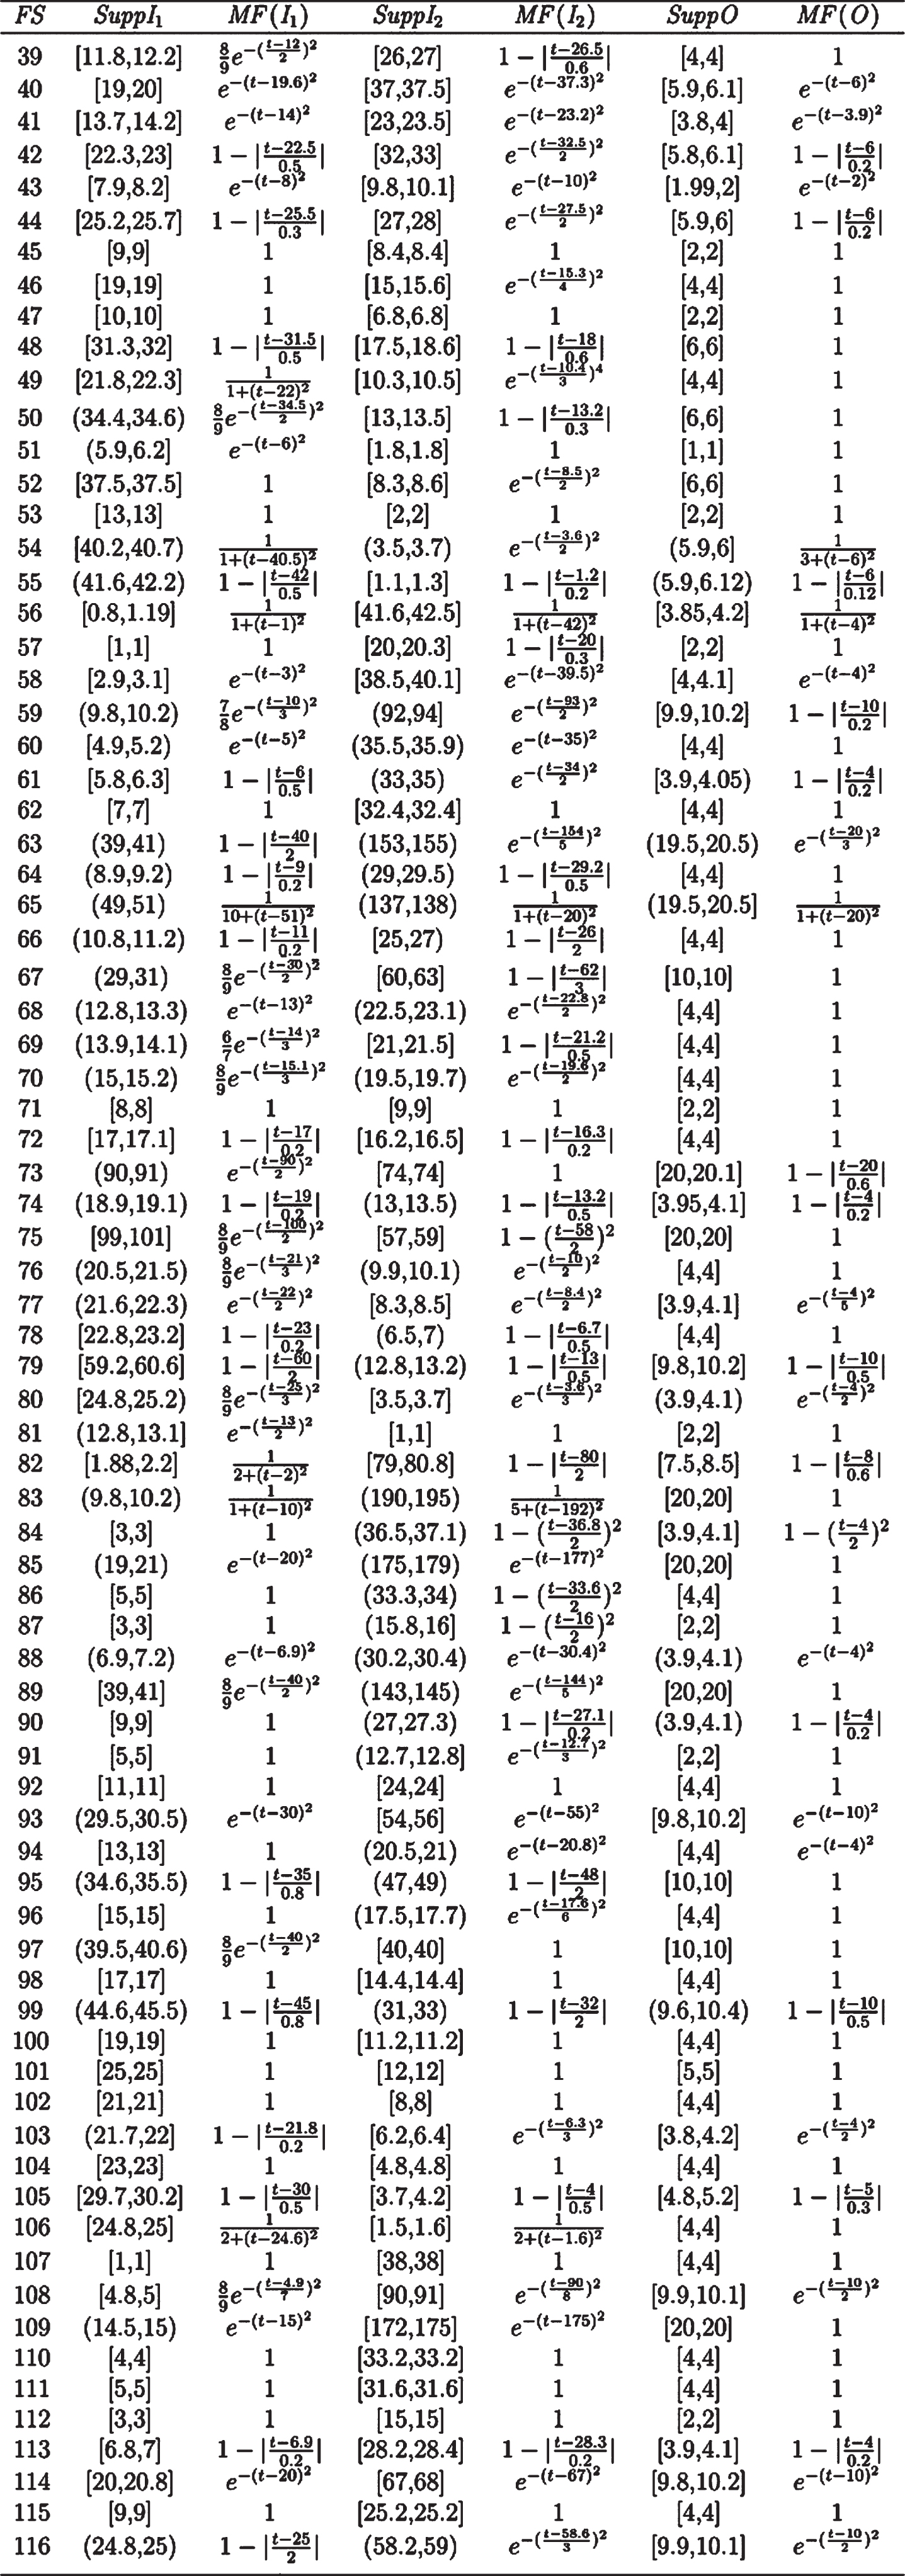
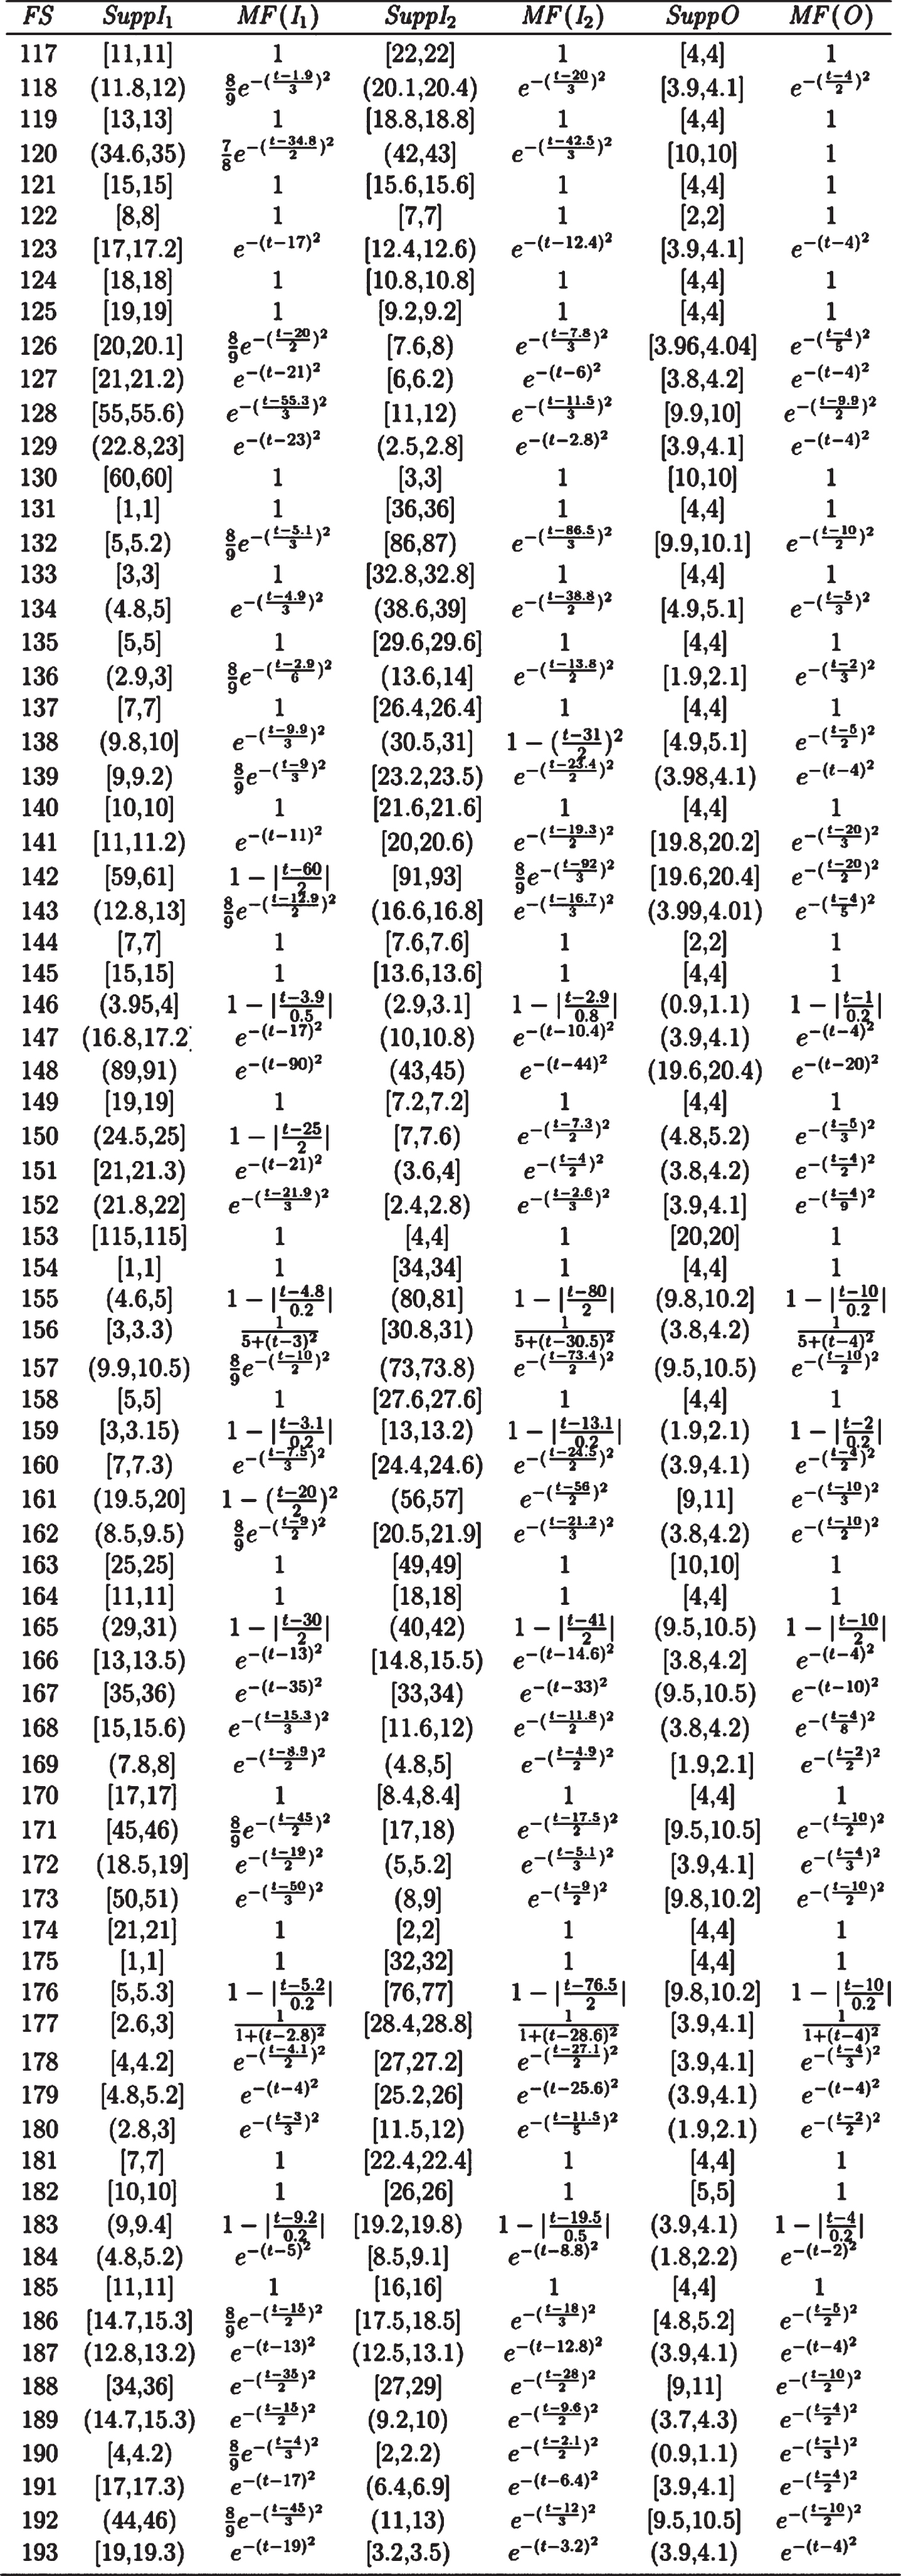
In this section, a numerical experiment is given to illustrate the proposed model. For simplicity, Input i, Output j and membership function will be abbreviated to I i , O j , and MF, respectively. Moreover, MF(I i ) and MF(O j ) denote the membership functions of Input i and Output j. The term FS k is an abbreviation for sample DMU k .
In the example, there are 248 sample DMUs with two fuzzy inputs and a single fuzzy output illustrated in the Appendix. Sample standards consist of sample DMUs according to the production strategy. The fuzzy inputs and output of the evaluated DMU are listed in Table 1. The evaluation process of the evaluated DMU is as follows.
The supports and membership functions of the evaluated DMU
The supports and membership functions of the evaluated DMU

In the Appendix, there are some membership functions which are non-convex, and their maximal degrees of membership are less than 1, such as the Input 2 of sample DMU 2. What is more, the maxima of membership functions of the fuzzy inputs and fuzzy output are unequal. In the most existing fuzzy DEA models, the fuzzy inputs and outputs are convex and normal, efficiencies of DMUs are evaluated through transforming the fuzzy DEA models into crisp DEA models by applying cut set. So it is impossible to divide the sample DMUs into ordered standards by these fuzzy DEA models.
In this section, we change the inputs and output of every sample DMU in the same proportion until all the centers of mass of output data for all the sample DMUs are equal to 4, then establish the coordinate system with input 1 and input 2 as the x and y coordinate axes (see Fig. 4). The dots (•) denote the centers of mass of corresponding sample DMUs with the same output.
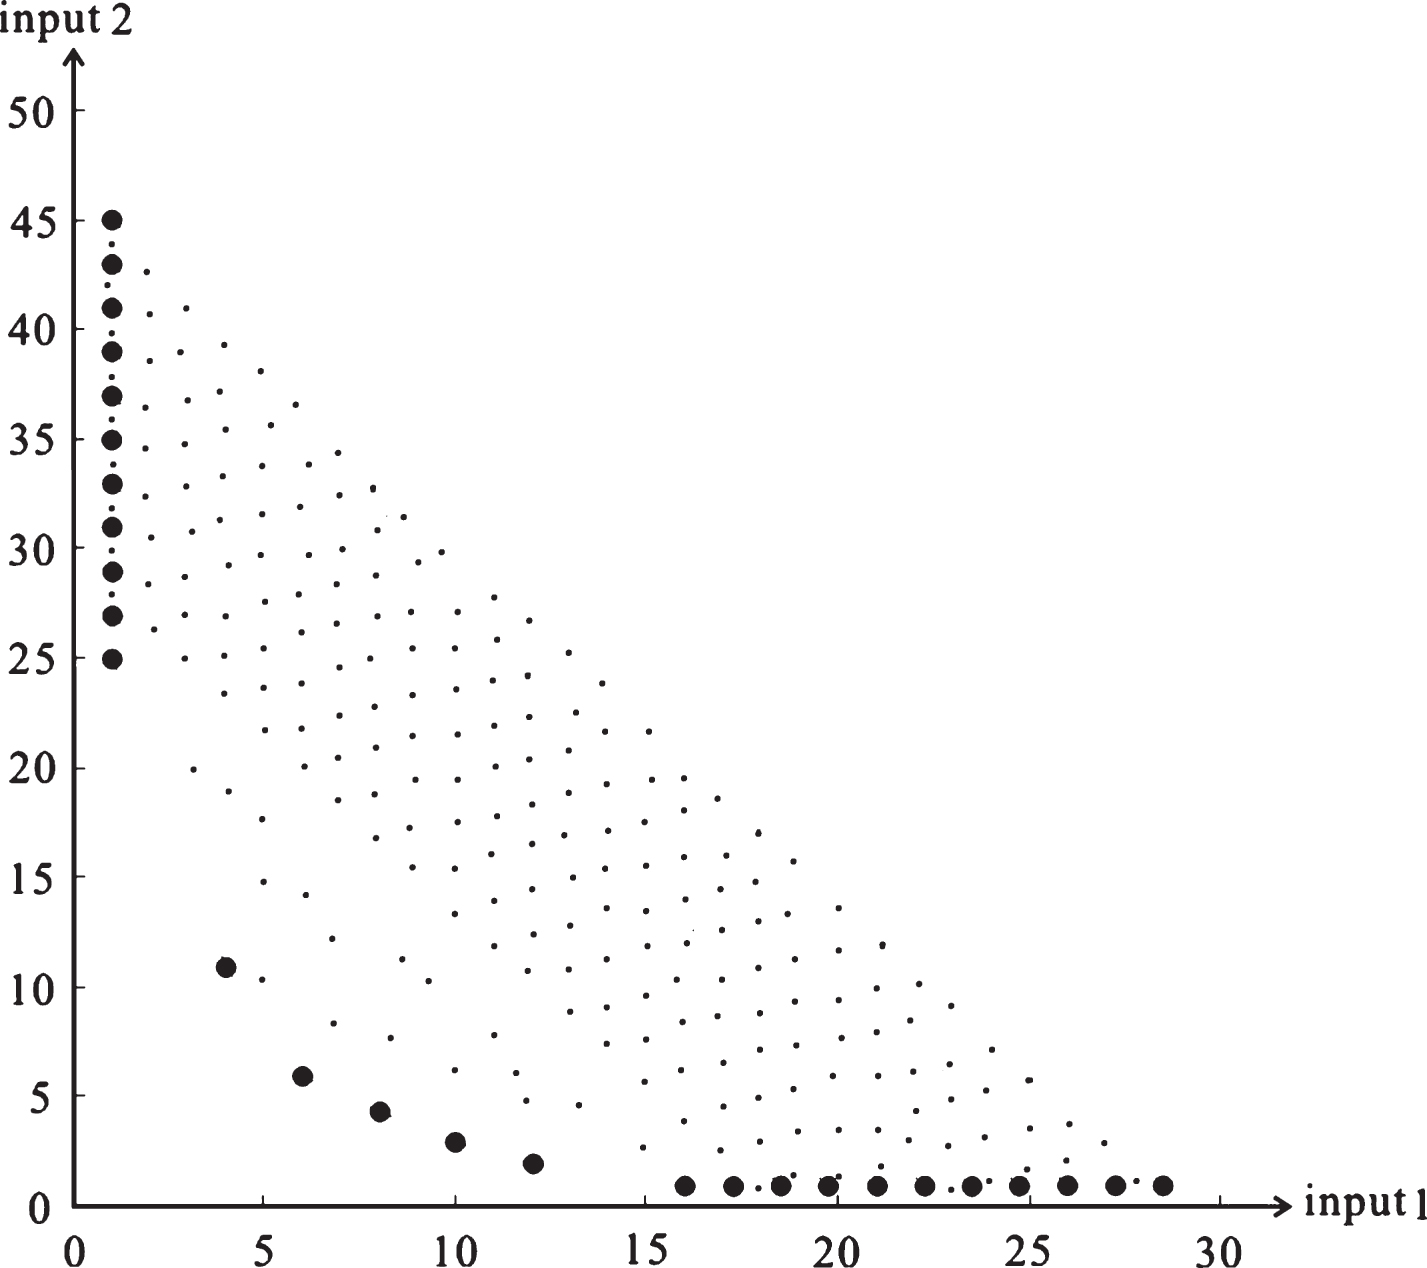
The production status of sample DMUs with the same output.
Subsequently, the sample DMUs are divided into ordered standards according to the following criteria: In the Fig. 4, the closer the sample DMU to the coordinate origin, the higher production efficiency will be; Each sample DMU belongs to the standard with the nearest mean.
By using the clustering method [28], results are shown in Fig. 5 and Table 2. We can see that the sample DMUs are divided into 12 ordered standards with a gradual increase in production efficiency. Note that there are too many sample DMUs, thus we just label the significant sample DMUs.
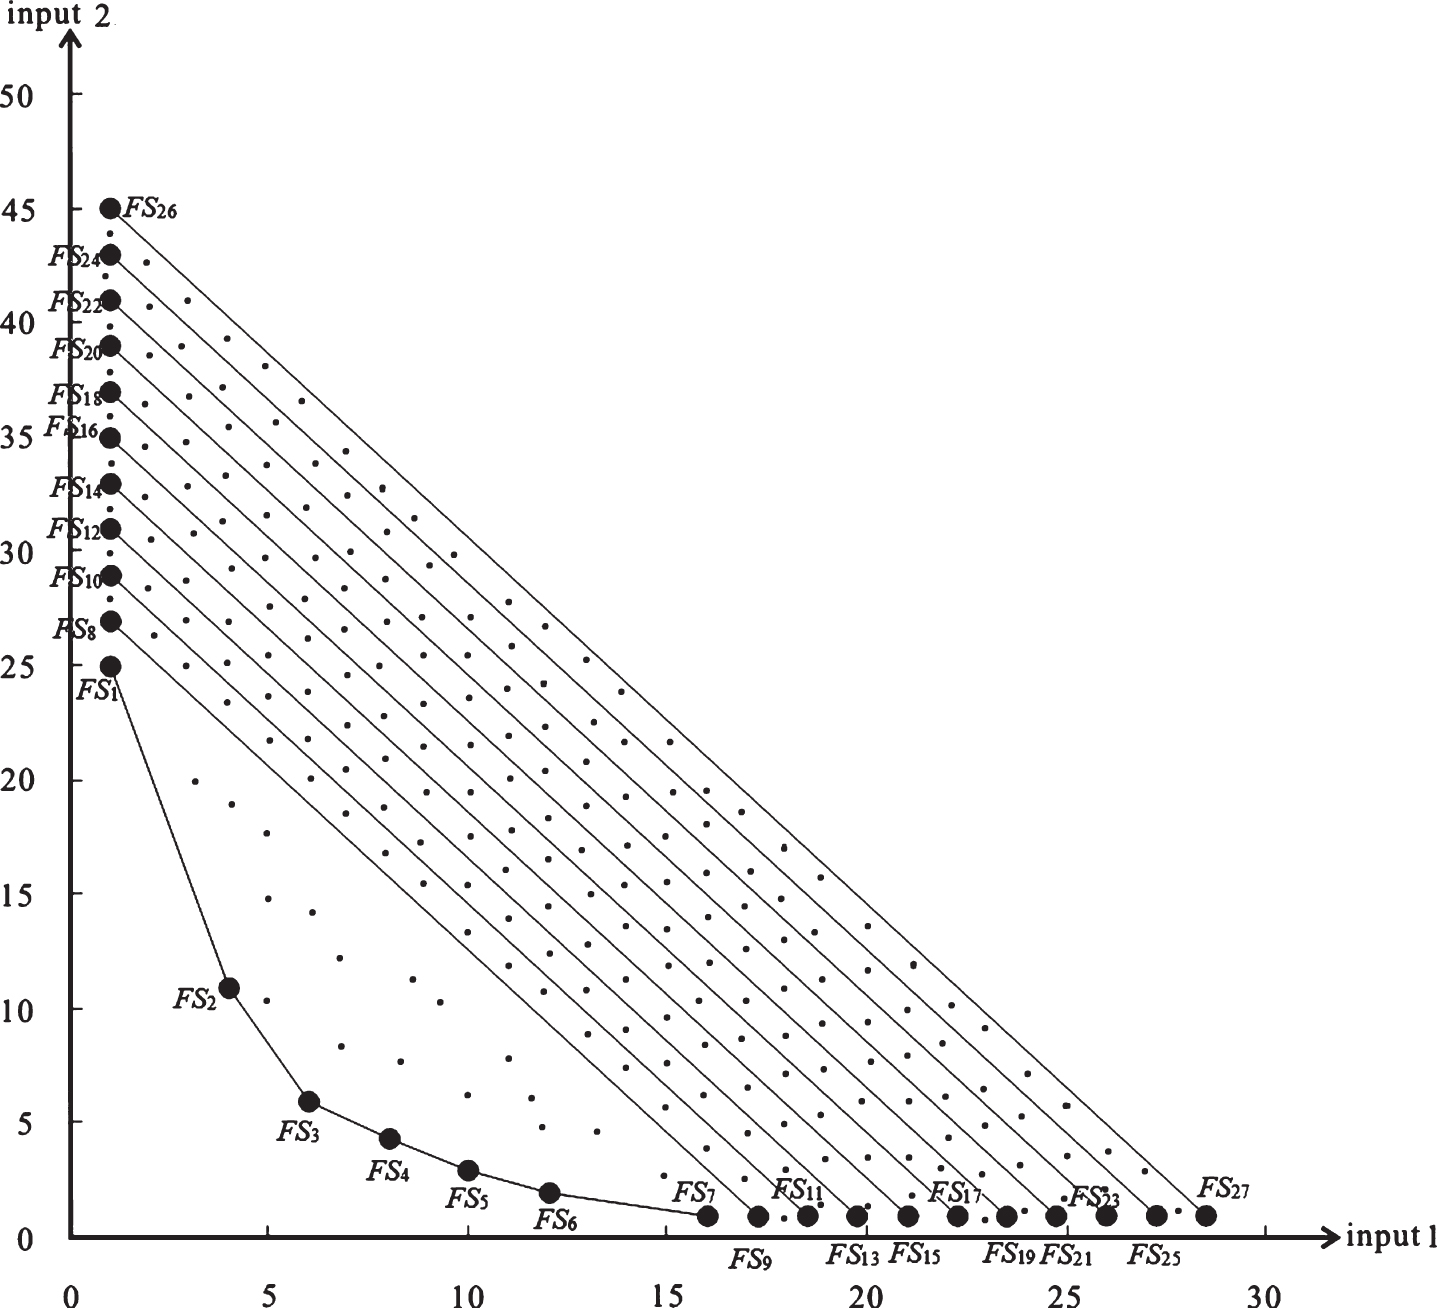
The sample standards.
The sample standards

Since the supports of fuzzy data are intervals, and the membership functions are continuous on their supports. The efficiency of the evaluated DMU can be evaluated by Model (5), and the processes and fuzzy production efficiency are obtained and shown in Tables 3 and 4.
The process of determining the standard for the evaluated DMU
The process of determining the standard for the evaluated DMU

The fuzzy production efficiency of the evaluated DMU
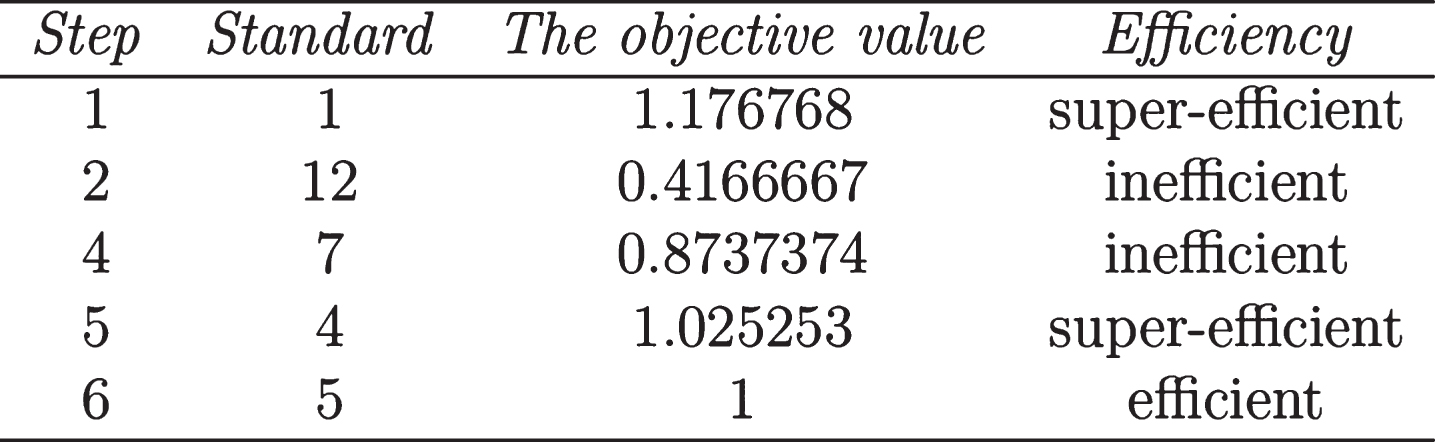
The results can be interpreted in the following way. In the first step, the 1st and 12-th standards are selected to evaluate the evaluated DMU (i.e. s1 = 1, s2 = 12), the optimal objective value of the s1-th standard is 1.176768, the optimal objective value of the s2-th standard is 0.4166667, we can see that F (s1) F (s2) <0 according to the mapping (6), namely production efficiency of the evaluated DMU is between the 1st and 12-th standards. Then s3 = [1 + 11 * α] =7, the optimal objective value of the s3-th standard is 0.8737374, and F (s1) F (s3) <0, the production efficiency of the evaluated DMU is between the 1st and 7-th standards, s2 ← s3 = 7. Here, s1 = 1, s2 = 7, F (s1) F (s2) <0, turn to Step 3, s3 ← [1 + (7 - 1) * α] =4. F (s1) F (s3) >0, F (s3) >0, thus the production efficiency of the evaluated DMU is higher than the production efficiency of 4-th standard, then s1 ← s3 = 4, F (s1) F (s3) = F (4) * F (7) <0, turn to Step 4. s3 ← [4 + (7 - 4) * α] =5, F (s1) F (s3) =0, then F (s3) =0. From the mapping (6), we can conclude that the evaluated DMU is located in the 5-th standard.
In the conventional fuzzy DEA model, the fuzzy data of inputs and outputs are convex and normal, and the constraint condition consists of the evaluated DMUs. However, in many real applications, the fuzzy data may be convex/non-convex and normal/abnormal. Efficiency of the evaluated DMU may not be obtained from contrasting with the DMUs under evaluation, but contrasting with sample standards determined in terms of manufacturing parameters. The purpose of the contrast is not only to evaluate efficiency, but also to locate the standard with which the evaluated DMU has similar behavior.
In this paper, we propose a generalized fuzzy DEA model to evaluate the efficiency of the evaluated DMU with convex/non-convex and normal/abnormal fuzzy data. Firstly, there are many sample DMUs, and the sample DMUs are divided into several ordered sample standards based on manufacturing parameters. Moreover, constraint condition consists of one of the sample standards. The notion of restricted fuzzy set is proposed, and the center of mass is introduced to deal with the restricted fuzzy set. Secondly, the relationship between production frontier and fuzzy DEA efficiency is given. To reduce the computational load, we employ an algorithm based on golden section method to locate the standard with which the evaluated DMU has similar behavior. Finally, the use of the proposed model is illustrated by mean of an examples.
Footnotes
Appendix
The supports and membership functions of the fuzzy sample DMUs
|
|
|

|