
Abstract
This paper tries to map the research work carried out in the field of Big Data through a detailed analysis of scholarly articles published on the theme during 2010-16, as indexed in Scopus. We have collected and analyzed all relevant publications on Big Data, as indexed in Scopus, through a quantitative as well as textual characterization. The analysis attempts to dwell into parameters like research productivity, growth of research and citations, thematic trends, top publication sources and emerging topics in this field. The analytical study also investigates country-wise publications output and impact in terms of average citations per paper, country-level collaboration patterns, authorship and leading contributors (countries, institutions) etc. The scholarly publication data is also subjected to a detailed textual analysis method to identify key themes in Big Data research, disciplinary variations and thematic trends and patterns. The results produce interesting inferences. Quantitative measures show that there has been a tremendous increase in number of publications related to Big Data during last few years. Research work in Big Data, though primarily considered a sub-discipline of Computer Science, is now carried out by researchers in many disciplines. Thematic analysis of publications in Big Data show that it’s a discipline involving research interest from fields as diverse as Medicine to Social Sciences. The paper also identifies major keywords now associated with Big Data research such as Cloud Computing, Deep Learning, Social Media and Data Analytics. This helps in a thorough understanding and visualization of the Big Data research area.
Introduction
Big Data refers to those datasets that are so large as to pose challenges in storage and analysis via traditional data handling techniques. Big Data Analytics (BDA) is the umbrella term given to the practice of collecting, organizing and analyzing large sets of data (Big Data). Big Data analytics allows organizations to comprehend the information contained within the data, in a better and sound manner and also helps in identifying the data that provides insightful knowledge for the current as well as future business decisions. Big Data has percolated into possibly all domains of technology and is gaining huge attention from academia as well as industries and governments. Big Data analytics as a research area has become very important in recent years. It now encompasses all the techniques used to analyze data at large scale spanning across health care, policy making, astronomy, city planning, education, telecommunications, banking, IT and risk management, advertising, marketing and other strategic business domains.
Although Big Data has become a popular area of research, it still has several definition trying to explain the area. There are many debates about it and no singly agreeable definition exists. There are three types of definition found in literature [1]: Attribute Definition, Comparative Definition and Architectural Definition. These three definitions cover major concepts and key-points said about Big Data by industry and academia experts.
International Data Corporation (IDC) 1 defines Big Data as a technology that is used to extract value from such large data sets that are beyond the processing capabilities of traditional relational approaches. Definitions apart, Big Data has been a result of our current technological capacities and we have come to a point where we can gather, store, and analyze massive amounts of data. The term Big Data has been floating around for almost two decades with the tags of high-performance data mining, text mining, predictive analytics, forecasting and optimization and more lately as data science [2]. However, it has only been in the recent years that such popular resonance has been witnessed in the field, that is now being fostered openly and speedily researching about fresh, better and effective approaches and technologies to manage Big Data.
Research advancements and results are typically enunciated through publishing the research work. Because of progression in science, researchers around the globe consistently deliver an expanding vast volume of ‘scholarly data’, which give the mechanical premise to overall dispersal of logical discoveries. This scholarly data can be analyzed mainly through analyzing academic social networks and mining scholarly text. Analyzing this scholarly data will lead to better understanding of science of science [3]. It is in this context that this paper makes an attempt to map the locales of research done on the area of Big Data by using scientometric and text-analytics methodologies.
The scholarly data on the theme of ‘Big Data’ published during last seven years (2010-16) in reputed journals and conferences, as indexed in Scopus
2
international multidisciplinary bibliographical database, are collected for analysis. This data is then computationally analyzed to: compute standard scientometric indicators of research area, identify growth pattern of published work in Big Data, understand authorship & collaboration patterns, analyze citation impact, identify top publication sources, identify most productive countries & institutions, understand the thematic trends, characterize the interdisciplinary research landscape of Big Data, and
The paper presents a comprehensive and analytical mapping of the emerging area of Big Data research. The assessment obtains distinctive and useful information about the activity and patterns in Big Data research. The rest of the paper has been organized as follows. Section 2 presents a general overview of Big Data discipline and the broader objectives of this analytical mapping effort. Section 3 describes some related work done earlier. Section 4 describes the data collection used for analysis. Section 5 presents computed results on distribution and growth of research output in Big Data, as seen in major journals and conferences. Section 6 describes the authorship patterns and the collaboration behaviors among researchers in Big Data. Section 7 identifies the major countries and institutions doing research in Big Data, and top publication sources in which Big Data research is getting published. Section 8 presents disciplinary trends and variations observed in Big Data research output. Section 9 describes the major keywords and themes observed in published work in Big Data. A somewhat comprehensive list of major Big Data Analytics softwares/ platforms is provided in section 10. The paper concludes in Section 11 with a short summary of the paper and its relevance & usefulness for the Big Data research community.
Overview and objectives
Big Data covers all those techniques and technologies that require new insights to uncover hidden values and patterns from large datasets that are diverse, complex, and of a massive scale. In the past Big Data has been characterized by three Vs namely: Volume, Velocity and Variety, as originally given by Gartner [4]. Volume refers to large voluminous nature of data, Variety refers to complex and various forms of data, and Velocity refers to high speed of rate of growth of Big Data research. Later two more V’s (Value and Veracity) were added to the definition. Value, added to this list by IDC [5], refers to the deep hidden value to be mined from the Big Data sets. Veracity [6] refers to the measure of accountability or trustworthiness of the data. There have been attempts to efficiently manage these data characteristics [7]. The interest of people in Big data can be observed through an analysis of search queries on the term. The Fig. 1 indicates research interests over time measured from search queries. Here the numbers represent search interest relative to the highest point on the chart for the given time. A value of 100 means the term is highly popular. A value of 50 means that the term is half as popular. Likewise, a score of 0 means the term is less likely to be popular at all. We can clearly observe that Big Data is creating enormous interest in people.
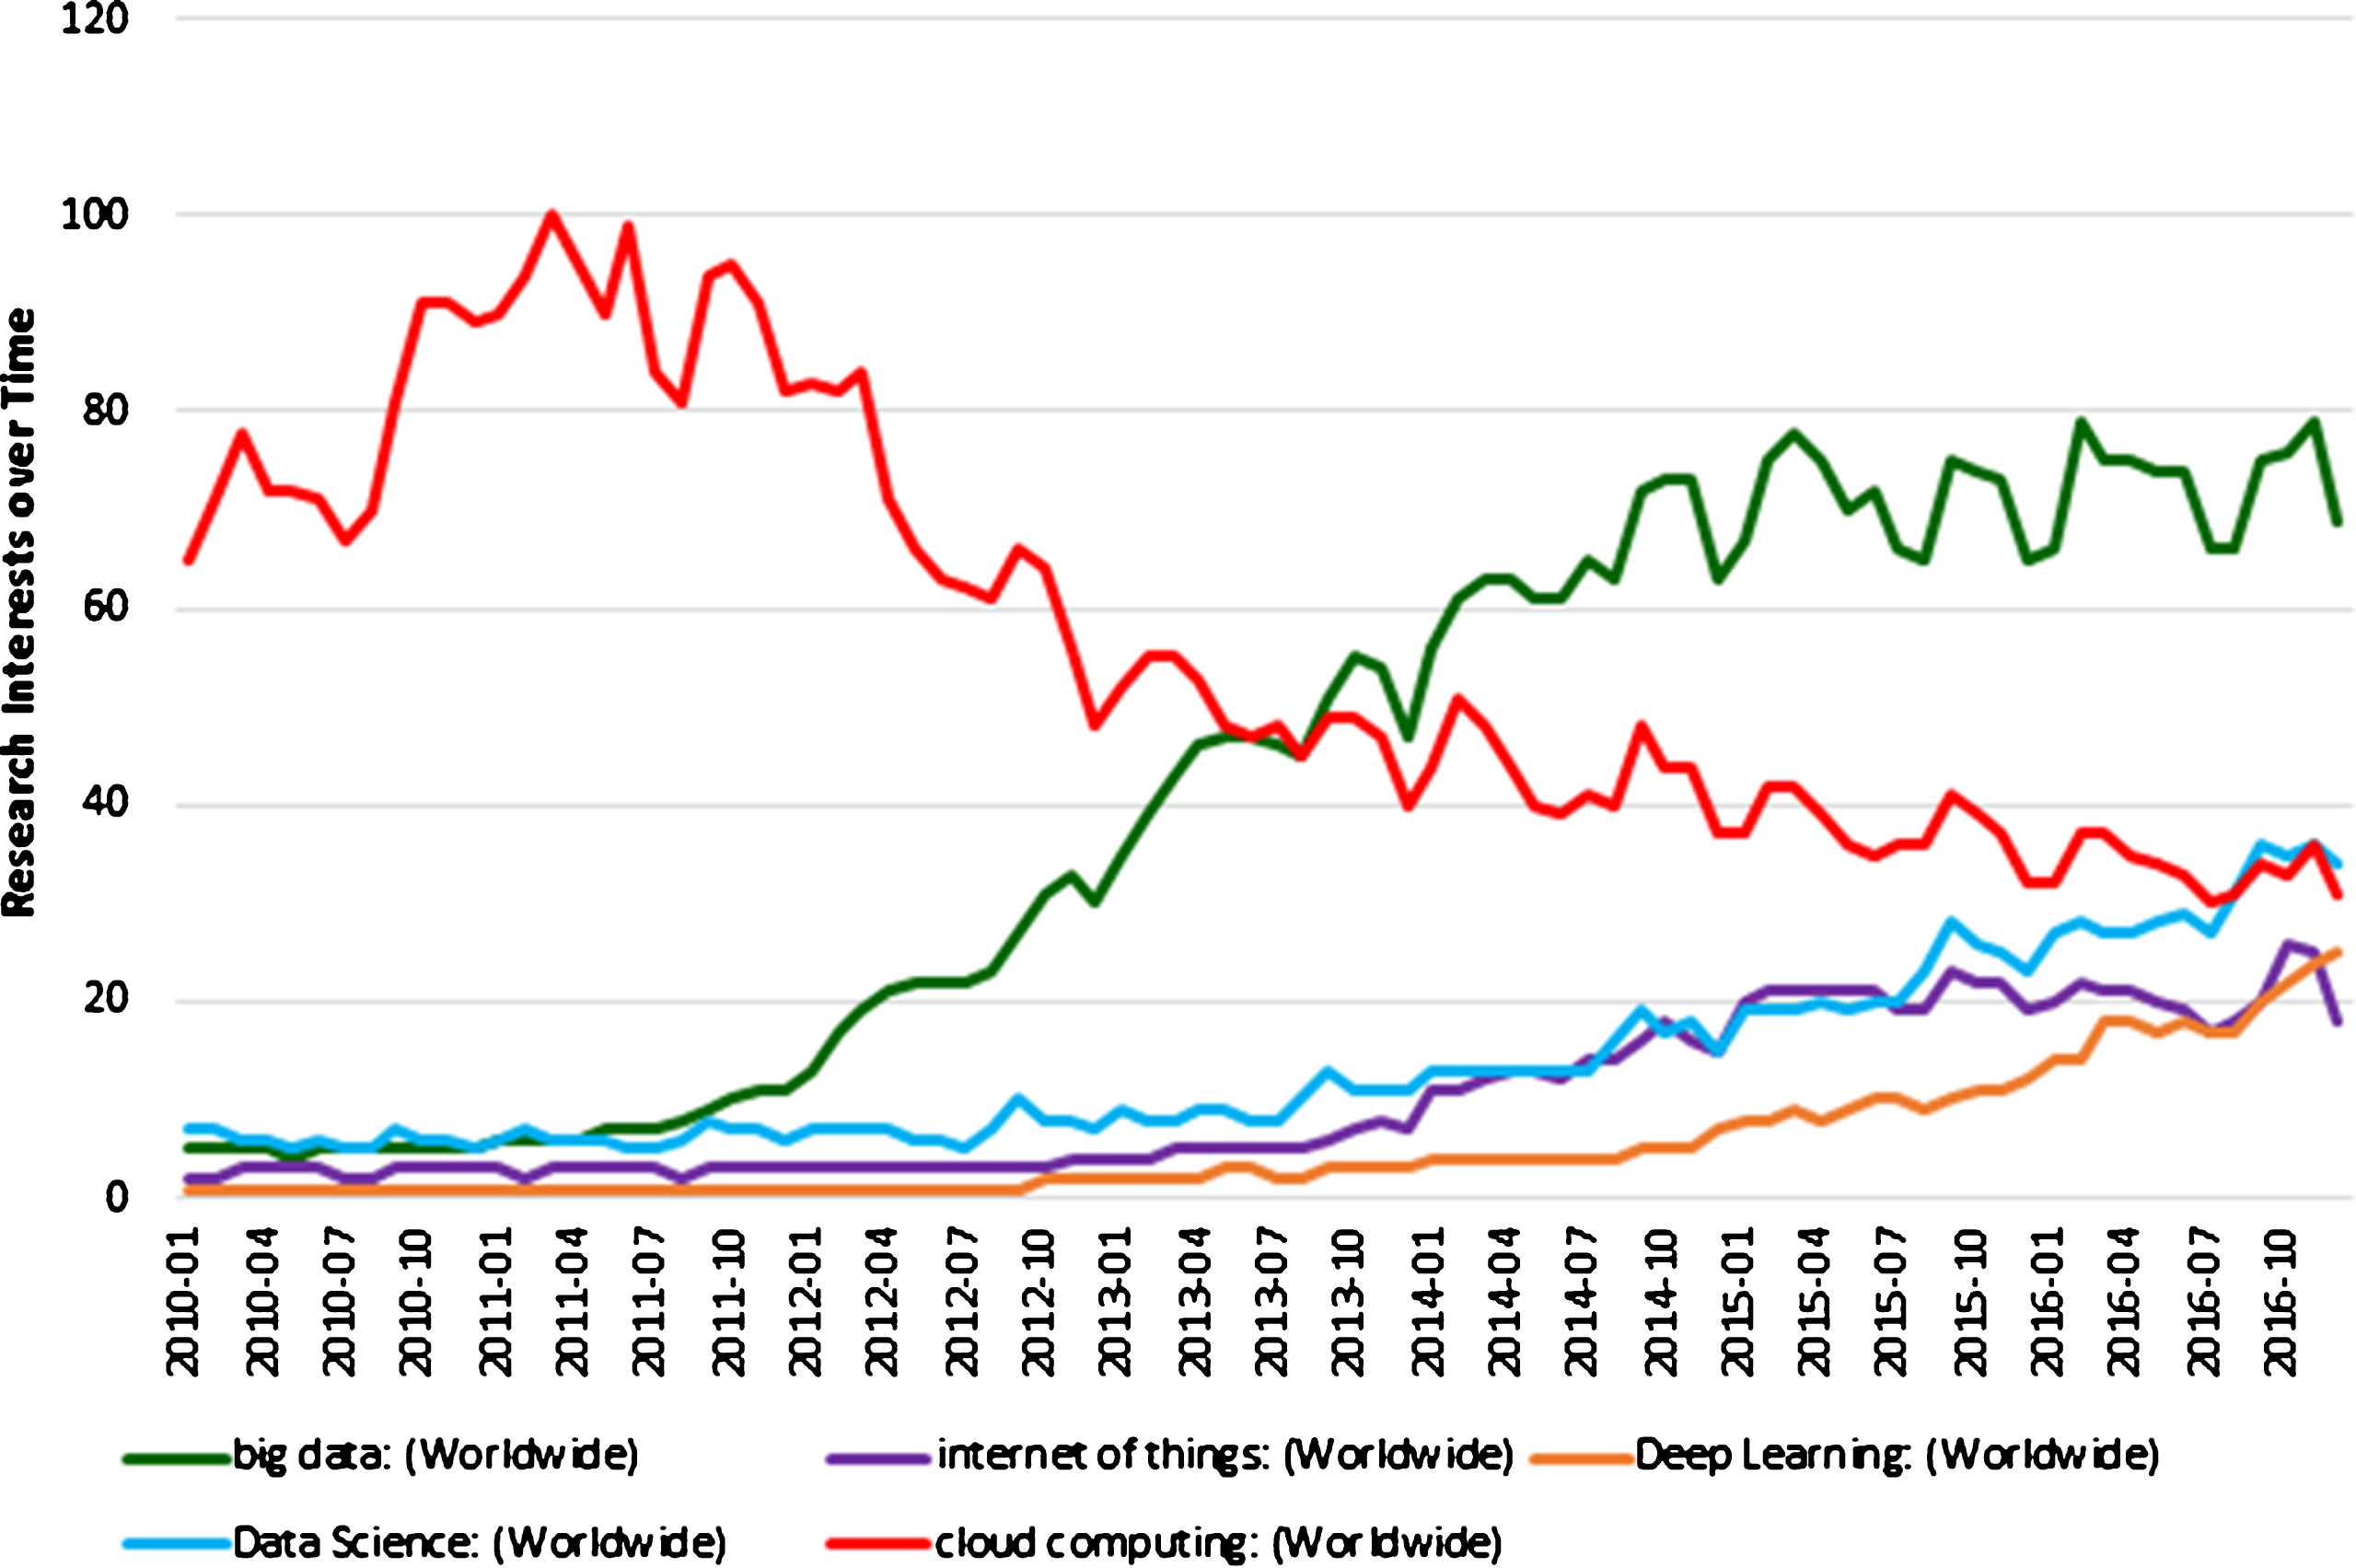
Research interests over time.
The idea of the Internet of Things (IoT) and cloud computing (both of which started around 2010) gave momentum to research work in Big Data, which in turn called for trained manpower in the area. According to Tableau 3 (a business intelligence firm), convergence of IoT, cloud, and big data will create new opportunities for self-service analytics. It might be the case, that everything in the coming years will have a sensor that sends data back to a mother-network. Gigantic volumes of structured and unstructured information is being generated by IoT, and a considerable share of this information is being deployed on cloud administrations. The data, thus produced is often assorted and resides across multiple systems, ranging from NoSQL databases to Hadoop clusters. While advancements are being accelerated in storage and processing, getting to and understanding the big data itself still represent a noteworthy challenge. As an upshot, demand is growing for analytical tools that consistently interface with and consolidate a wide range of cloud-facilitated information sources. Such devices empower organizations to investigate and picture any kind of information kept at any place, helping them find shrouded opportunity in their IoT venture.
As far as cloud is concerned, in most of the big data scenarios, major share of the information is coming from external sources, such as from social media, demographic data, web data, events, feeds, etc. Organizations perceive the developing significance of online social networking though they are facing difficulties to utilize its potential. The good reason as to why big data can bode well in in the cloud can include Big Data’s requirement for a range of cutting edge tools, skills, and ventures; involvement of huge amounts of external and distributed data; and requirement of data services [8, 9]. Smart and intelligent services in healthcare [10], cities [11], education [12], businesses [13] and social sensing [14], disaster management [15] are all examples of the amalgamation of these phenomena. At the beginning of the data science era, majority of the research papers were built and concentrated on the conception of multidimensional data. The temporal and streaming aspects are the most focused topic of study nowadays and are being studied in the context of complex data types such as graphs, social networks, and social streams. This area of analysis is rich and yet remains largely unexplored.
The main objective of this research paper is to analyze the metadata available in the scientific research publications produced on Big Data during last seven years. The research paper set is obtained from Scopus and contains all relevant documents which have at least one occurrence of the term Big Data in the topic, keyword or abstract fields. Our aim is to present quantitative measures of research work in Big Data as well as identifying major keywords, themes and disciplinary trends and variations in Big Data research. Various kinds of analysis are performed for this purpose on full data and on data for three key journals in Big Data research area.
Computational analysis of scientific articles in a specific discipline, has been a popular research option to explore. These studies have attempted to acquire an in-depth understanding of the chosen field of research. Although no existing work could be found that conducts quantitative and textual-based mapping on the scholarly data available on ‘Big Data’ in Scopus, as conceptualized and carried out in this paper. Nevertheless, several previous studies have helped in formulating the research plan and carrying out the analytical work of the present paper. For envisaging the budding area of Big Data in recent past, various authors have augmented the field with their visions and laid down foundation for better in-depth conception of Big Data core concepts and definitions. One previous work [16] has inspected the myths that are going viral among the masses due to novelty of the research area, whereas another work [17] discusses the significance of studying Big Data and the challenges posed by the existence of Big Data. Several platforms and tools [18] related to storage, processing and retrieval are instrumental in increase in efficiency of study in Big Data science.
Few other papers deal with characterization and analysis of research on Big Data. Boyd and Crawford [19] have tried pointing some crucial questions and answers related to Big Data research in their work. Hoskins [20] talks over the trends of contemplating big data. Chen et al. [21] discussed the future prospects and growth of Big Data as a research theme, along with a discussion on vision for the Big Data research theme. Park & Leydesdorff [22] examined the social and semantic networks that emerge in the Big Data. Halevi and Moed [23] inspected the evolution of research related to Big Data focused on descriptive statistics by using the Scopus database. However, the current work for analytical characterization of Big Data research remains unparalleled to the best of our knowledge. This paper presents account of a comprehensive approach for quantitative and text-based characterization of Big Data research published during last seven years. It identifies rate of growth of publications, differential growth in publication types and distribution of papers among countries, institutions and journals. Subsequently, results of text-based analysis are presented which help in identifying major keywords, themes in the area and thematic trends. Analysis of three selected Big Data journals also present useful insight about Big Data research area.
Data
The analysis is based on research papers published during last seven years (2010-16) and indexed in Scopus. The search query used for the data collection is given in Table 1. A total of 25,334 records were found as a result of this search query. The data collected includes documents of the type: conference paper, conference review, article, article in press, review, short survey, editorial, book chapter, book, note or letter. Out of these categories of scholarly data, ‘article’, ‘review’ and ‘article in press’ have been considered as journal publications while ‘conference paper’ and ‘book chapter’ have been considered to be in conference publications. The remaining categories of publications were not taken into account for analysis.
Dataset details
Dataset details
The whole analytical mapping has thereafter been carried out separately for journal publications and conference publications. After grouping and filtering data, a total of 8,720 journal publications and 16,614 conference publications were retrieved. The data in Scopus is organized as records, each consisting of 41 fields which describe multiple attributes namely-Authors, Title, Year, Source title, Volume, Issue, Art. No., Page start, Page end, Page count, Cited by, DOI, Link, Affiliations, Authors with affiliations, Abstract, Author Keywords, Index Keywords, Molecular Sequence Numbers, Chemicals/CAS, Trade names, Manufacturers, Funding Details, References, Correspondence Address, Editors, Sponsors, Publisher, Conference name, Conference date, Conference location, Conference code, ISSN, ISBN, CODEN, PubMed ID, Language of Original Document, Abbreviated Source Title, Document Type, Source, and EID. The data contained in different fields has been utilized for the quantitative analysis.
The first parameter of analysis was to identify the number of papers published in the area of Big Data per year and also to measure the rate of growth. This has been done by first categorizing the research papers in the data into two categories-conference and journals. The year-wise distribution of research output and cumulative research output, for the time period 2010–2016 is presented in Table 2, categorized separately for conferences as well as journals. It is observed that the number of conference papers produced is much higher than the number of journal papers for the same period. This is expected since Big Data is a relatively new research area. It can also be observed from Table 2, that the total research output has increased significantly during 2010 to 2016. There is a trend of high growth in research done on Big Data especially in the last three years-2014, 2015 and 2016. The Fig. 2 depicts the annual growth of the number of publications on big data. Both the publication types: conference and journal record high growth.
Year-wise research output
Year-wise research output
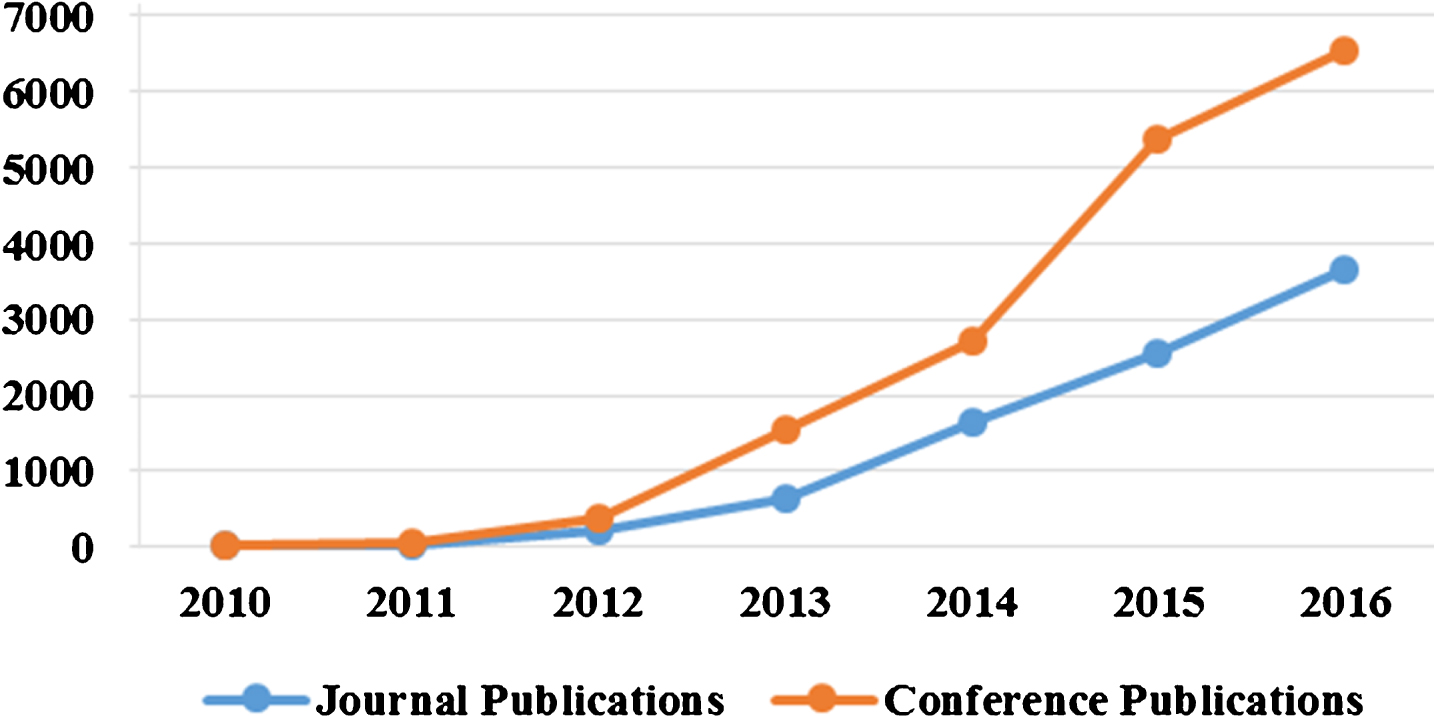
Annual growth of research output.
The second parameter analyzed was country-wise distribution of research output on Big Data. Table 3(a) and (b) present the research output for top 10 most productive countries for all the seven years, categorized as journals and conferences, respectively. As seen in the table, largest number of papers in Big Data are from United States. This is then followed by China, United Kingdom and India, in order. There appears a close competition between US and China in producing largest number of conference papers. This is then followed by India and Germany. The Fig. 3 presents a graphical representation of the number of journal and conference papers in Big Data by the major productive countries for the total period of analysis. It can be observed that US and China taken together are producing more than 50% of the total research papers in Big Data.
Country-wise research output (in Journals)
a Percentage Contribution w. r. t. 8720 journal publications
Country-wise research output (in Conferences)
a Percentage Contribution w. r. t. 16614 conference publications

Quantity of publications by top contributing countries.
Collaboration pattern among researchers producing papers in Big Data has been the third parameter of analysis. First of all, it was measured as to what proportion of papers on Big Data have one, two, three or more than three authors. Figures 4 and 5 present distribution of the total research output in Big Data among one, two, three or more than three authors, for journal and conference papers, respectively. It is observed that both journal as well as conference papers now have a trend towards multi-authored papers. To further identify the nature of authorship collaboration, the author affiliation of each of the authors in a multi-authored paper was extracted. This information was then used to identify country of each author and hence finding out how many papers have authors from two or more than two countries. The Fig. 6 plots the country-level collaboration pattern of papers on Big Data. In this plot, the bigger a node is the higher is the number of collaborated papers the country has. Similarly, the thickness of an edge indicates the strength of collaborated research among two countries. According to spring-embedding algorithm [24], the closer a pair of countries in the two-dimensional space, the stronger is the relationship between them. The line length is inversely proportional to the number of the collaborative papers. It can be observed from the figure that ‘United States - China’ tie is the strongest international collaboration instance followed by ‘United States – United Kingdom’ pair. Further, ‘United States’ has the highest ICP instances involving different countries. International collaboration pattern can be analyzed in more detail [25–27] for a more detailed analytical account.
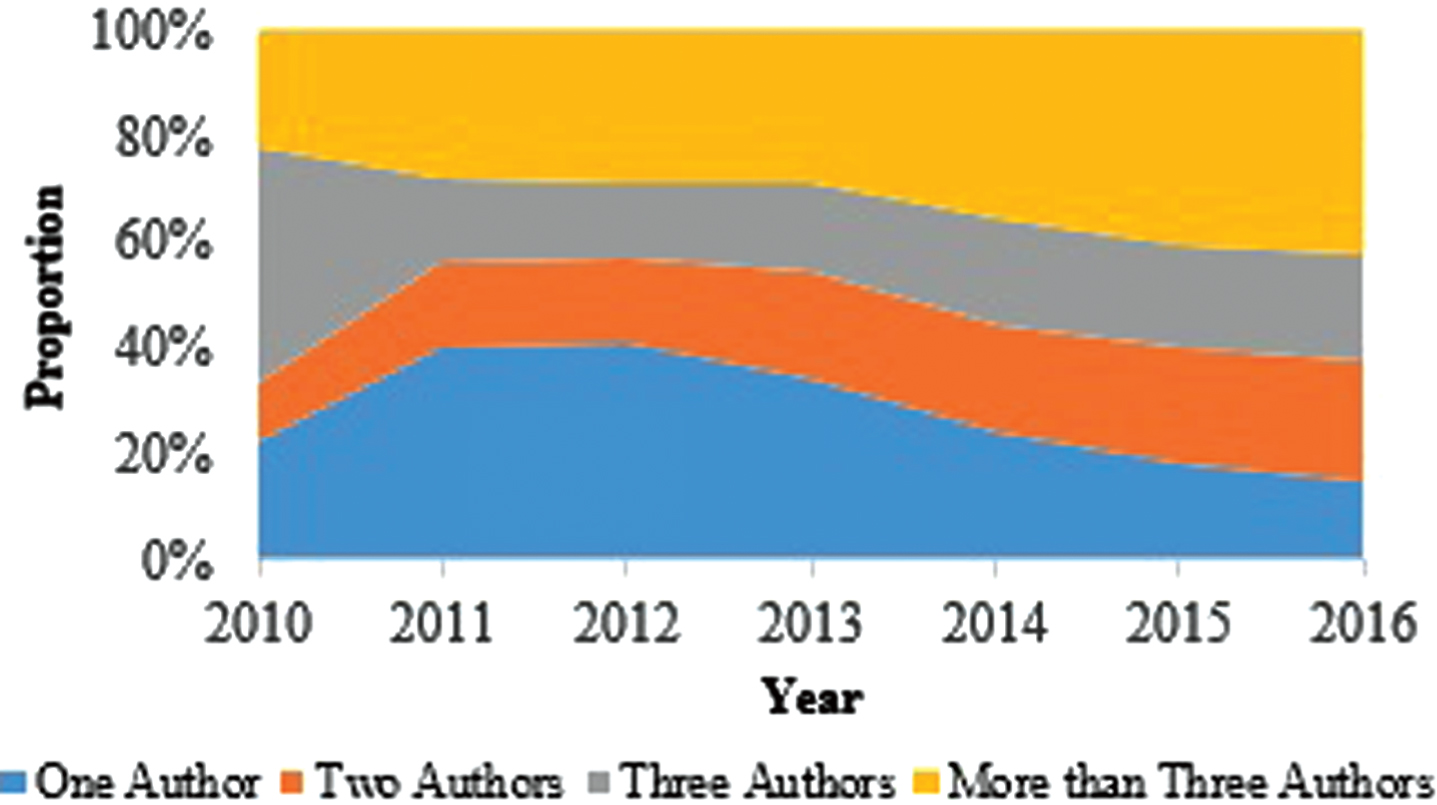
Authorship pattern (of Journal Papers) plotted year-wise.
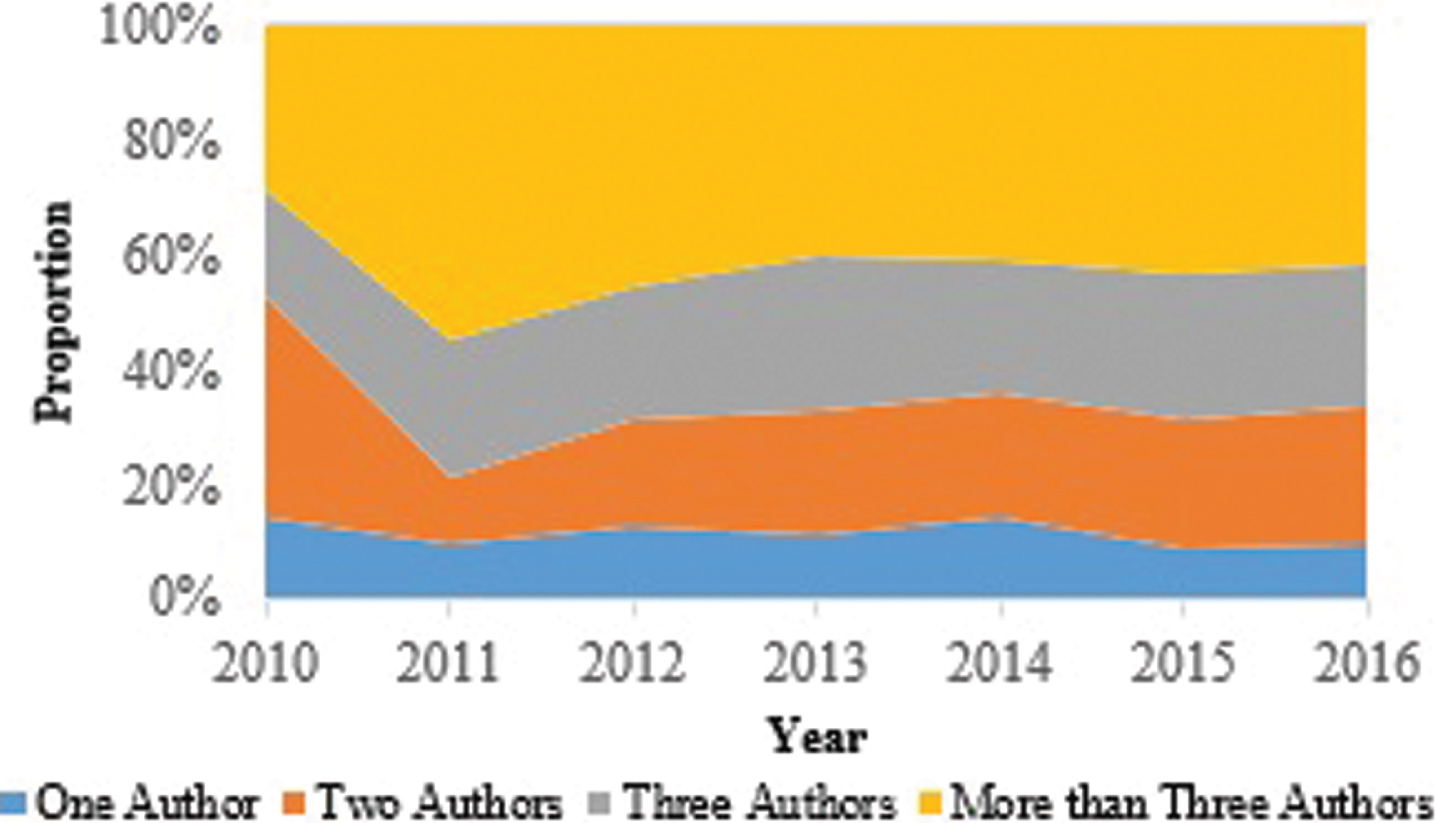
Authorship pattern (of Conference Papers) plotted year-wise.

ICP Network at Country level.
The next quantitative parameter analyzed was identifying top publication sources in which Big Data research is being published and also the major contributing institutions. For this purpose, the data has been processed to compute various scientometric indicators. These indicators include Total Publications (TP), Total Citations (TC), Average Citation Per Paper (ACPP) and h-index [28]. The h-index is considered a good composite measure for quantity and quality both. Table 4(a) shows the list of journals (arranged according to TP) producing highest number of papers on Big Data. It is observed that ‘International Journal of Applied Engineering Research’ tops the list with a total of 113 papers related to Big Data. However, on the impact parameter (measured by ACPP), ‘IEEE Intelligent Systems’ and ‘PLOS One’ are two most prominent journals, having higher ACPP. Other important journals that published good amount of research work on Big Data include ‘IEEE Access’, ‘Future Generation Computer Systems’ and ‘Computer’. Similarly, Table 4(b) depicts the most productive conferences (and conference proceedings) on Big Data where ‘Lecture Notes in Computer Science’ tops with TP value of 1774 and h-index of 16. ‘Proceedings of the ACM SIGMOD’ is another quality venue of publication in the field with a commendable h-index of 17 and ACPPof 10.00.
Top publication sources–journals
Top publication sources–journals
Top publication sources— conferences/ proceedings
After identifying the top publication sources, it was the time to identify most productive institutions on Big Data research. The TC, ACPP, h-index values have thus been computed for the data corresponding to each of the affiliating institutions. Table 5(a) and (b) present the top 10 contributing institutions to the Big Data research, measured in terms of TP in journals and conference categories, respectively. These tables indicate the TP, TC, ACPP, h-index values for each of the institutions. We can observe that ‘Chinese Academy of Sciences’ and ‘Tsinghua University’ are the top contributors in the journal papers as well as conference papers. Different institutions, however, rank differently on different parameters. For example, ‘Massachusetts Institute of Technology’ and ‘Stanford University’ can be seen as the most popular institutes contributing journal publications with a ACPP of 18.44 and 13.37,respectively.
Institutions with highest no. of journal papers
Institutions with highest no. of Conference Papers
To examine the frequency and patterns of citations in journal articles and conference articles, citation analysis is done by calculating the number of citations made by journal and conference papers. The number of citations is obtained from Scopus. The analysis of citation pattern in Table 6(a) and (b) present the citation behavior of journal and conference papers. It is observed that journal publications are cited more by journal publications (∼66%) and lesser byconference publications (∼33%). Similarly, conference publications are cited more by conference publications (∼68%) as compared to journal publications (∼32%). This is really an interesting observation to note and it appears that there are different kinds of authors producing journal papers and conference papers.
Citation pattern of papers in journals
Citation pattern of papers in conferences
The area of Big Data research is considered to be an interdisciplinary research area. Therefore, it will be natural to expect that researchers from many discipline contribute to the field and that Big Data research work is not limited to disciplinary boundaries. It is in this context that we have tried to identify disciplinary distribution of research records comprising our dataset. Table 7 presents the discipline-wise distribution of research publications in 15 majordisciplines along with their percentage contribution to the total research output, both for conferences and journal publications. This categorization into disciplines is based on the ‘Subject’ field of Scopus data downloaded. It is observed that a total of 12,630 out of 16,614 conference publications (∼76%) and 3,612 out of 8,720 journal publications (∼41%) are from ‘Computer Science’ discipline. This is an interesting observation. We see that more than 50% journal papers in Big Data research are coming from other disciplines than Computer Science. Engineering, Medicine, Social Sciences, Mathematics, and Business Management & Accounting are some of the major contributing disciplines to Big Data research. Since, a research publication may be categorized into more than one discipline (due to interdisciplinary outputs) and hence the total percentage value here exceeds 100. This comes from the fact that more and more computer-oriented disciplines are emerging outside computer science (computational chemistry, computational biology, etc.) i.e. an amalgamation of computer science and other fields.
Discipline-wise distribution of research output
Discipline-wise distribution of research output
To further identify disciplinary variations in Big Data research, important control terms are identified and burst detection algorithm is run to understand the keyword-based trends. For this purpose, author keywords for each paper in the data are extracted and then occurrence frequencies for all such distinct author keywords are computed. The author keywords are arranged according to descending order of their occurrence frequencies. Then the well-known burst detection algorithm (developed by Kleinberg [29]) is used to analyze the text streams of these keywords. This burst analysis helps to quantify the activity of a text stream during specific period of time. The Science of Science (Sci2) 4 tool is used for the burst detection. Table 8 depicts top 15 control terms with their starting and ending year of the burst. A higher weight describes the high popularity (more number of research papers) of that control term in Big Data research. The length of the burst gives the time period during which the research in that area was active. Some concepts seems to have become infrequent such as ‘Distributed Computing’ in 2014, while some are still researched about such as ‘Social Media’, ‘Cloud Computing’, ‘Internet of things’ and ‘Hadoop-Map Reduce’. The burst helps in identifying the important keywords occurring in Big Data research publications and their periods of usage. The burst is calculated for the data from year 2010 to 2016 only.
Taking into account the fact that a lot of research in Big Data can be interdisciplinary in nature, we have analyzed interdisciplinary collaboration trend in Big Data research. For this purpose, each paper has to be mapped to a subject area. Scopus subject area based-download to categorize papers into 42 fields helped us in this process. It may be noted that one article may appear in more than one discipline-which constitutes the essence of interdisciplinary research. The scholarly data with 43 fields (42 Scopus fields + Subject Area field) has been given as input to Sci2 tool for creation of interdisciplinary collaboration networks. An interdisciplinary collaboration network is necessarily a co-occurring disciplines network where nodes represent disciplines and edges represent the relationship between disciplines. The thickness of an edge depicts the strength of tie (inter-disciplinary research) between a pair of disciplines. For visualization of co-occurring disciplines network, VOS viewer software has been used. The Fig. 7 shows the interdisciplinary collaboration network (i.e. co-occurring disciplines network). From the figure, it is observed that collaboration of ‘Computer science’ with ‘Mathematics’ and ‘Engineering’ is more significant than any other disciplinary collaboration. The Fig. 8 shows the alluvial diagram for the contribution of each discipline across the 7-year period. It can be observed that many research papers in the initial years are from non-Computer Science discipline.
Top 15 control terms with burst detection
Top 15 control terms with burst detection
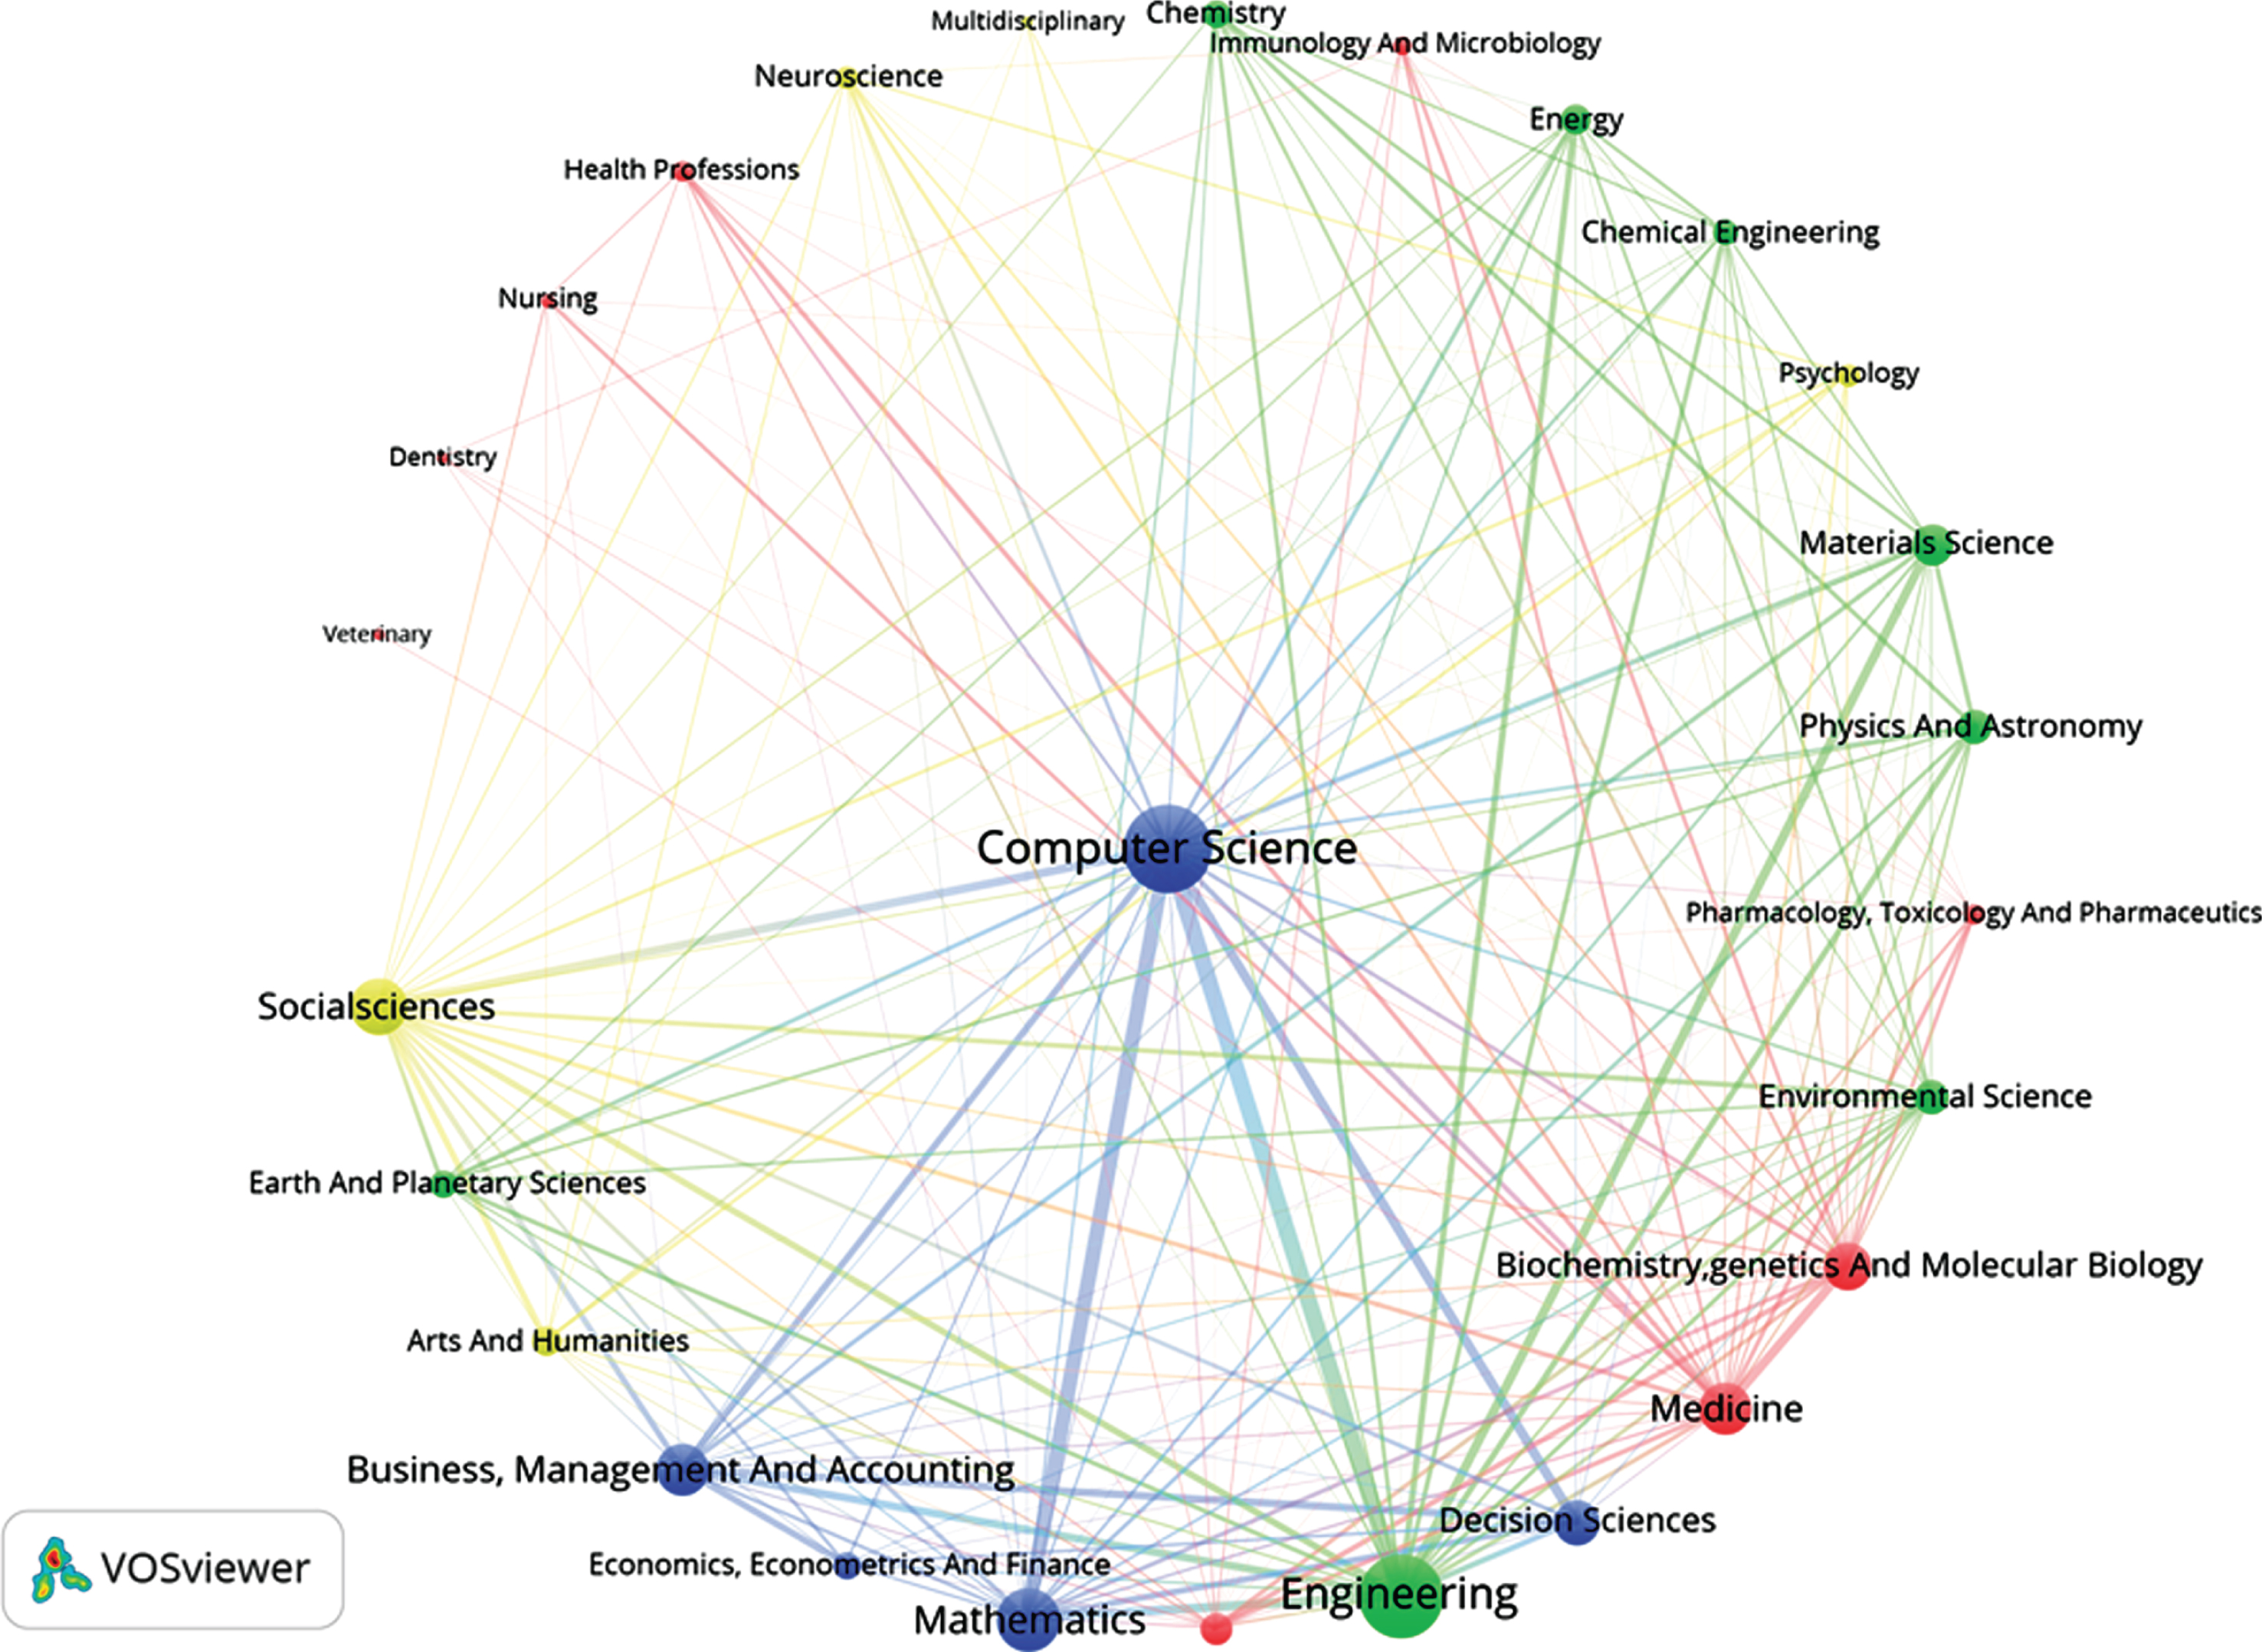
Interdisciplinary collaboration network (2010–2016).

Alluvial Diagram for contribution of disciplines yearwise.
We have also performed a Co-word analysis to identify important thematic terms and their relationship, occurring in Big Data research. Co-word analysis is an approach which targets the co-occurrence of words and phrases in the dataset. It creates the relationship between the concept/idea and the subject area. The occurrence of keywords together in the same article depicts the association between the topics [30, 31]. The Co-word analysis performed by us has used author keywords as the main data. Out of 8,720 journal articles, 1,919 articles (22% of 8,720 journal publications) doesn’t contain any author keyword. There is a total of 15,852 unique author keywords found in the whole data. We have selected only those keywords which have an occurrence frequency of at least 15 for the Co-word analysis result generation. A total of 131 such keywords are found and they are found to occur in 5,130 scholarly articles (60% of 8,720 journal articles). The co-occurrence matrix of these 131 author keywords is extracted from the scholarly articles and the network is created and visualized using VOS viewer. The hierarchical clustering algorithm of VOS viewer is applied on Co-word matrix. The Fig. 9 shows the Co-word network of these author keywords. We observe different clusters containing related terms-(i) HDFS, MapReduce, spark, NoSQL and HBase keywords represent the big data technologies; (ii) machine learning, deep learning, clustering, classification, feature extraction author keywords representing the techniques applied on Big Data; (iii) business analysis, supply chain management, predictive analysis, and decision making representing the applications of big data analytics; and (iv) social media platforms, networks, and twitter representing the sources of big data generation. We have also plotted a cosine-normalized map of some frequently occurring keywords by using the methodology of Mingers & Leydesdorff [32]. The Fig. 10 shows the cosine normalized map of 90 top most author keywords whose occurrence frequency is at least 20. It is basically a semantic mapping which depicts pragmatic groupings of related concepts. For instance healthcare, intelligent agents, predictive analytics, social media analysis, parallel and distributed computing can be observed in this map.
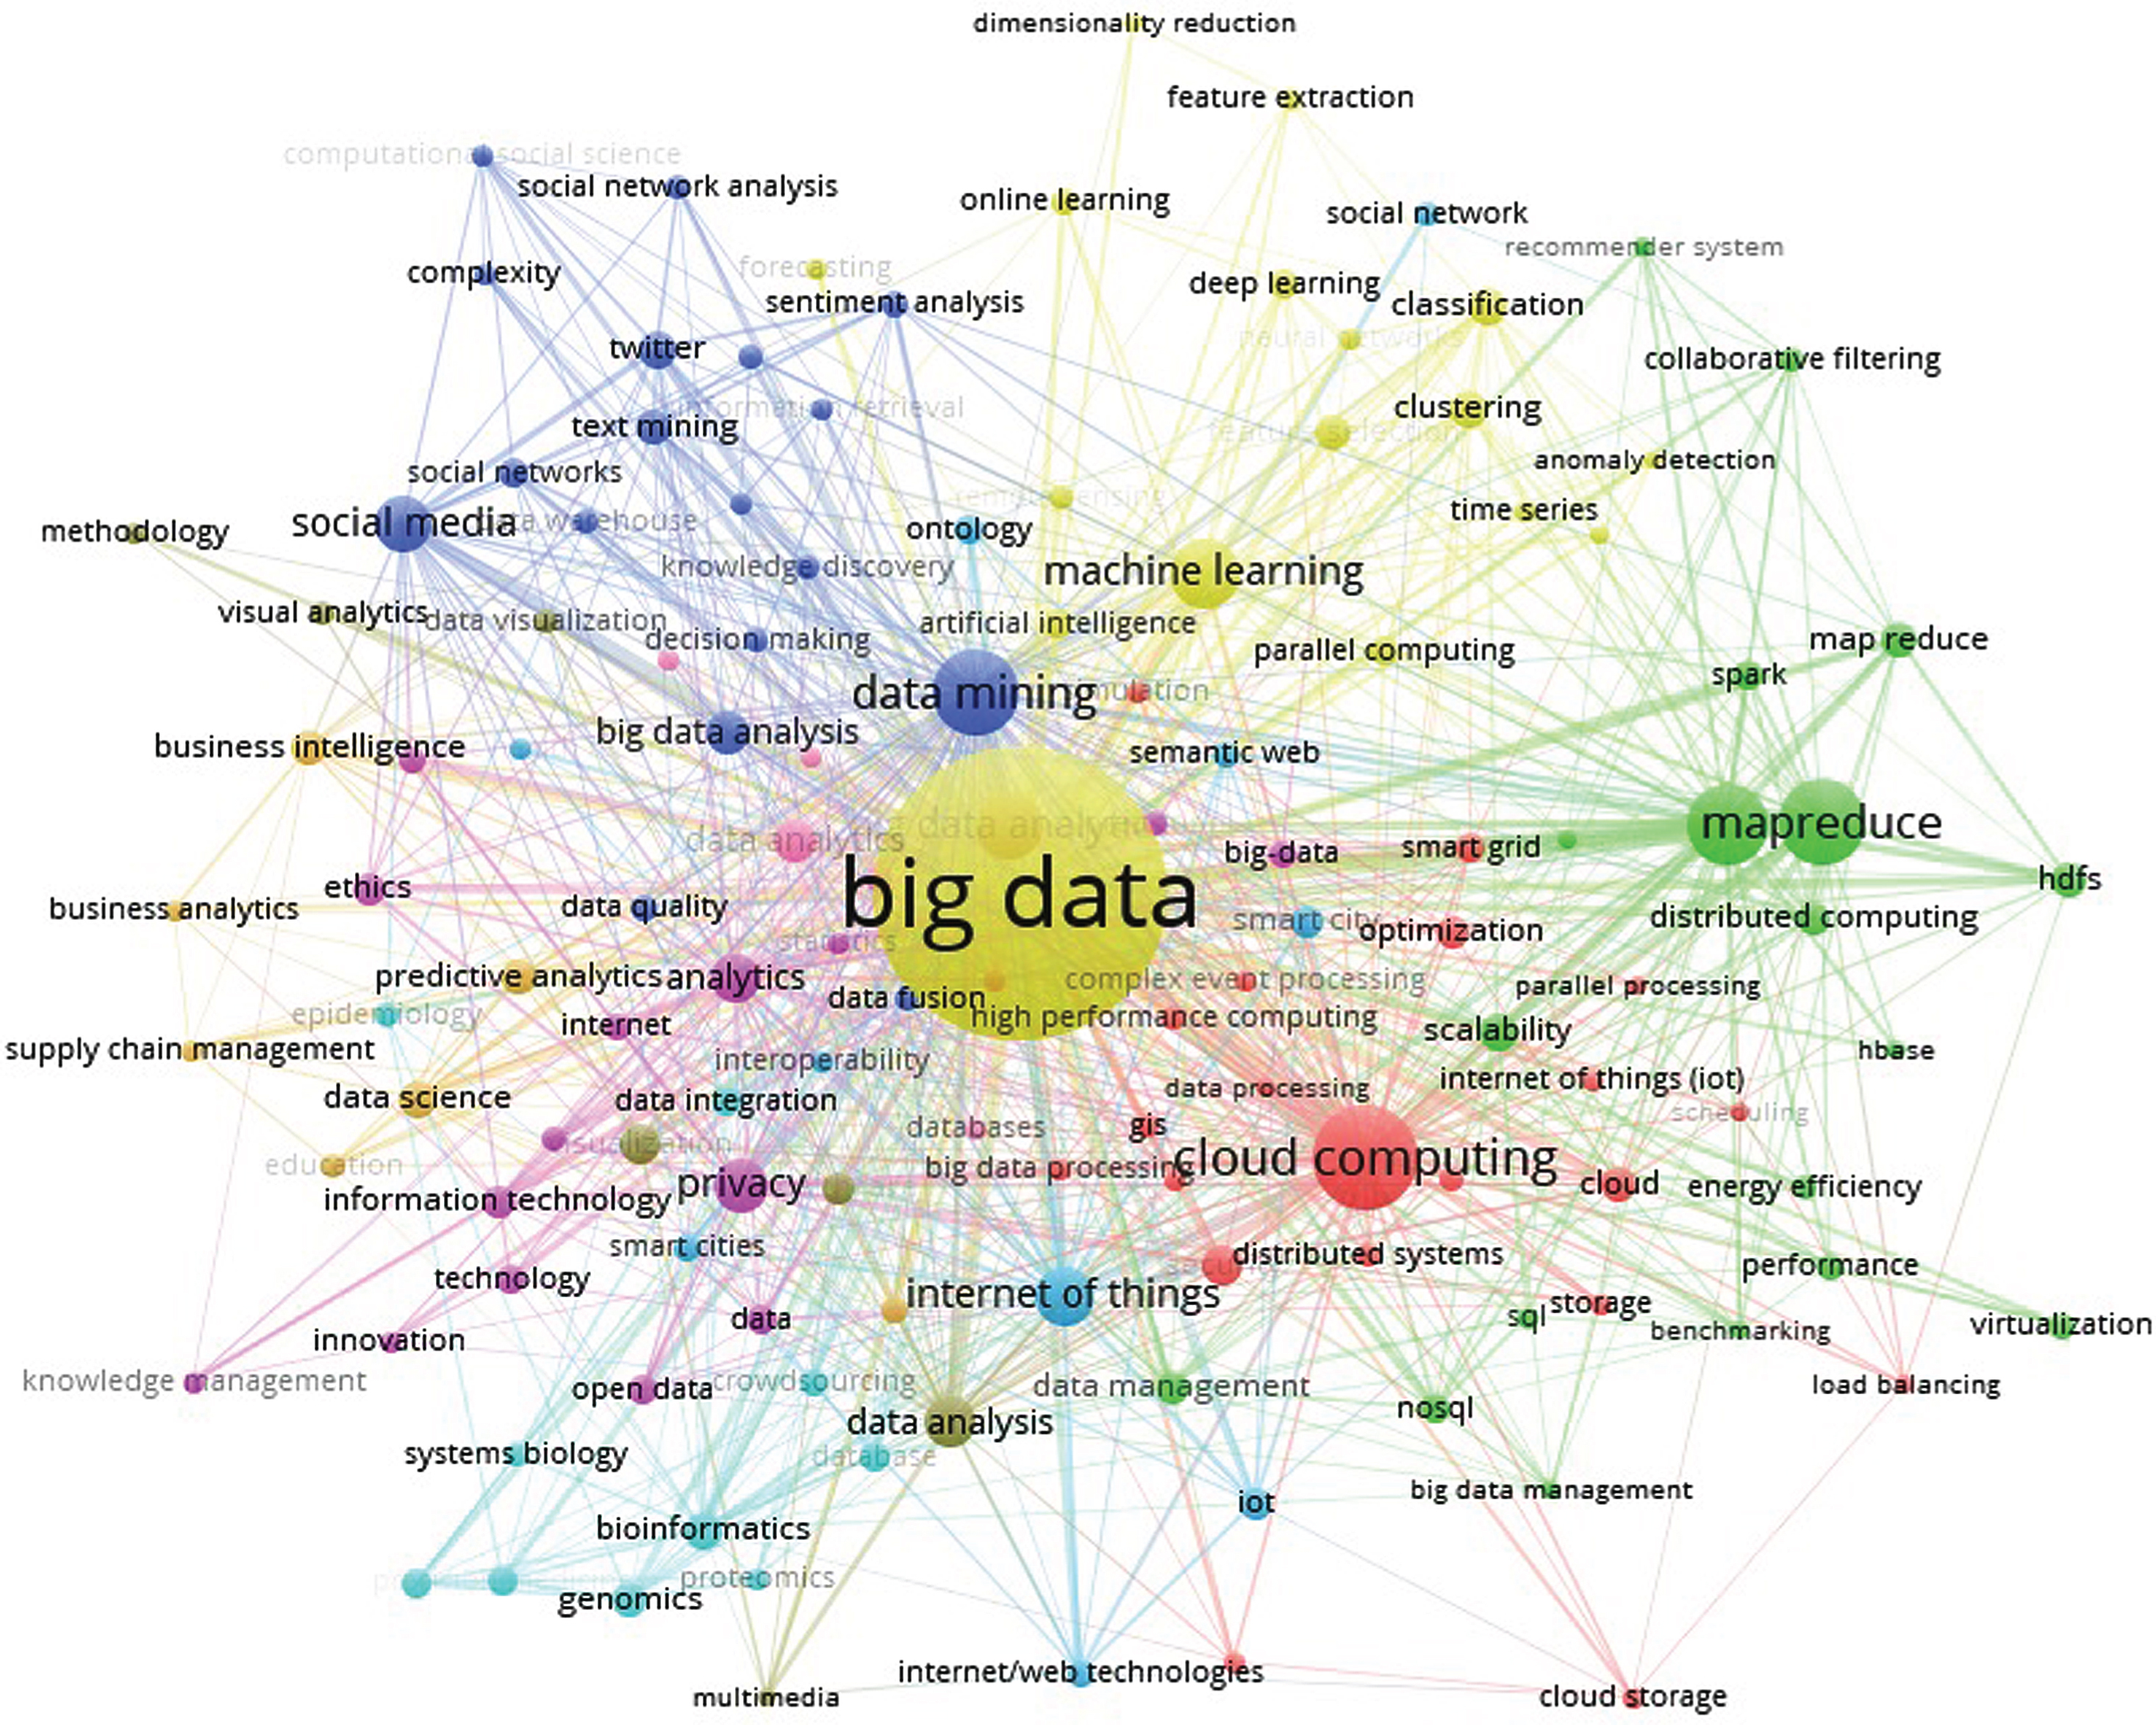
The co-word network of keywords.
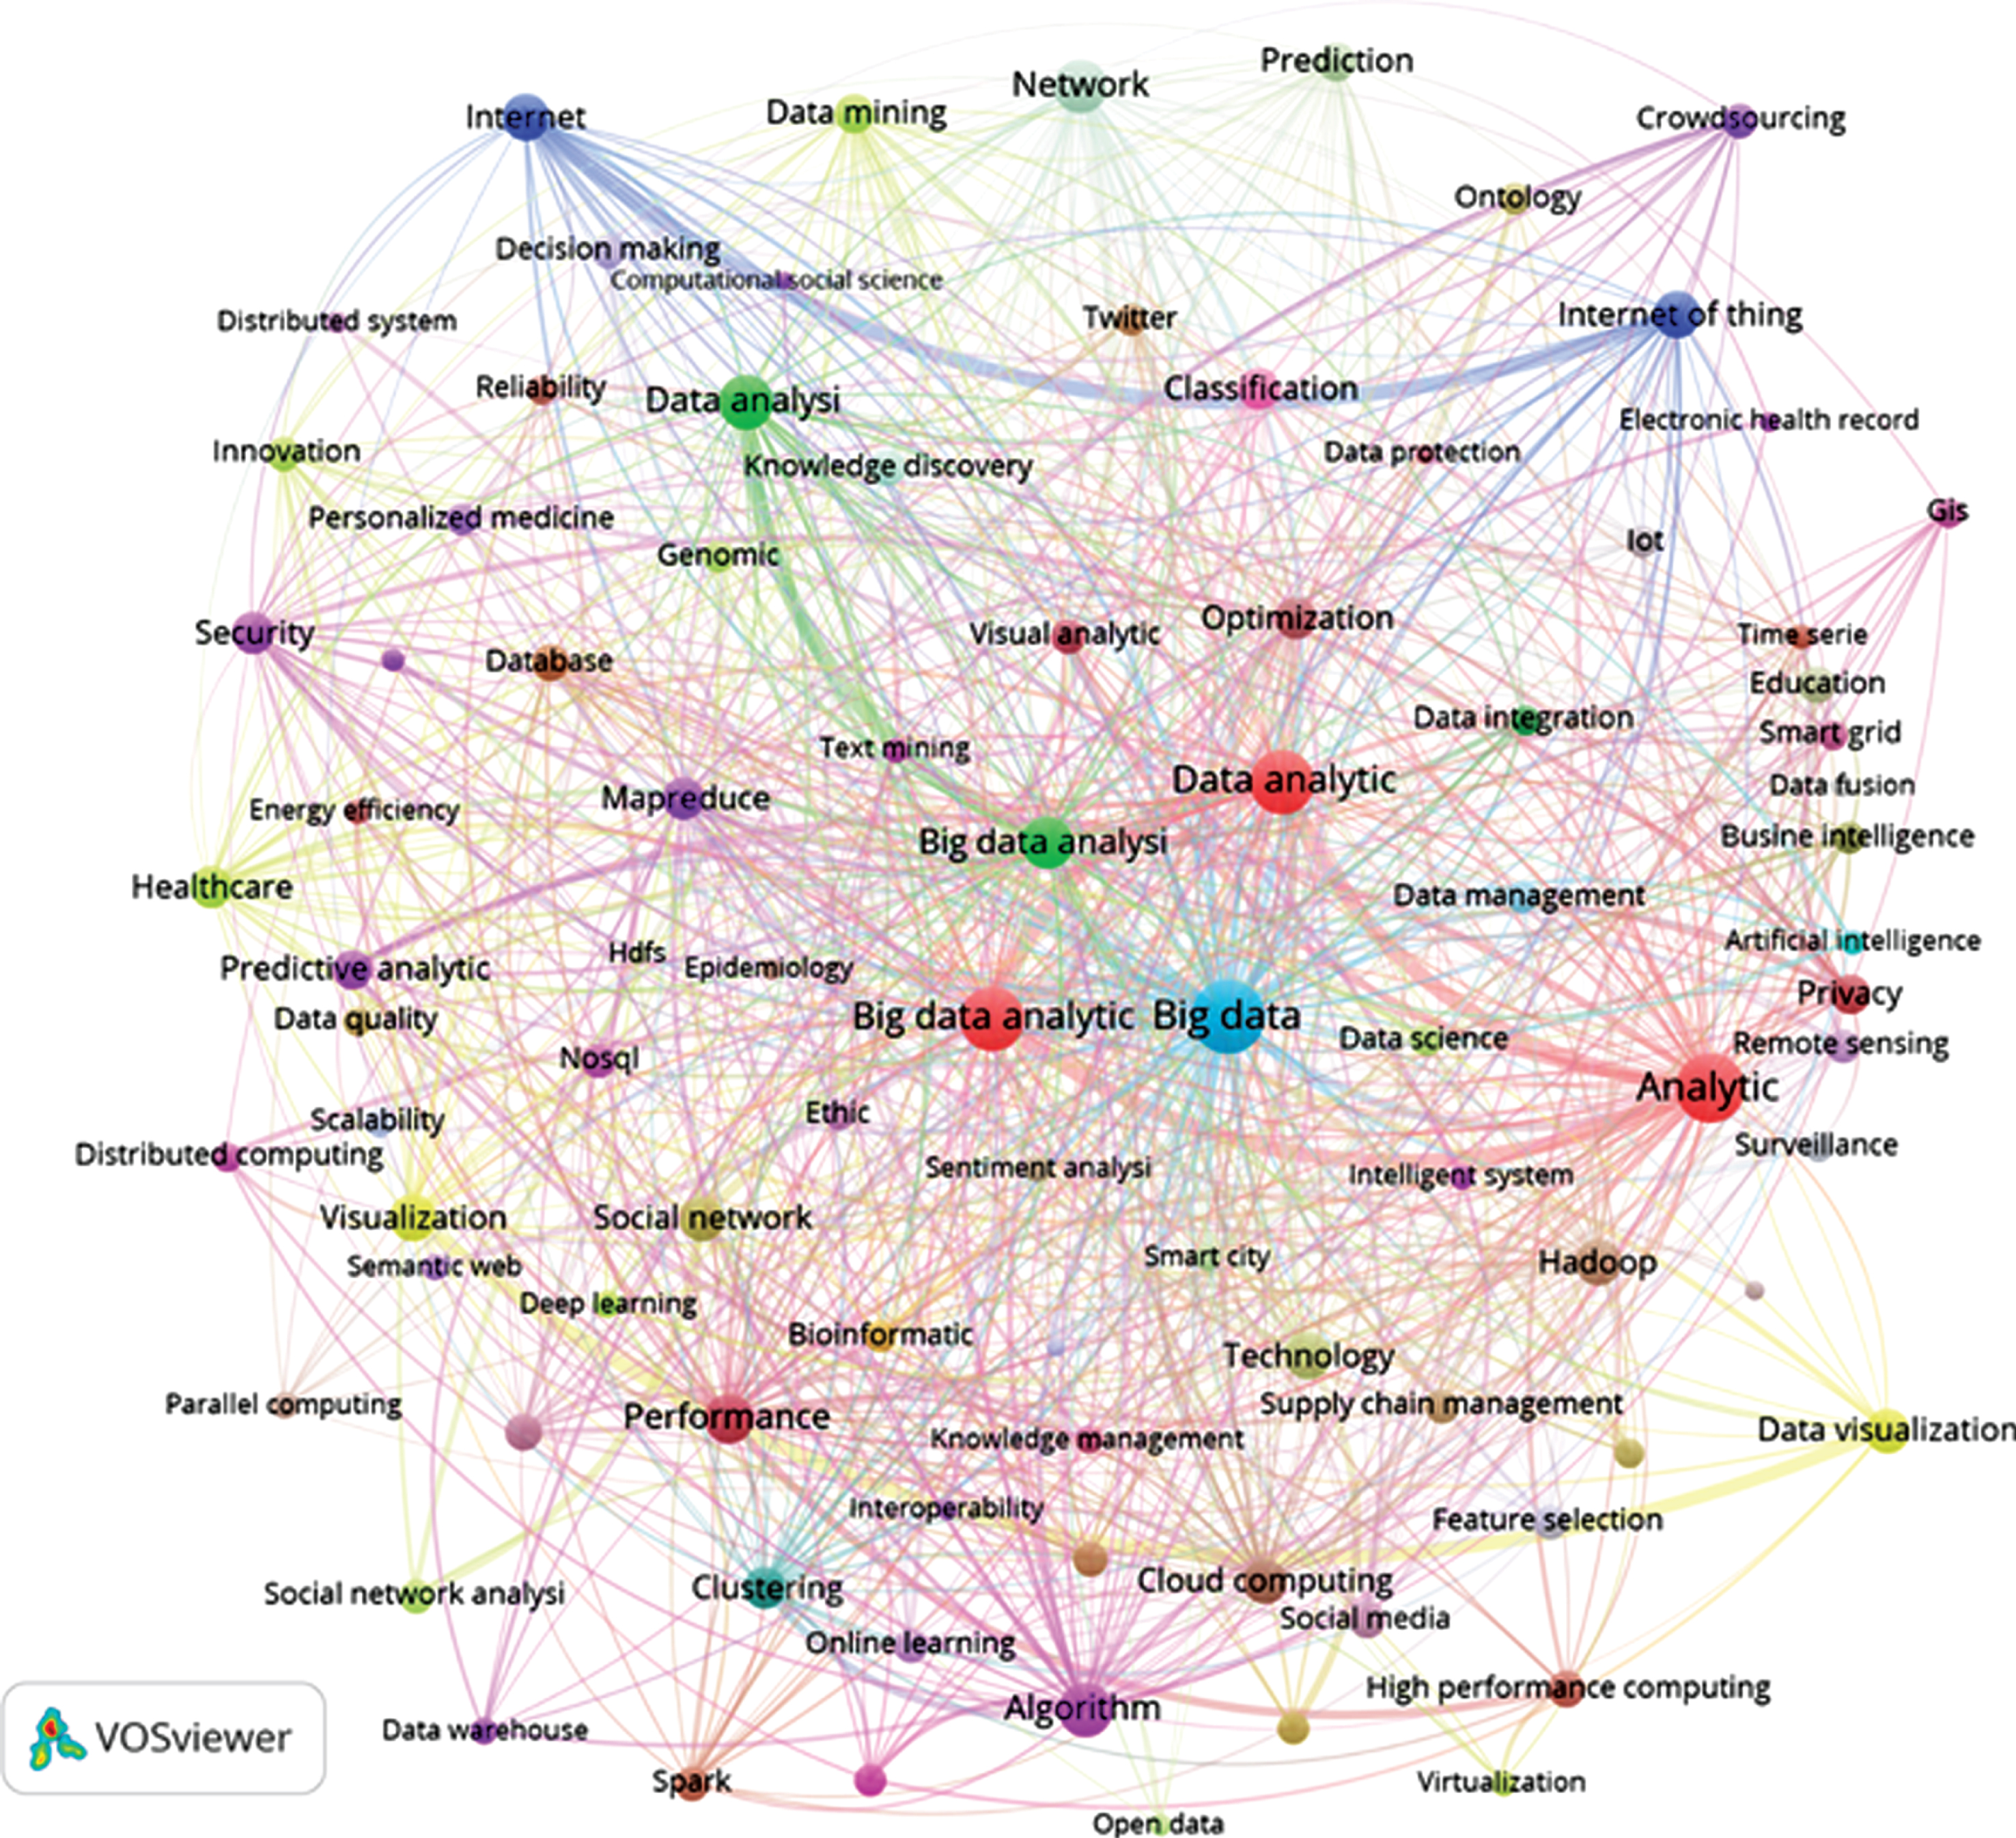
Cosine-normalized map of the 90 keywords which occur twenty or more times in the 8720 journal publication (cosine >0.1, modularity = 0.357).
The practice of referring to someone else’s work gives the fundamental linkages between individuals, thoughts, journals and organizations to constitute an experimental network that can be further analyzed. Moreover, the references and citations likewise give a linkage in time–between the previous research of its references and the subsequent publications which cite it. The number of citations have been derived from Scopus. We have also plotted journal to journal citation network of the Big Data research data. Figure 11 shows the overlay visualization of journal to journal citation relationship network. The network contains 97 journals, each have at least 10 articles with atleast 10 citation (i.e. h-index> = 10). There are 2,713 unique journals that were cited in 8,720 journal articles, out of which 97 journal have matched the said criteria. The node size in the network is proportional to its citations and the edges in network depict the citation relationship between the journals. Graphical overlays aid in analyzing prominent journals which are actively publishing in the field of Big Data. The most active journals have larger node size showcasing the number of citations received by them.
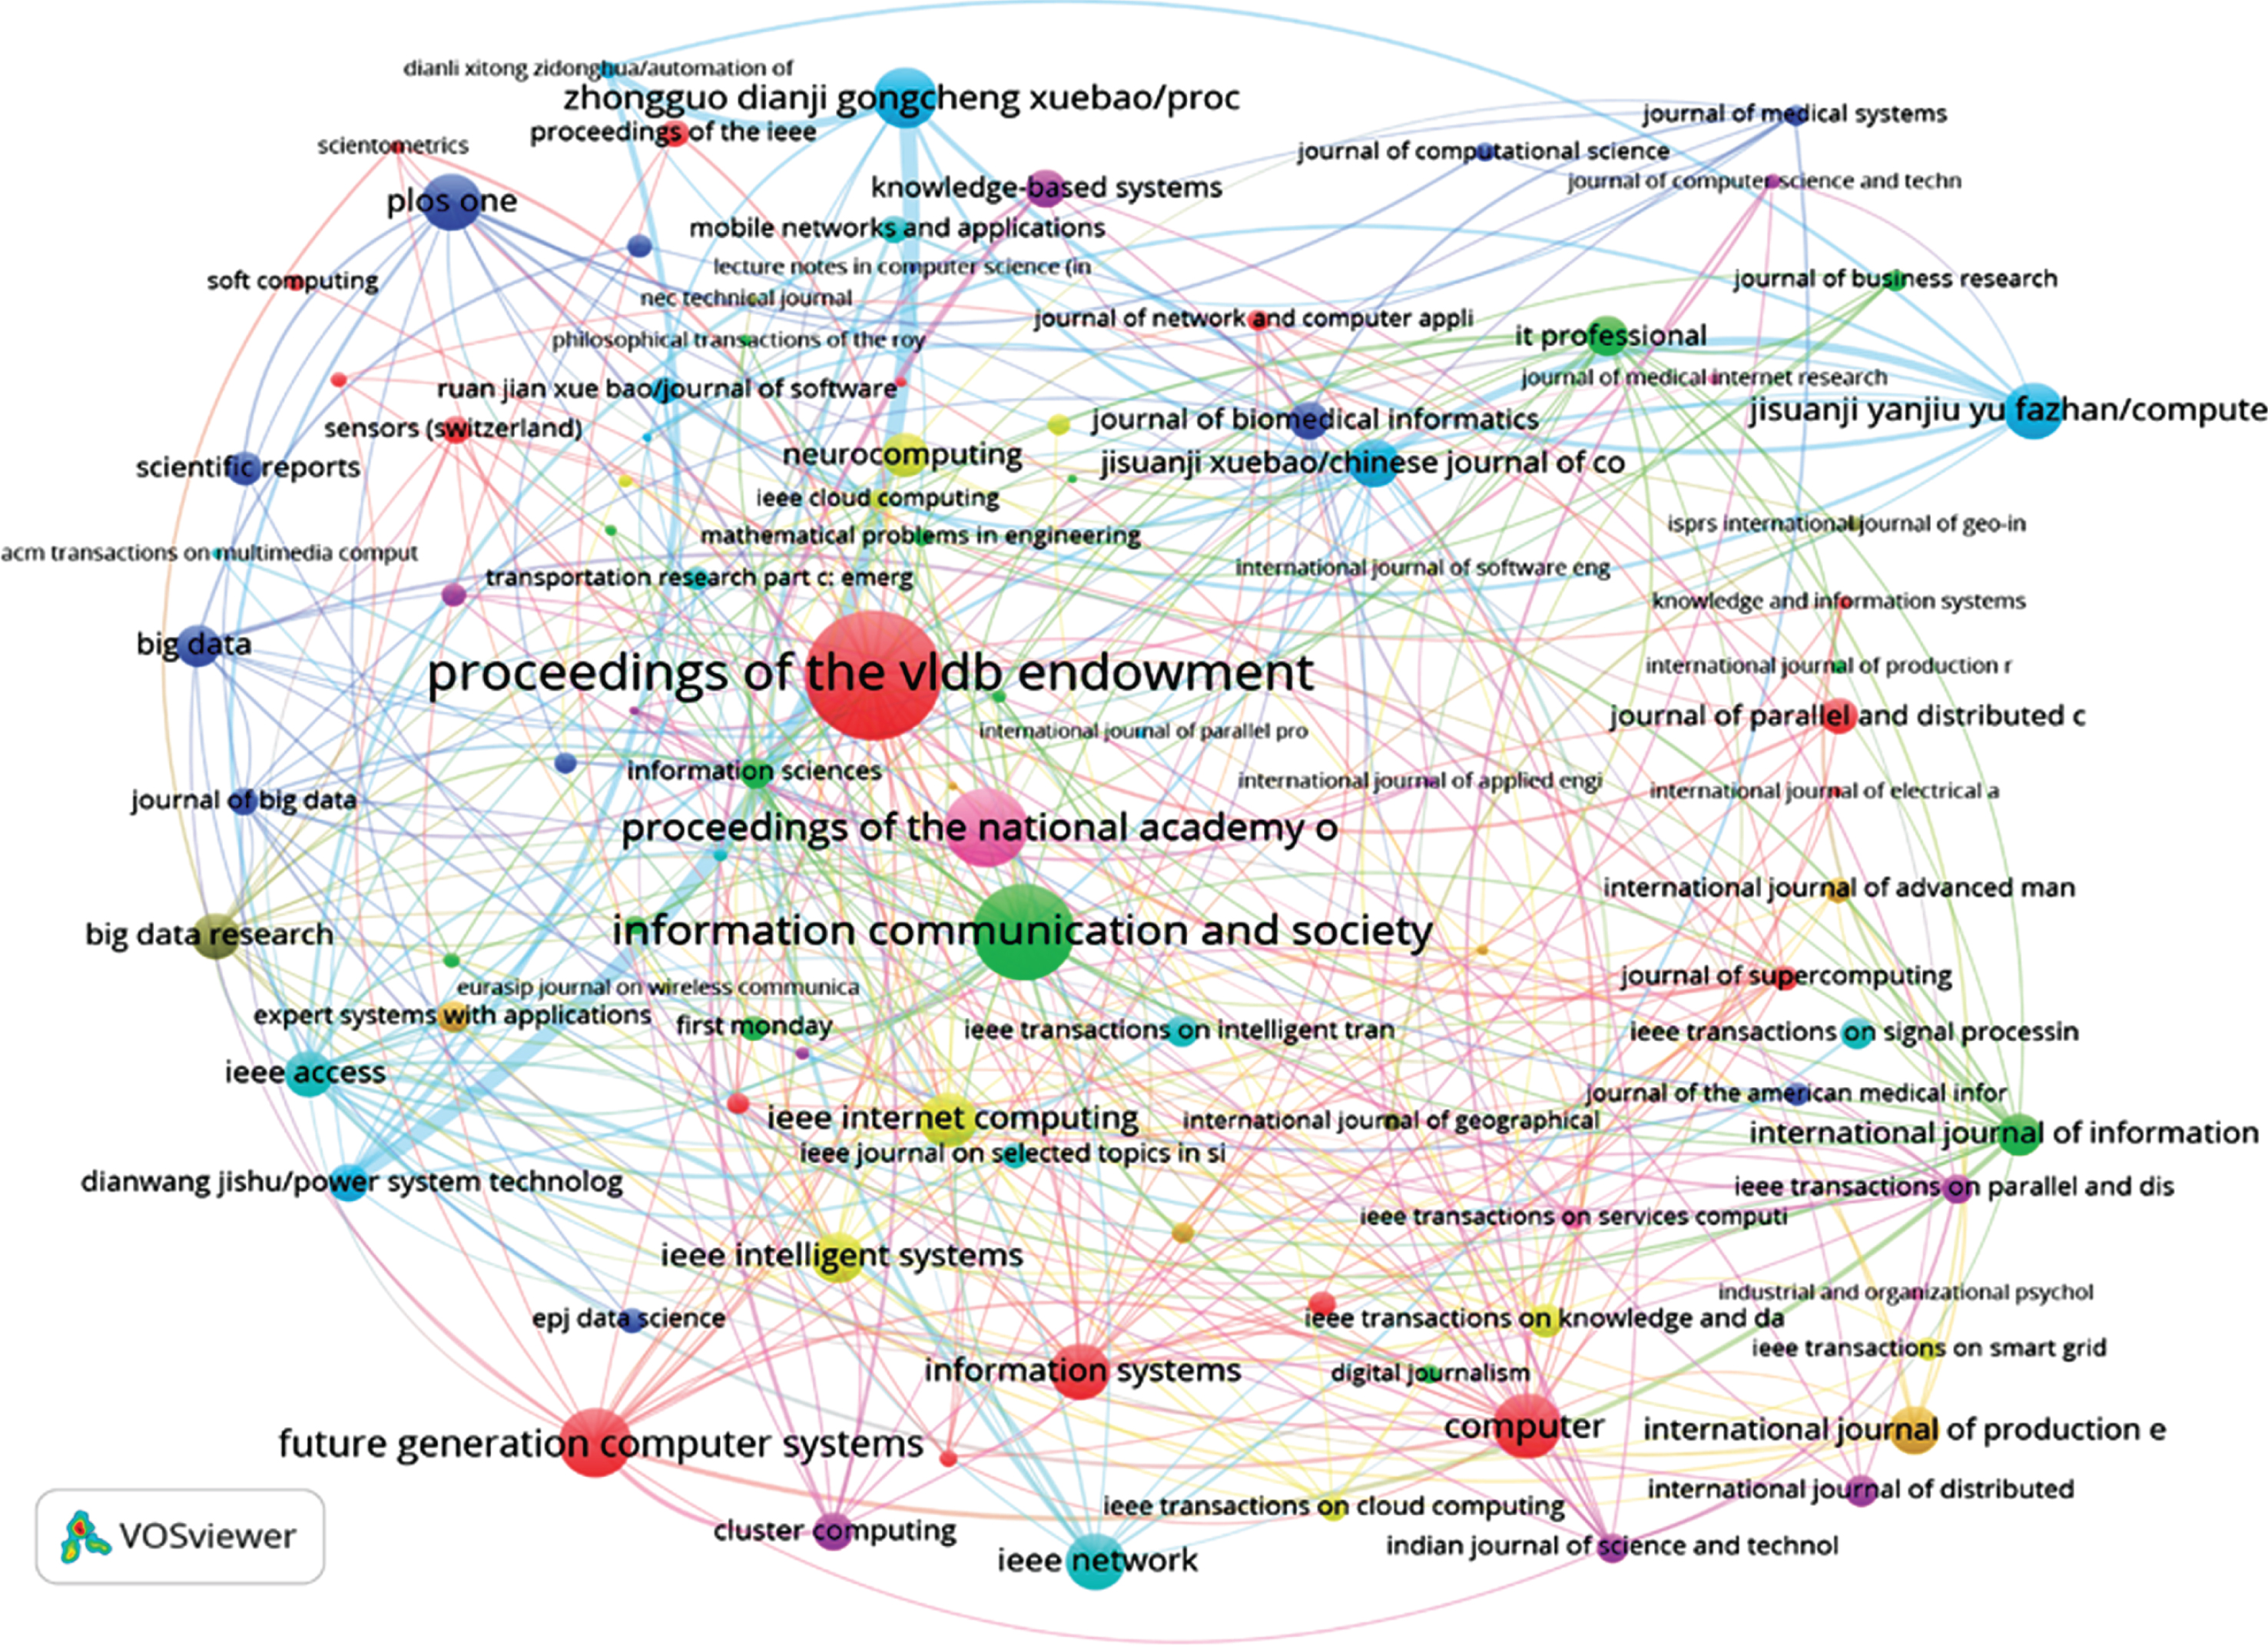
Overlay visualization of journal to journal citation relationship network.
We have also analyzed the research data downloaded to identify the major software platforms and architectures used in Big Data research. Since Big Data is primarily a multi-disciplinary field encompassing a number of disciplines, it has tools and platforms designed to address diverse applications ranging from government [33], policing [34], physics [35], chemistry [36], life sciences [37], finance [38], e-commerce, health care [39], drug discovery [40], and more recently sentiment analysis [41, 42]. The advances in the field has reached a point where researchers can predict about terrorist activities or decode human DNA or can even determine which gene has contributed the most for certain diseases and, of course, which click streams you are most likely to respond to. Table 9 lists some of the popular big data processing technologies, along with their basic architecture and description. Varied solutions for solving real-time issues in big data have been given, for instance3D terrain modelling [43], climate change [44] etc. Big Data will continue to grow horizontally as well as verticallyencompassing more and more naïve fields and in the time to come more and more technological platforms will be required by researchers. The data-as-a-service business model is around the sphere. Demand for more efficient and more effective algorithms is also emerging [45]. The current research in Big Data is no doubt a journey and not a final destination.
Some popular big data processing technologies
Some popular big data processing technologies
a http://hortonworks.com/apache/mapreduce/ b http://hadoop.apache.org/ c https://pig.apache.org/ d https://hive.apache.org/ e https://www.mongodb.com/ f http://nosql-database.org/ g https://hbase.apache.org/ h https://flume.apache.org/ i http://spark.apache.org/ j http://mahout.apache.org/ k http://hortonworks.com/apache/yarn/ l https://zookeeper.apache.org/ m http://oozie.apache.org/ n http://impala.io/ o http://hortonworks.com/apache/sqoop/ p http://storm.apache.org/
In this paper, a detailed analysis and mapping of research output on Big Data has been performed. The research output data from Scopus is used for a detailed characterization of the Big Data research. This paper presented analytical outcomes for year-wise growth of research output, country-wise output, country-level international collaboration patterns and authorship type & collaboration patterns by depicting the statistics and trends of the current status of research in Big Data. To begin with, the data has been arranged chronologically using frequency or percentile method. Prominent growth in the number of research publications has been witnessed in the last three years. It is observed that there is an inclination towards multi-author papers. Similar to other disciplines, collaborative research is predominant in Big Data field also. Other parameters like ACPP and h-index give an overview of citationanalysis and the trend of citation so far in journals as well as conferences.
In addition to standard parametric characterization, text-analytics based approaches have also been used to identify the discipline-wise research output on Big Data. Computer Science and Engineering have been identified as two major disciplines in this area of research. The research output has even been arranged for important control terms that grew in Big Data over the period of time. This bursty structure suggests that there is an ongoing trend in Big Data research since 2010 with major emphasis on ‘social media’, ‘cloud computing’ and ‘internet of things’. The country-wise analysis of research output shows the widespread geography of research in Big Data which is however dominated by United States and China (both in journals and conferences).US and China also have the largest number of inter-collaborative research works. The study also identifies major contributors to Big Data research. If quantity of research has to be seen, then ‘Chinese Academy of Sciences’ and ‘Tsinghua University’ produced largest number of publications in last seven years. However, based on the citation index ACPP, ‘Massachusetts Institute of Technology’ tops the journal publications’ list and ‘Chinese Academy of Sciences’ tops the conference publications’ list. Most productive source of journal publications has been ‘International Journal of Applied Engineering Research’ while the most cited journal is ‘Future Generation Computer Systems’. In case of conference publications ‘Lecture Notes in Computer Science’ has been the most productive as well as the most cited source. Big Data is now a growing and rapidly changing field of research which calls for involvement of multiple disciplines. It cannot be limited only to one particular field of interest. To our surprise, the research revealed that ‘Computer Science’ emerged as the most prominently researched Big Data field just a couple of years back.
For analyzing the interdisciplinary nature of research, text-analytics methods have been deployed. It is evident from the interdisciplinary collaboration network that ‘Mathematics’ & ‘Engineering’ have the strongest collaboration with ‘Computer Science’. Also, associated concepts have been discovered by performing co-word analysis.
It can be established that big data is an ever-growing field. And there is no single silver bullet to answer all the queries raised by Big Data scenarios. Big Data is an extensively probed area for which more is less. Similar to its definition, the ways to handle it also are multiple (volume), varied (variety) and ever increasing(velocity).This paper helps in understanding the genesis and characteristics of research in the area.