
Abstract
In this work, we propose a practical approach to access and visualize relevant information on the spatial distribution on the anything sample about its biochemical composition. In order to carry out this analysis, we use a Raman spectroscopy technique to obtain spectral maps with specific spatial resolution (1 and 5 micrometers) over a selected region of the sample. Our study relies on the application of a Principal Component Analysis on the cross-correlations between the spectral blocks measured, within a certain spectral window of interest. The associated values of these principal components are used to build low-resolution images (with the same spatial resolution of the Raman scan) in which the relevant information on the chemical composition is already encoded. Finally, the spatial resolution of the principal components images was numerically enhanced in the post-processing through standard linear interpolation algorithms. In this way, we can map and visualize, simultaneously, the spatial and spectral information. The results suggest that the Raman spectroscopy imaging is a powerful tool for determining the biochemistry of organic and inorganic samples based on spectral scanning and thus determine compounds concentrations of medical interest. The proposed methodology is rather general and it could be extended to other spectroscopic measurement techniques where the spatial mapping of the spectral information is needed.
Introduction
In recent decades, the implementation of digital imaging in biological systems has been used in order to make a simple display inspection of anatomical structures or biochemical composition for detection, diagnosis, and treatment of diseases [1–8]. The identification of this information through the use of images has been very beneficial in the areas of medicine and pharmaceuticals, because this may represent very specific characteristics through some combination of colors and intensities in order to interpret the results of a more easily [9–11]. Different techniques have been used for the generation of digital images in these areas of health to evaluate the anatomy and morphology of some biological systems of the human body or malformations associated with any cell disorder. Currently, the most commonly used techniques are the nuclear magnetic resonance, positron emission tomography, X-rays, among others [12–16]. These imaging techniques, however, allow access only the structural information of the object that being integrating digitally. In order to extract additional information in order to monitor, for instance, the physiological behavior of biological samples or the chemical content in pharmaceutical formulations, one has to use so-called functional imaging approaches, which involve the utilization of other degrees of freedom e.g., polarization or spectral shifts, in order to encode those non-structural aspects of the object under study. In this regard, spectroscopic techniques have proved suitable in recent years as an alternative for the non-invasive and non-destructive biochemical assessment in biological tissues [17–21]. In other case studies have been carried out spectroscopic mappings in a selected area, thereby generating images representative of this section under study on the spatial distribution of these spectral properties [22–26].
In this sense, several methods have been already proposed to extract valuable information about the spectral datasets. The main one in this work is to show the Principal Components Analysis (PCA). So, this method can analyze the data over the entire range of intensities that make up each one the recorded spectra [27–33].
This paper proposes an alternative methodology to generate Raman digital images with chemical spectrum information from scanning mapping. The methodology is based on the application of the PCA for verifying the mutual correlation that exists between all the spectra that make up the registered database in order to build images that encode the spatially-resolved chemical composition of the sample under study.
Materials and methods
Samples preparation and instrumentation
In this work a total of eight samples were prepared as follows, one blood serum sample was prepared to extract the spectral maps (The blood sample was extracted from a voluntary donor subject, and subsequently centrifuged to separate the blood serum). 20 microliters of serum were placed with a micropipette on a slide covered with aluminum foil and let stand for 15 minutes. Other sample was prepared with acetaminophen (commercial medicine) deposited on a silicon surface. Finally, six samples with different concentrations of ciprofloxacin (Excipient, 20, 40, 60, 80 and 100%) as an active ingredient were prepared including the excipient. In the case of ciprofloxacin samples, this reference compound was prepared from ciprofloxacin purchased from Sigma Aldrich (CAS 85721-33-1) in solid sample with a purity of >98%. A solution of HCl was added at±37.25% purity, thus obtaining ciprofloxacin hydrochloride. With this preparation, different mixed concentrations were generated in an excipient.
A Raman microscopy system Thermo Scientific DXR was used. The sample was focused with an integrated microscope through a 50X objective. All spectral dataset was recorded by using a laser source of 780 nm, 24 mW of power and 50 s of exposure time were used for each spectrum. Table 1, summarizes the spectral acquisition parameters used for each sample.
Parameters used in the spectral scan for each analyzed sample (blood serum, acetaminophen deposited on a silicon surface, ciprofloxacin and excipient)
Parameters used in the spectral scan for each analyzed sample (blood serum, acetaminophen deposited on a silicon surface, ciprofloxacin and excipient)
All spectral data processing was performed using MATLAB software. Raw spectra were processed by carrying baseline correction, smoothing and normalization to remove noise, sample florescence, and shot noise from cosmic rays, through a filter based on the baseline correction with asymmetric least squares smoothing algorithm [34]. Subsequently, MATLAB was used to implement the data compression technique: PCA.
Data transformation
PCA is a multivariate ordination technique used to display patterns in multivariate data. It is a data analytic and hypothesis generating technique that is intended to describe characteristic patterns in a dataset and to expressing the data in such a way as to highlight their similarities and differences. It has a range of applications other than data display including multiple regression, and variable reduction.
In short, PCA is to find orthogonal transformations of the original variables to get a new set of uncorrelated variables called principal components, obtained in decreasing order of importance.
For the image construction, we start from the matrix ψ, which it was the result of spectral scanning over the region of interest, and where δ1, δ2, …, δ n are the total spectra recorded on the mapped region. u, v, w represent the intensity values for each Raman spectral shift.
All variables (δ
n
) were evaluated to build the covariance matrix β, to obtain a correlation matrix between the spectral registered groups.
From this correlation matrix(β), eigenvalues were obtained which allowed us to generate major components.
This way, a matrix of component values (ξ) was calculated for each spectrum recorded in each (i, j) coordinate.
With this methodology, it is possible to select any principal component to generate the image. In order to have only positive values, each value of each coordinate component was normalized.
The new matrix of numerical data(ρ), were transformed into whole number values between 0 and 255, representing a level of intensity to build a digital image (Γ) of 8 bits.
Up to this point, the matrix Γ already encodes information on the chemical composition of the sample. However, the number of elements in the matrix Γ is the same as the number of discrete positions in the Raman scan. Thus, Γ can be thought as a sparse image with low spatial resolution (same spatial resolution as the Raman scan). In order to correct for this and provide better visualization, we enhanced the spatial resolution numerically in the post-processing by re-sampling the matrix Γ through standard linear interpolation algorithms. In this way, the resulting images can have softer transitions and better resolution for each region analyzed without the need for finer Raman mappings.
The silicon sample combined with acetaminophen was analyzed in a region of 50 × 50 μm with a spatial resolution of 1μm (Fig. 1A). The 2500 spectra were processed (Fig. 1B), and each major component value was transformed to a representative 8-bit value to generate each pixel making up the digital image (Fig. 1C). When the resulting image is spliced onto the scanning region, the boundary contours between acetaminophen and silicon can be clearly verified (Fig. 1D).
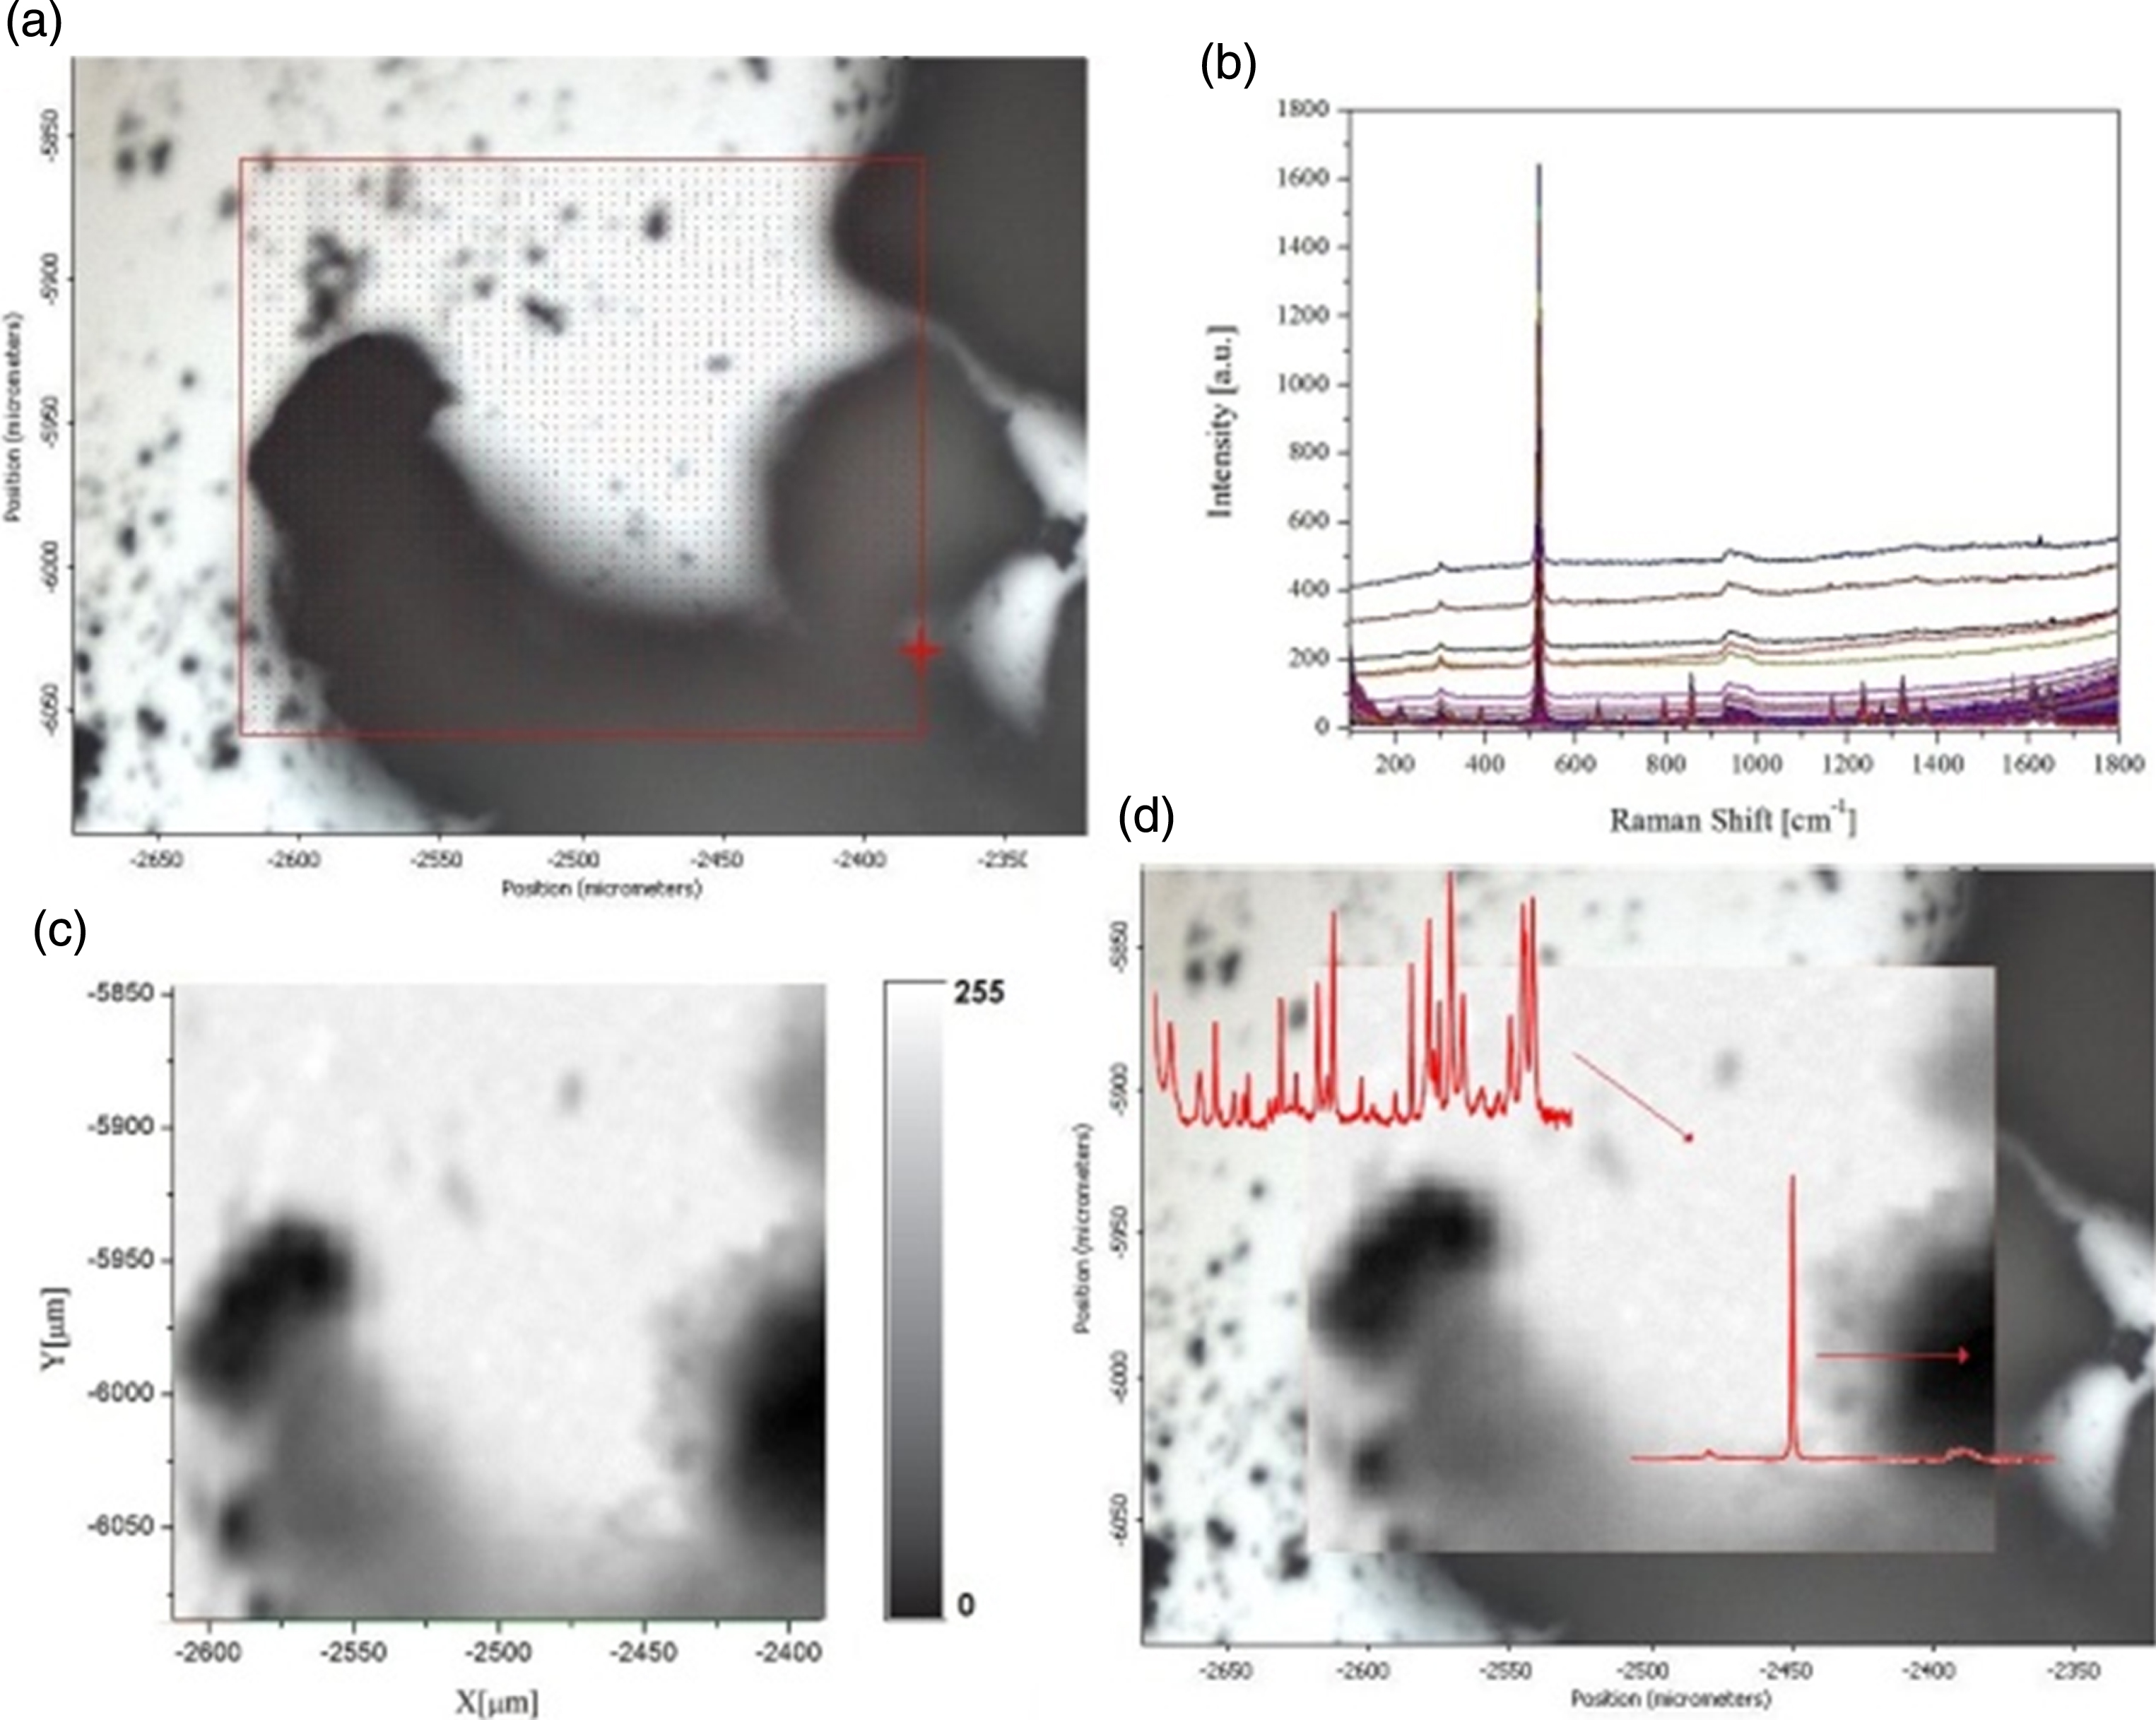
Acetaminophen sample deposited on a silicon surface. A. Mapping region over the red box (50×50 microns), B. Raw spectra recorded with a spatial resolution of 1μm per pixel, C. image generated using the first principal component, D. Image superimposed on the mapped region.
The second sample analyzed was 40 × 35 μm of blood serum under a resolution of 5μm. It was sliced to observe the resulting image of these divisions (Fig. 2A). As shown in Fig. 2, the 56 spectra were processed (Fig. 2B), and each principal component value was transformed into a representative value of 8 bits to generate each pixel that make up the resulting image (Fig. 2C). Again, by splicing the resulting image onto the sweep region, we can observe the coincidence in the contours of the border between the cuts of the blood serum sample (Fig. 2D).

A drop of blood serum deposited on an aluminum surface. A. Mapping region over the red box, B. Raw spectra recorded with a spatial resolution of 10μm per pixel, C. image generated using the first principal component, D. Image superimposed on the mapped region.
The development of this procedure allows us to evaluate the entire spectrum spectral range, or to select regions of interest and associate them with molecular vibrations of certain molecules. To do this, we selected three regions of the spectral block obtained of the blood serum sample (Fig. 3A). These regions correspond to the range of shifts from 990 to 1005 cm–1 (R1: Region where there shift associated with phenylalanine: 1002 cm–1, Fig. 3B), from 1413 to 1481 cm–1 (R2: phospholipids associated region, Fig. 3C) and from 1611 to 1712 cm–1 (R3: range Associated with the amide I, Fig. 3D) [35]. The PCA was applied to each selected block and the first principal component was used to generate the representative image for each region evaluated.

Spectral analysis by regions of interest. A. Raw spectra recorded. Spectral sections selected: R1, R2, and R2, B. Image generated for R1 region: peak associated to L-phen, C. Image generated for R2 region: peak associated to phospholipids, D. Image generated for R3 region: peak associated to amide I.
Each image generated for each range of landslides allowed reconstructing the sweep image and observing the borders in each section of the sample. The interpretation for the color scale indicates that the white color represents the null presence of these organic biomolecules associated with the molecular vibrations in each analyzed range. Otherwise, for the other end of the scale, the presence of dark color gives us an estimate of possible high concentrations of these organic compounds. The improvement of the images was carried out through a standard linear interpolation. The result obtained by applying this algorithm can be verified in Figs. 1–3, where 8-bit color images were obtained from the first principal component. Figure 1C shows the sample corresponding to the preparation of acetaminophen and silicon, and in which it is possible to verify each compound. Here we can observe that the regions in dark color correspond to the spectra that were registered with greater intensity, that is, for this case they corresponded to those of silicon. On the other hand Fig. 2C corresponds to the blood serum sample, and which was focused on a region that had a bifurcated cut in order to observe this bifurcation (this image was generated using the entire spectral range from 200 to 2000 cm–1). For this case, the spectra that mostly showed a greater intensity in the peaks were recorded in the area with the diagonal cut. Finally Fig. 3B, 3C and 3D, were constructed individually from the main component 1, and also generated in the range of 990 to 1005 cm–1 (Vibration associated with phenylalanine), from 1413 to 1481 cm–1 (Phospholipids) and from 1611 cm–1 to 1712 cm–1 (amide I). In these last images, we associate the region with greater intensity to a presence or greater concentration of this type of biomolecules.
To evaluate the algorithm, we selected a sample of ciprofloxacin, which is an antimicrobial agent belonging to the group of quinolones. This second generation substance has greater activity, in addition to fewer adverse effects than the first generation. Its mechanism as mentioned above interacts in the bacterial cell from the DNA-gyrase, which is more sensitive in the large negative organisms in a fast way and the topoisomerase IV, more sensitive to gram-positive cells more slowly. They have been widely used for the treatment of intra and extra-hospital infections, becoming a very important resource for developing countries due to the high availability of generics that drastically reduce the cost of treatment. Its effectiveness is due to its high bioavailability, level of safety and the way of administration [36–38].
In order to verify the changes in pixel intensities in each image generated for each sample (0, 20, 40, 60, 80, 100% of active substance), which should be associated with the concentrations of ciprofloxacin. We generate a matrix of spectra for all prepared concentrations including the pure excipient. The PCA was applied to a selective region from 1593 to 1652 cm–1 shown in Fig. 4, and where it can be seen that the intensity of the peak increases as a function of the concentration of the active principle (ciprofloxacin). PC 1 was taken to transform each of the values into pixel intensities. In Fig. 5, we can verify the change of tonality in the pixels when the samples were analyzed from the pure excipient (without active substance), and up to the highest concentration at 100% (only active substance).
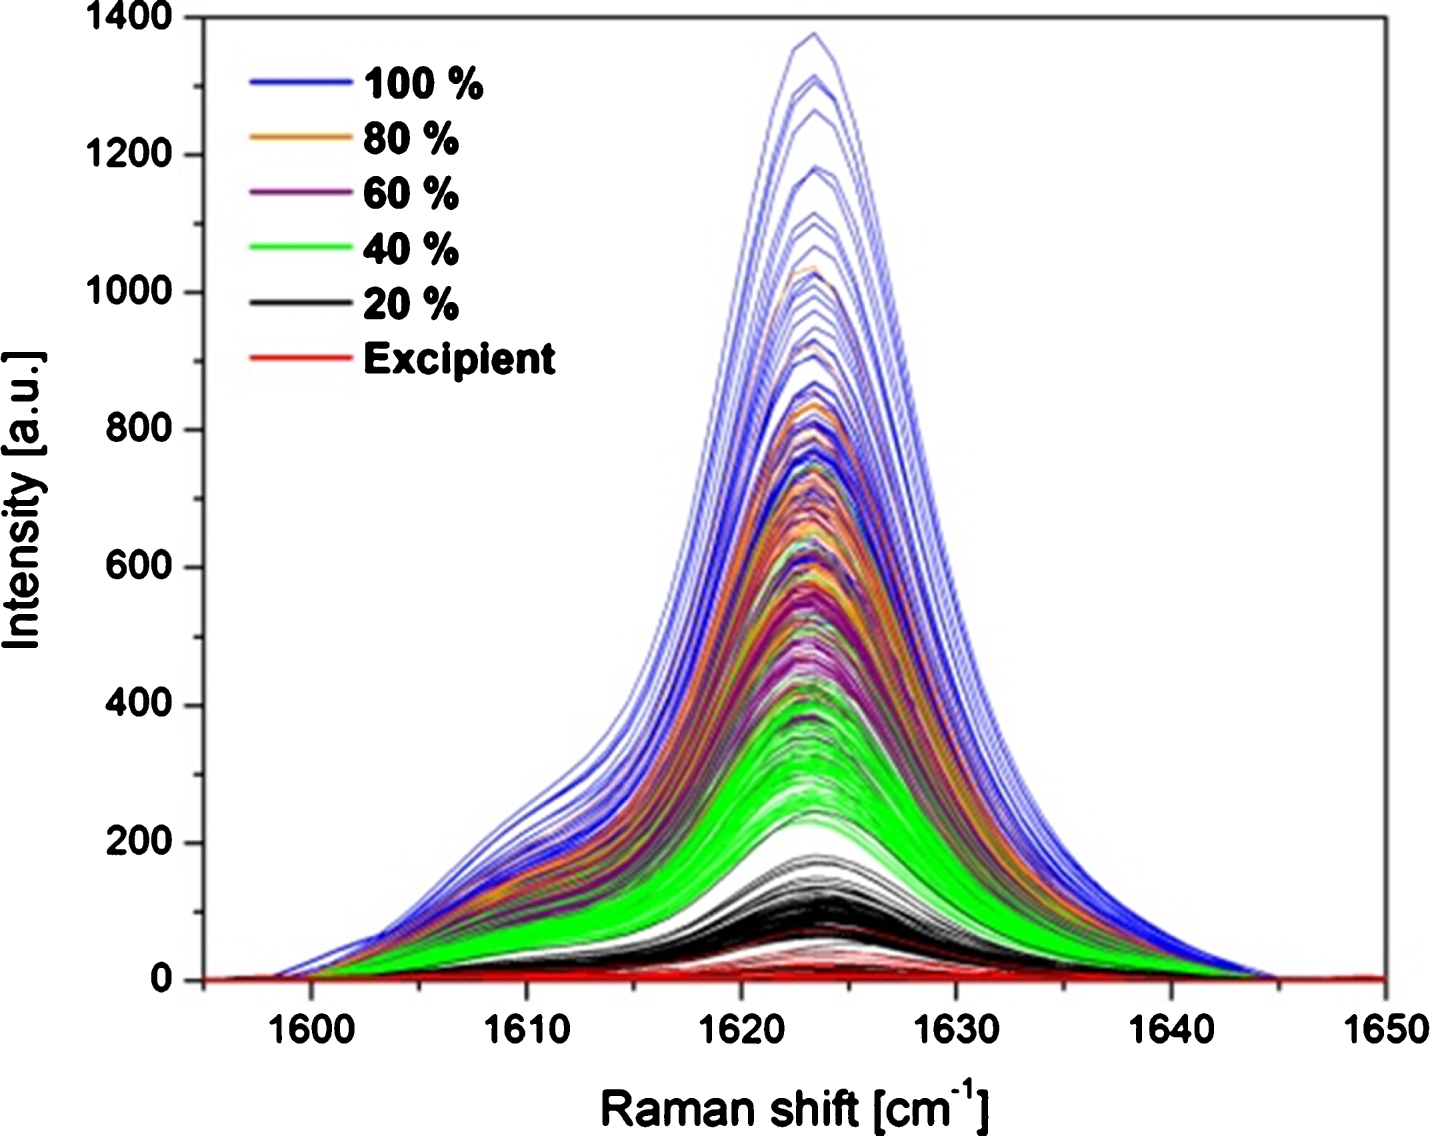
Spectral processing. The selected region of the ciprofloxacin spectrum between 1593 and 1652 cm–1 to evaluate the PCA.
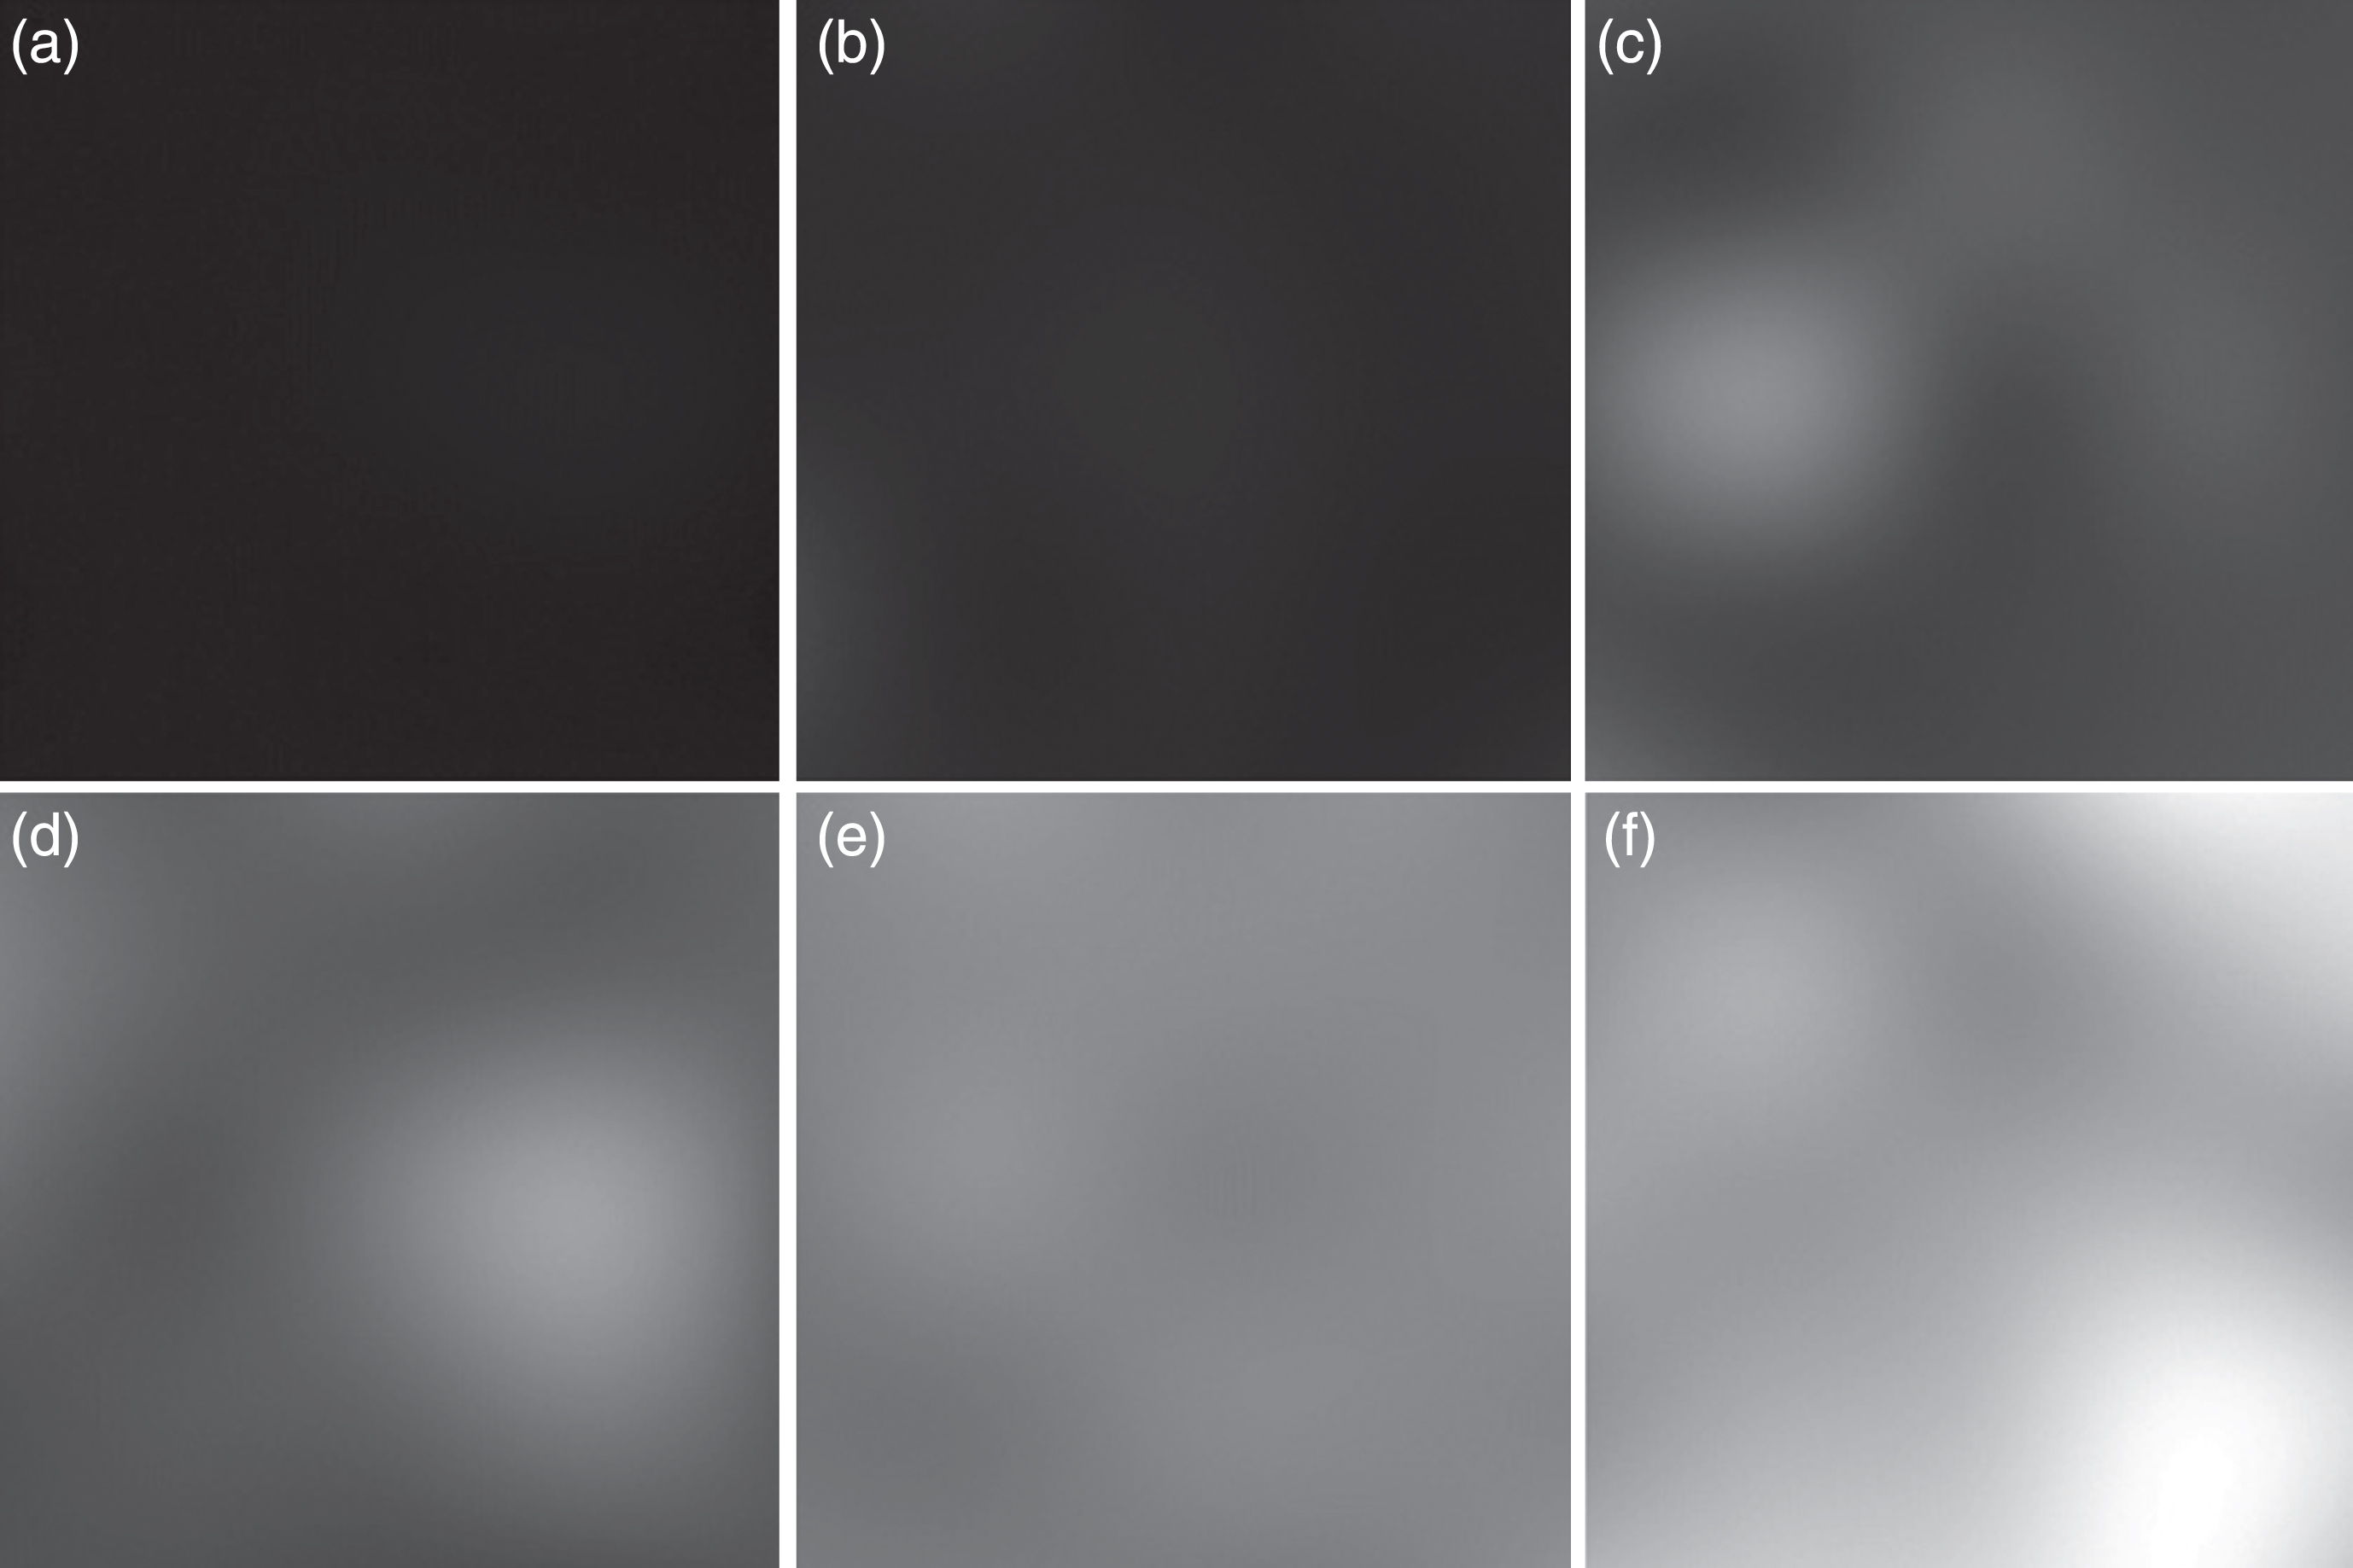
8 bit image generated. A change in the shade of gray is observed when there is a concentration variation in the active substance. A. Excipient, B. 20%, C. 40%, D. 60%, E. 80%, F. 100%.
In addition, a predictive model of the different active substance concentration was elaborated from the PCA by means of a linear discriminant analysis (LDA). The performance of the models is represented by the receiver operating characteristic (ROC) in Fig. 6. The ROC curves are a graphic representation of sensibility vs specificity and all values for each model are presented in Table 2.
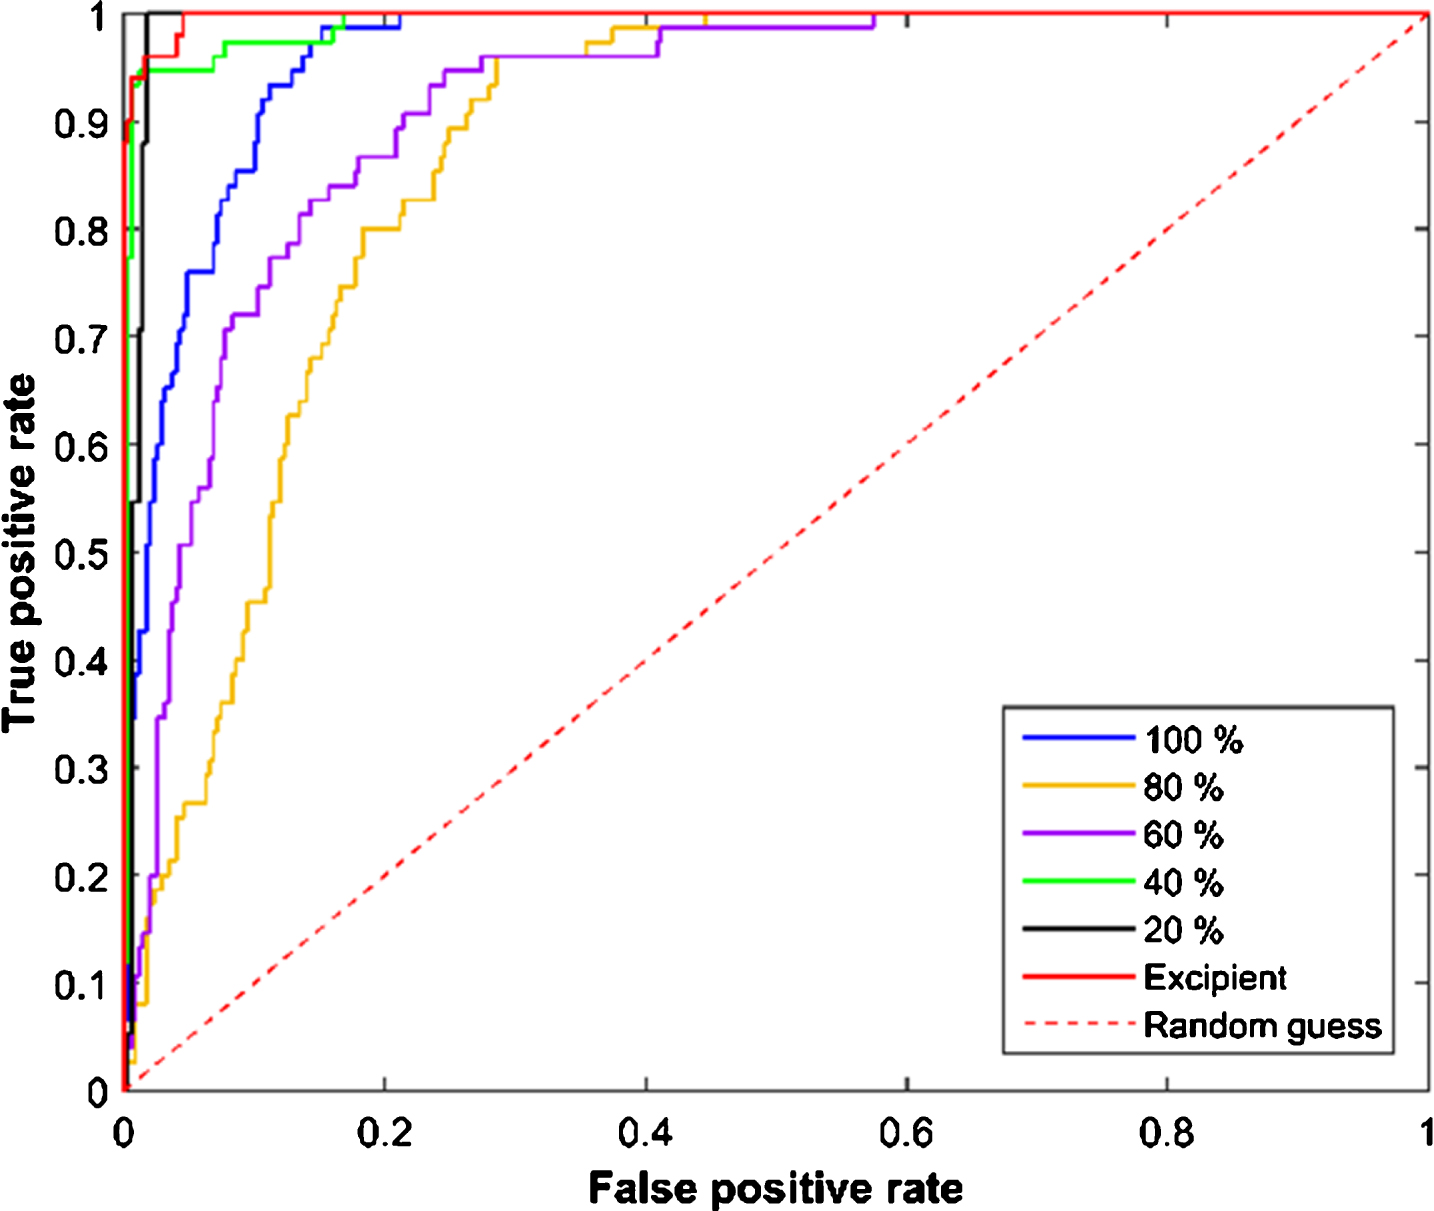
ROC curves from the LDA models for different concentrations of active substance.
Sensibility and specificity values (%) for all different substance concentration (%) models
In this article, we proposed a methodology for processing a collection of spectral maps, which are obtained with a standard Raman microscopy setup, based on the application of a PCA on the mutual correlations between the different spectra recorded. Additionally, we implemented some image processing algorithms in order to numerically improve the spatial resolution of the final images by means of standard linear interpolation. PCA is a statistical tool that is usually applied to spectral processing. The PCA is a statistical tool that is very useful for the processing of large-scale data, such as databases of Raman spectra that are recorded from scans in regions of interest. In this work, an 8-bit image was reconstructed from these Raman mappings. It was also possible to carry out an analysis of PCA in regions of interest to verify in an image the distribution of greater intensities associated with certain biomolecules.
Although there are a lot of algorithms to reconstruct, this methodology is very simple to implement and adjust to the needs that the end user desires, compared to other software applications that are included in some Raman systems, which is impossible to adjust the parameters regarding the generation of images.
As a future work, it is the calibration to be able to quantify some parameter of medical interest, and even pharmaceutical to identify adulterated or falsified drugs.
Compliance with ethical standards
Conflict of interest: The authors declare that they have no conflict of interest.
Founding: This study was funded by research and post-graduate secretary of the Instituto Politecnico Nacional for financial support through the SIP 20171217, DAIP/proyect-2016/59023 and ICyTDF/225/2012.
Ethical approval: The serum sample was collected from a healthy voluntary person, with a letter of consent and only for research use.