
Abstract
Extracting repeated unknown maneuvers or patterns preformed by a human operator in a cyber-physical systems can lead to better understanding of the behavior of the human operator who is controlling or sharing tasks with dynamical systems. These repeated maneuvers can be extracted by analyzing the inputs and outputs of the human operator using control theory and data mining tools. In this paper, we introduce geometrical shape-based pattern detection approach for input-output data. A pattern or a maneuver is defined as the maximum repeated behavior in time series trajectory data that is generated from the operator’s inputs and outputs. A two-phase algorithm is developed in this paper, the first phase consists of trajectory segmentation, creating segment fingerprint, clustering, and symbolic representations. The second phase of the proposed algorithm is pattern extraction phase, which is inherited from the motif finding algorithms in time series data and DNA sequences.
Introduction
Nowadays, humans are interacting with machines in every aspect of their lives, either actively controlling the machine or passively getting served by them. Human-machine interaction is frequently described in the literatures as human-in-the-loop [1–7].
Human-in-the-loop application is said to be Active if the system, the machine or the device is controlled fully or partially by a human operator through some control inputs. However, A passive human-in-the-loop application refers to the case when the human is monitored or even controlled by the machine. In the active human-in-the-loop setup, the human observes the output of the system through, for instance, a display in which he or she can view all the required information to update their control actions or their decisions. This is typical feedback interconnection control of a dynamic system (the plant) and a controller (the human) see Fig. 1. Therefore, the active human-in-the-loop can be modeled as an input-output system, similarly as any dynamical system. This has lead to the development of several dynamical models that mimics the human operator’s behavior in human-in-the-loop applications.
Human in the loop control system.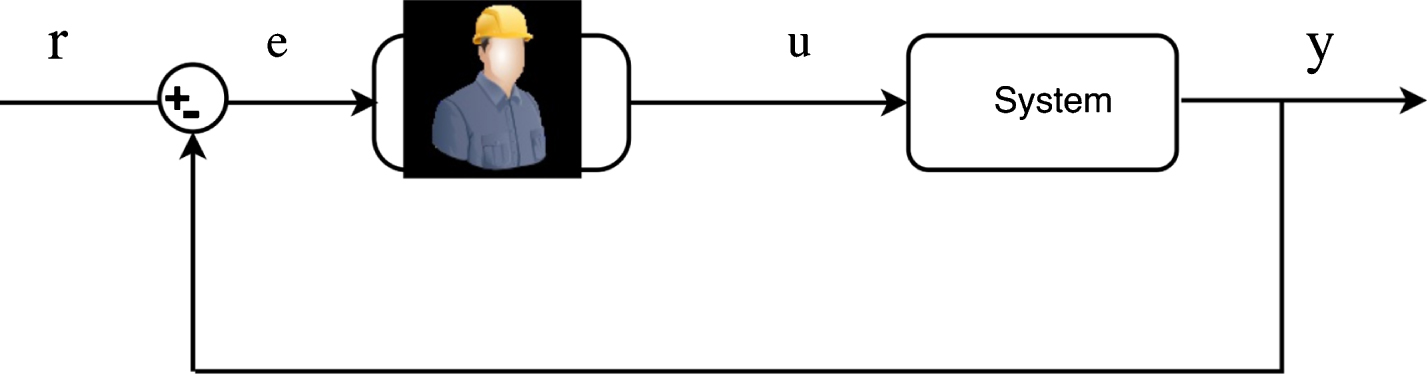
One important direction of human-in-the-loop research is the study of skill transfer between the skills of human operators and autonomous systems [8–10], where autonomous systems such as robots have the opportunity to learn the operator’s skill in order to achieve a particular task. Also, shared control between robots and humans is another human-in-the-loop application, where a rich research questions such as co-adaptation between the human and the robot are raised. Furthermore, the behavioral and social change of humans while working and cooperating with different levels of intelligent systems is another important area where the concept of man-machine systems is presented[11–15].
The term behavior is defined as a set of temporal changes in neuromuscular and physiological activity that can last from a few milliseconds (a blink) to minutes (talking) or hours (sitting) [16]. Examples of this behavioral signals include attitudinal states (e.g. fear, joy, inattention, stress), manipulation (actions used to act on objects in the environment). Understanding human behavior is done by translating the their behavioral signals in particular context descriptors into a description of the given behavior. A repeated behavior that appears regularly and tends to occur unconsciously is called habits. In other words, it is a pattern of behaviors that an operator repeats constantly sometimes without thinking about it. Also, habits are formed of a cue or a signal, and a routine or automatic response such that, when the cue appears, the response is being triggered.
One way to understand the behavior of a human operator in a cyber-physical system is to analyze his inputs and outputs signals from a control theory and data mining perspective to mine for the repeated habits or behaviors in such signals. Finding unknown repeated behaviors or patterns can lead to better understanding of operator’s action in a particular situations. Also, mining the repeated behaviors of skilled operators can be used as a benchmark for teaching either other human operators or autonomous systems. Furthermore, detecting repeated habits or behavior is an essential stage to build personalized control systems that learn the operator’s behavior with time and build a model for that particular operator and adapt accordingly.
In this paper, we introduce a method for repeated pattern detection in position-like trajectories. The proposed method is suitable for pattern detection in position trajectories of moving objects in 3-dimensional space or 2-dimensional plane. Also, the proposed method is suitable for pattern detection in smooth control output trajectories generated by human operator inhuman-in-the-loop applications. The prosed algorithm is based on a geometrical shapes of the patterns in a given inputs-outputs data. The algorithm operates in two phases, the first phase consists of trajectory segmentation, creating segment fingerprint, clustering, and symbolic representations. Then, the second phase of the proposed method is the pattern extraction phase. The second phase is inherited from the motif finding algorithms in time series data and DNA sequences.
The paper is organized as follows; in Section 2, a brief introduction for pattern detection in time series trajectories is given. In Section 3, the problem formulation is presented. Segmentation method of time series data presented in Section 4. Section 5, presents the construction of a feature vector that uniquely define and describe the segment with significantly less dimensions. Section 6, provides some results and discussions of the proposed methods in human in the loop applications.
A time series data is a recorded measurement that is measured at successive time intervals [17]. Such data can be found in many disciplines such as economics, medicine, biology, engineering and chemistry, to name a few [17]. Pattern detection can be defined as the process of mapping or classifying input data into classes based on some key features. Classification methods in pattern recognition can be ether supervised and unsupervised classification.
Finding a known patterns in a time series trajectory has received great attention and can be considered as a solved problem. However, on the other side, if the pattern that we are looking for is previously unknown, this is still considered as an open problem [18]. Unknown patterns in time series is known as "motifs" [19–22]. The problem of motif finding can be related back to the 1980s, when the bioinformatics researchers were focusing on discovering patterns in DNA and protein sequences [19–21]. This lead to several methods and algorithms [22]. The motif finding problem then shifted to in real-valued time-series data.
Pattern detection in trajectories of moving object has become the focus of many research areas such as geographic information science, human machine interaction and behavioral sciences [23]. Mining such unknown patterns in trajectories of moving object can offer a great help to discover the similarities between the movement of different objects as well as the repeated conman behaviors from the same or different types of objects.
One of the main challenges in pattern detection in time series data is how to compare two sub-trajectories, i.e., how to measure the similarity/dissimilarity between two time-series trajectories. There have been numbers of measures in the lectures in time series data in general [24], such as dynamic time warping (DTW) and longest common subsequences (LCSS). However, most of these measures are similar in a sense that they are essentially dealing with individual data points composing the time series [25].
In this paper, we propose a new geometrical shape-based measures or features for each segment of the time series data. These measures or features is be used as a feature vector in pattern recognition for the given trajectory data. One of the advantages of our proposed method is its invariant to the dimensionality of the data. Another advantage of the proposed method is the dimensionality reduction for given data set, which reduces the computational effortneeded.
Problem formulation
Given a trajectory of time series data U thatrepresents a time stamped points u i = (p i , t i ), where t i > 0, p i ∈ R m , i = 1 to N, and N is number of data points in U. Define a segment S i to be a sub-trajectory consists of a set of points {(t i , p i ) , (ti+1, pi+1) , (t c i , p c i )} as a subset of length i - c i of the trajectory U. Also, define a maneuver to be sub-trajectory that is repeated k times within the trajectory U. It is also assumed that the maneuver consists of a set of segments S j . . . Sj+k with minimum length L min .
The problem statement is given as follows: given a time series trajectory U, find the set of maximum maneuvers or sub-trajectories that at least repeated more than or equal to k times.
Segmentation of time series trajectory
Segmentation Segmentation of time series data implies dividing long time series sequence into a set of discrete, homogeneous, possibly meaningful segments in order to perform more analysis and reveal the underlying properties of such sequence. Segmentation is considered as a preprocessing stage in data mining and analysis techniques of time series data.
Time series data segmentation can be viewed in several ways [26] as follows: For a time series sequence U, find the best representation possible using K segments. For a time series sequence U, find the bestrepresentation possible such that the maximum error for any segment does is less than athreshold, For a time series sequence U, find the best representation possible such that the combined error of all segments is less than some a threshold.
There are several algorithms proposed in the literature such as change-point detections [27], sliding windows, bottom-up, and top-down methods [17, 26]. These methods are used across domains such as DNA segmentation [28], and image processing [29].
A spatio-temporal trajectory is a trajectory that defines the location of a moving object in their geographical space either in the 3-dimensional space or 2-dimensional plane with the timestamp associated with the location of the object. Position trajectory of moving objects can be considered as a special case of time series data in two or three dimensions; see Fig. 2. In [30], several trajectory segmentation methods were proposed, which takes into account the geospatial and temporal structures of the trajectory.
Spatio-temporal space for time series trajectory.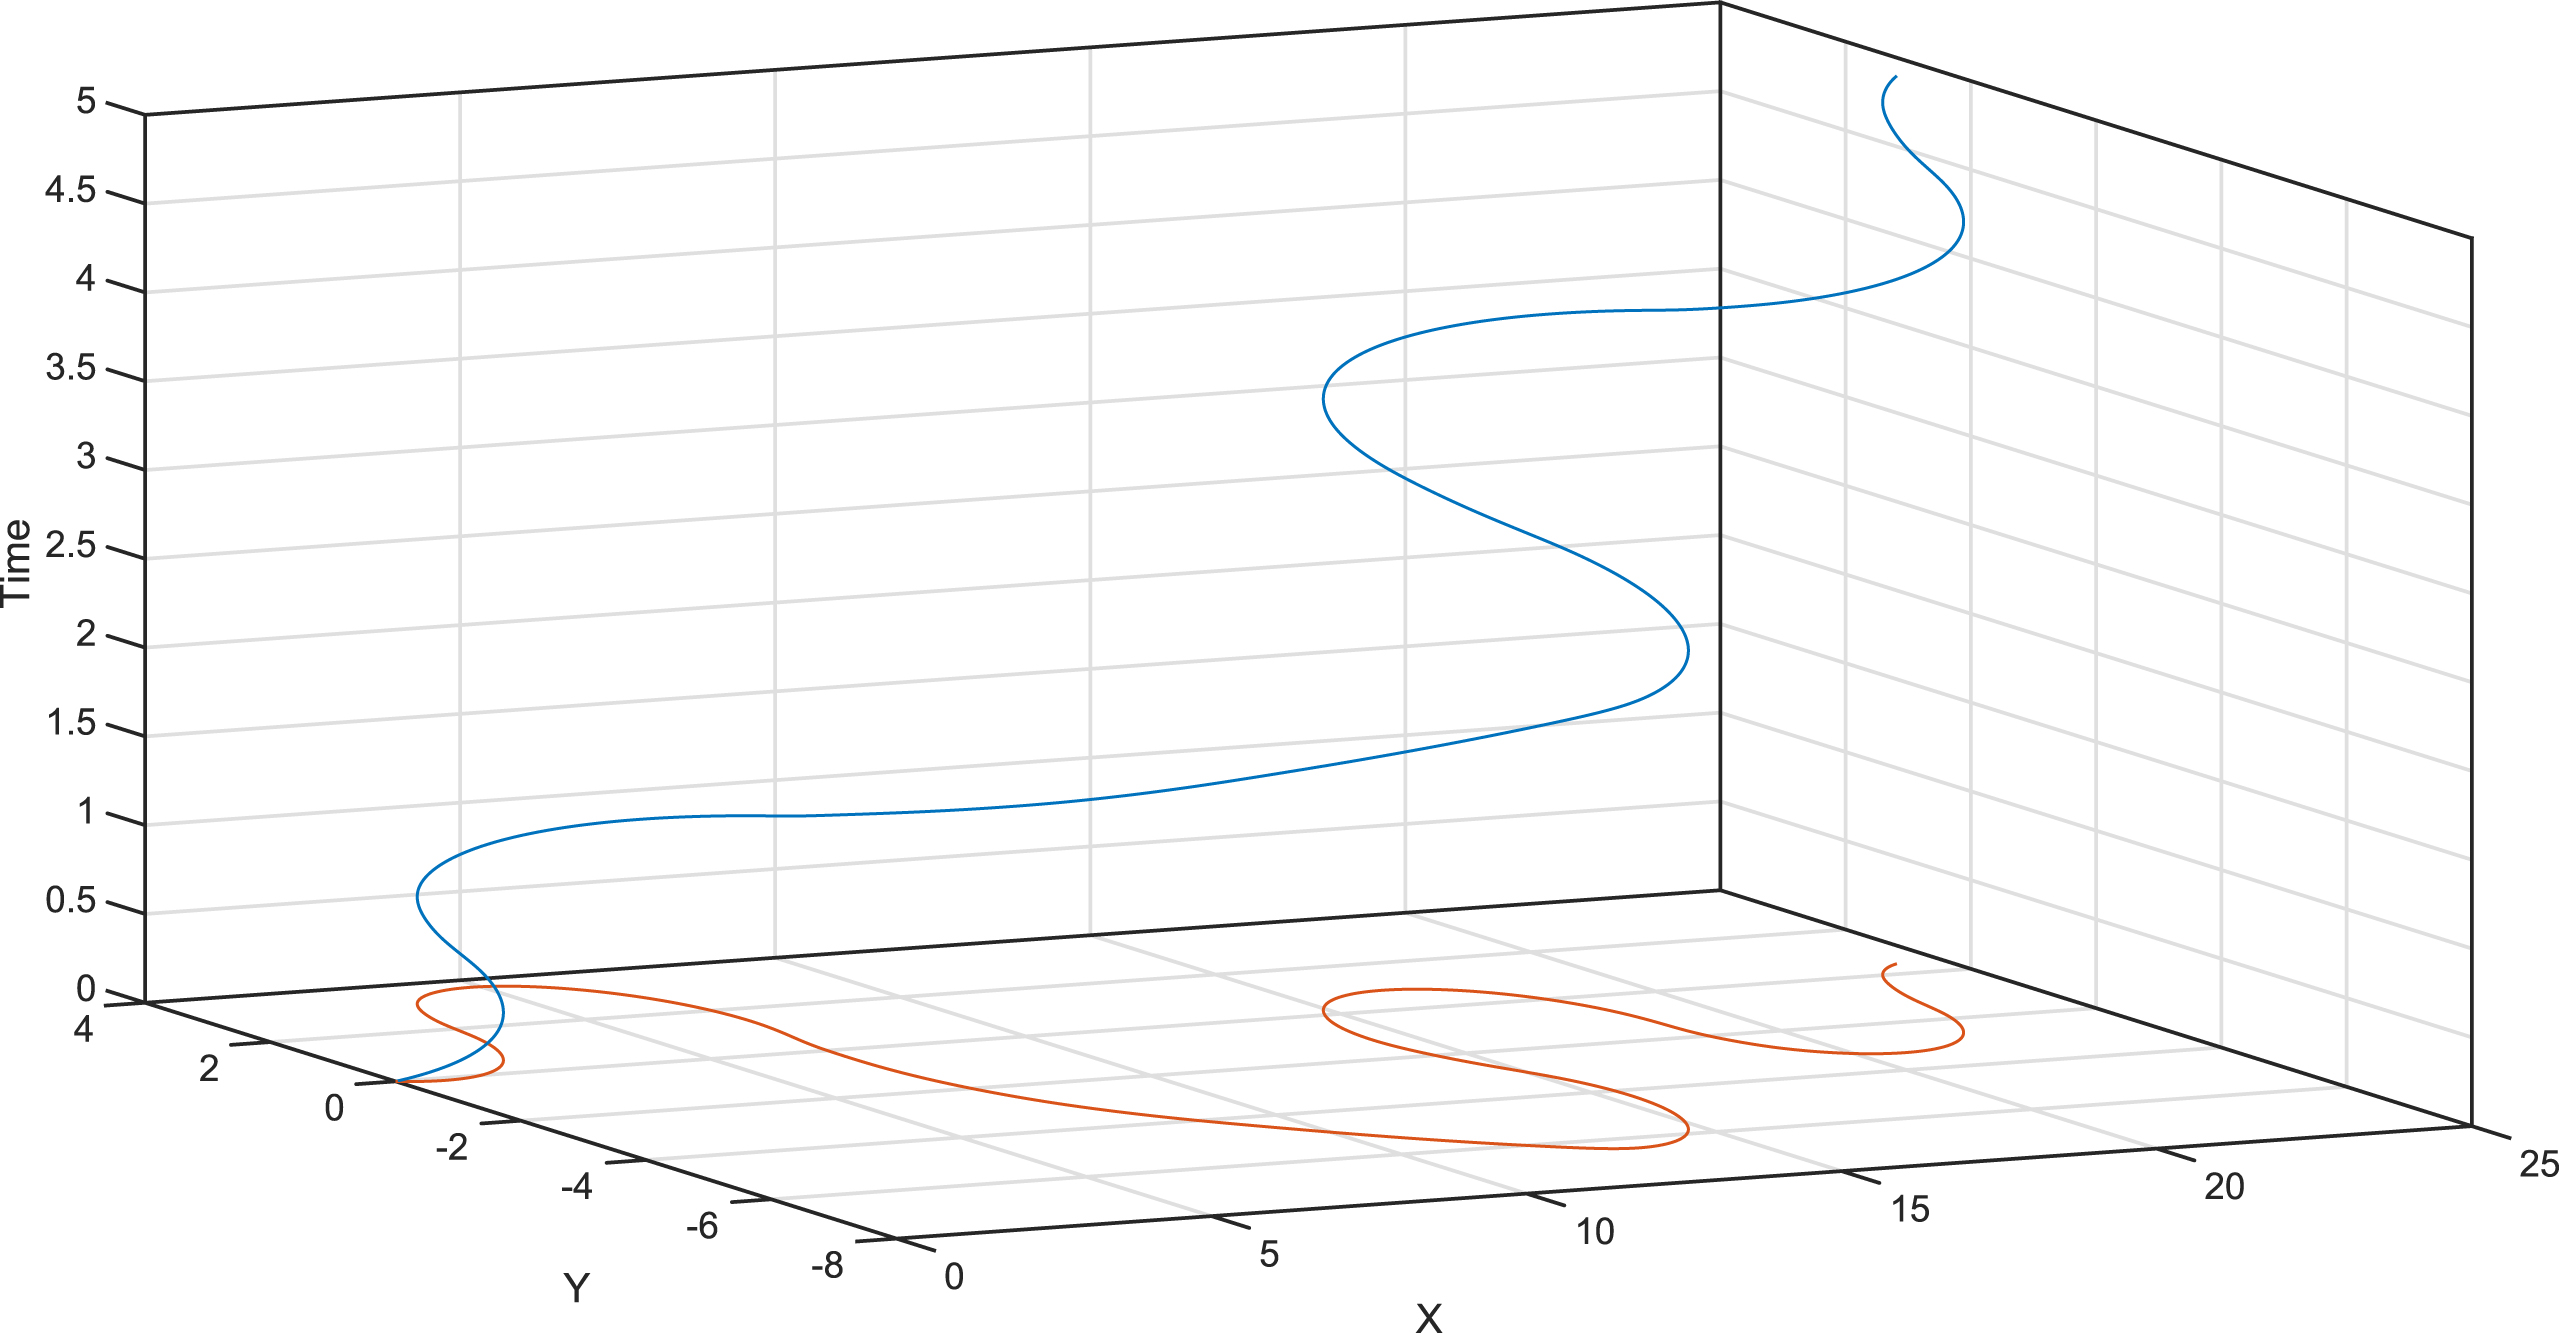
In this paper, a sliding windows segmentation algorithm is used in order to segment the time series trajectory U. The resulting segments are used in the next step to create a fingerprint or feature vector for each segment.
Segment’s fingerprint here means a feature vector that uniquely defines and describes the segment with significantly fewer dimensions. The aim of this feature vector is to be used as a similarity measure between different segments.
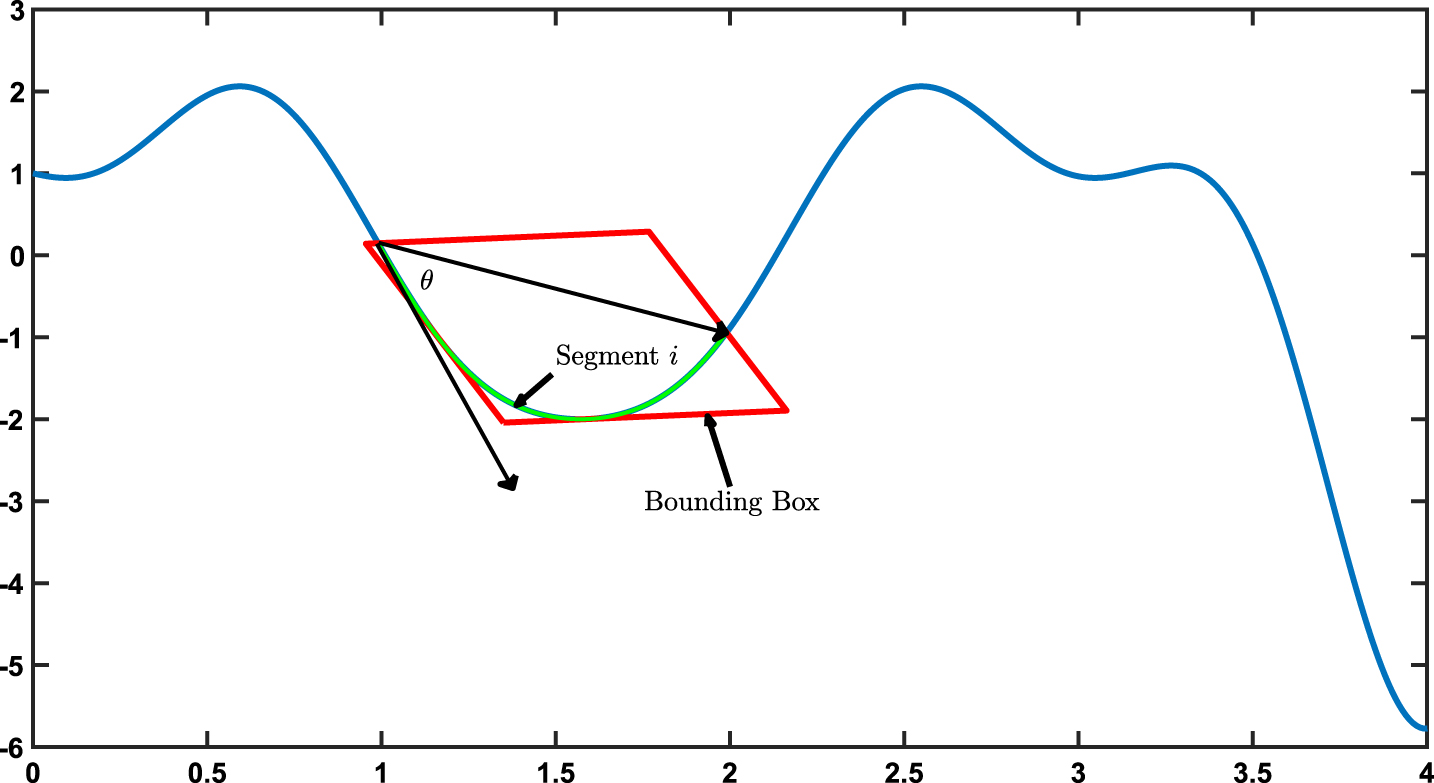
In this paper, we propose geometrical shape-based measures to create a feature vector to defines each segment, see Fig. 3. The feature vector consists of the following measures: The arc-length of each segment, which is computed using a linear chordal approximation, or for more accurate approximation, a parametric spline approximation can be used, then integrate the segments numerically. The euclidean distance between the two endpoints of each the segment. The minimum bounding box of the segment is the box with minimum area of bounding boxes for all possible edges of the convex hull of the segment. The length d
max
, the width d
min
, and the area d
A
of the minimum bounding box are used to describe each segment. The orientation angle is the angle between the tangent at the first point of the segment and the vector line between the two end points of the segment; see Fig. 3. Geometrical shape-based measure.
Hence, the feature vector that represents the segment fingerprint is given as follows:
For each segment s i , a feature vector v i is created, then, a clustering algorithm is employed to group similar segments together in one cluster. These clusters are used to create a symbolic representation of the time series trajectory such that every cluster is given a unique Unicode alphabet as it will be explained in the next section.
Note that each segment S i has length n of data points is represented by five values. In other words, the segment S i of the time series trajectory has a dimensionality reduction from n to five. Also, the proposed shape-based measure is dimensional invariant, which makes the measure suitable for the time series data that is generated from 3D trajectories such as quad copter’s position trajectories.
The next step after creating a feature vector for each segment, is to cluster these feature vectors into a set of clusters that groups similar segments.
Generally speaking, there are many clustering algorithms that can be used for numerical feature vector data such as our feature vector
One of the advantages of FCM, unlike k-means clustering algorithm, where each data point must exclusively belong to one cluster, here data point is assigned based on membership function, and as a result, a data point may belong to more then one cluster with varying degrees of membership.
The objective function that is minimized in the FCM is given as follows;
The FCM algorithm first randomly initialize the values of μ ij , then calculate the cluster centers c j as follows;
Using the FCM clustering algorithm, a given time series trajectory U can be transformed to set of clusters, where each cluster represents an elementary segment. The number of clusters is a user defined parameter, which controls the level of similarity between each extracted maneuver. In other words, the number of clusters defines the number of elementary segments that we extract from a given trajectory.
The question now becomes how to convolute or concatenate these elementary segments from different clusters to build the maximum maneuvers? In order to answer this question, we use a symbolic representation for each cluster or for each elementary segment. In the next subsection, a symbolic representation of clusters is given.
Symbolic representation provides an easier interpretation and helps to determine meaningful patterns. For instance, symbolic aggregate approximation (SAX) algorithm become more apparent in data mining to overcome the issue of large sets of data. SAX was proposed in [35] as an alphabet representation that reduces the dimensions of the data and allows the use of string processing algorithms to analyze time series [36]. Other symbolic representations are used in different domains [37], for instance, symbols such as [up, down, neutral] have been used for the symbolic representation of stock market data. It has been shown that the representation of stock market data as symbols, instead of data points, discovers interesting patterns and it becomes an easier task to for mining [37].
In order to use the power of symbolic representations to extract the maximum repeated maneuvers, we represent each cluster or elementary segment with a unique alphabet letter as shown in Fig. 4. This will allow the use of several string pattern discovery algorithms to extract the maximum repeated patterns in a given time series data.
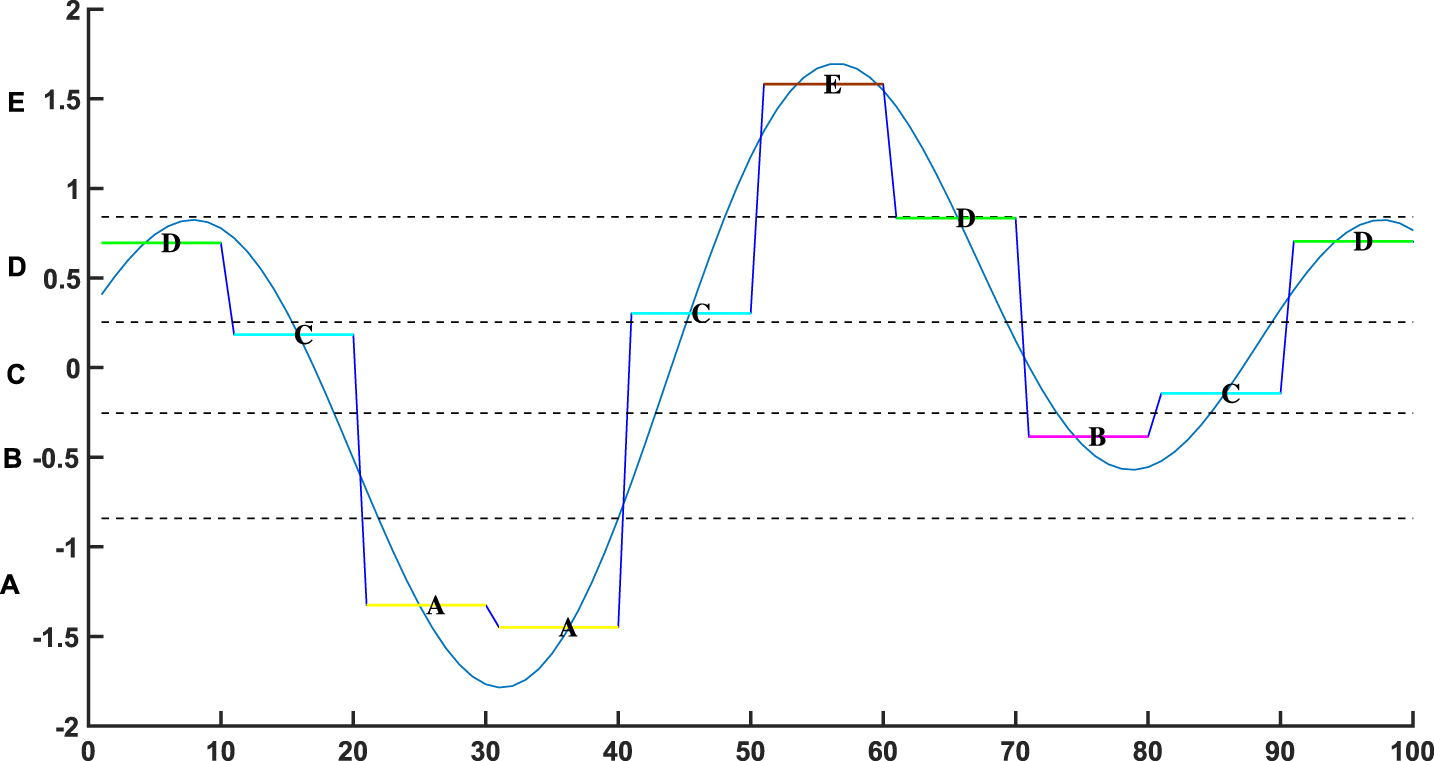
Symbolic aggregate approximation (SAX) using piecewise aggregate approximation (PAA).
Using the symbolic representations of the elementary segments transforms the problem of maximum repeated maneuver extraction in a time series data to maximum repeated word in a string of alphabets. For example, suppose that a given time series data is segmented and clustered to eight clusters and each cluster is associated to a unique letter for the alphabet set [A, B, C, D, H, I, J, K]. Therefore, the time series date is now transformed to the following string,
"AABDECDFDCD
A maximum maneuver extraction in time series data refers to finding the similar worlds with maximum length and a predefined minimum length. In the previous string, the pattern "
Since the problem of maximum maneuver extraction is reduced to how to find a maximum repeated substring in a given string, several algorithms from DNA motif discovery can be employed. In this paper, the TEIRESIAS algorithm [38], which is a combinatorial algorithm for the discovery of rigid patterns (motifs) in biological sequences will be used. In the next subsection, we will provide a brief description of this algorithm.
TEIRESIAS algorithm was first proposed by Rigoutsos and Floratos [38]. It was originally proposed for the discovery of rigid patterns in biological sequences, which is known as motifs. The name TEIRESIAS is named after the Greek prophet TEIRESIAS.
A pattern P in TEIRESIAS algorithm is a (L, W) pattern if and only if: P is a string of characters Ξ and "·", where, Ξ is a the basic alphabet set or the unicode characters and "·" stands for wild card or donâĂŹt care alphabet. P starts and ends with a character from Ξ. Any sub-pattern of P containing exactly L non-wildcard characters has length of at most W.
For instance, "AD. .Bf" is a (4, 6) pattern, where L = 4 and W = 6.
"KILFGIHJHKILFGIHGDRCKFKILFGI" has the elementary pattern "KILFGI". In the pre-convolution phase, a sorted list of prefixes and suffixes is generated. The prefix of an elementary pattern P is defined as a unique sub-segment that contains the first L1 residues of the pattern P. Also, The suffix of an elementary pattern P is defined as a unique sub-segment that contains the last L1 residues of the pattern P. For instance, for l = 3, prefix ("F . ASTS")= "F . A", prefix ("ASTS")= "TS". The sorted list of the prefixes and suffixes is used in the convolution phase to combine together any two elementary patterns that the suffix of one pattern matches the prefix of the other pattern. For instance, suppose that P1 = " F . AS " and P2 = " AST " then, a new generated pattern from convolving P1 and P2 is P3 = " F > AST ". The newly generated pattern is considered as a new elementary pattern, which convoluted with the rest of the elementary patterns. Once a generated pattern can not be extended anymore, it is considered as a final pattern.
Examples and discussions
In the following section, we present some examples and discussions of the proposed method using generated data form human-in-the-loop systems.
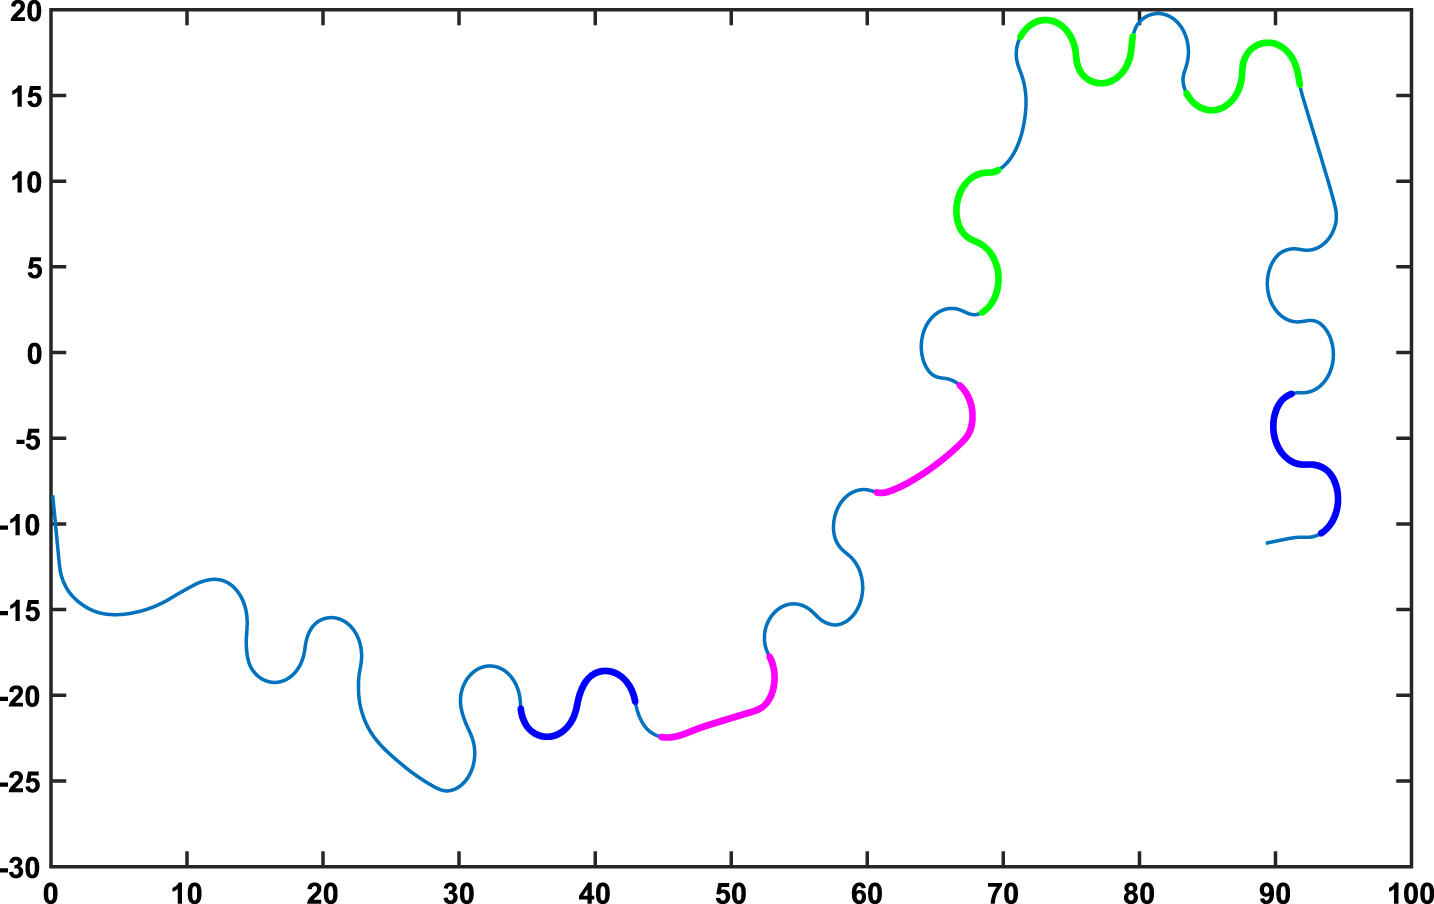
In order to use the shape-based representation method, we generated several position trajectories of a moving car derived by a human operator using simulation platforms. In this experiment, the human operator is asked to perform maneuvers as he wants; see Fig. 6. Then, the proposed method is applied to the generated trajectories for pattern detection. As shown in Fig. 6, the algorithm was able to detect three different patterns with different length.
The algorithm consist of two phases as shown in Fig. 5:
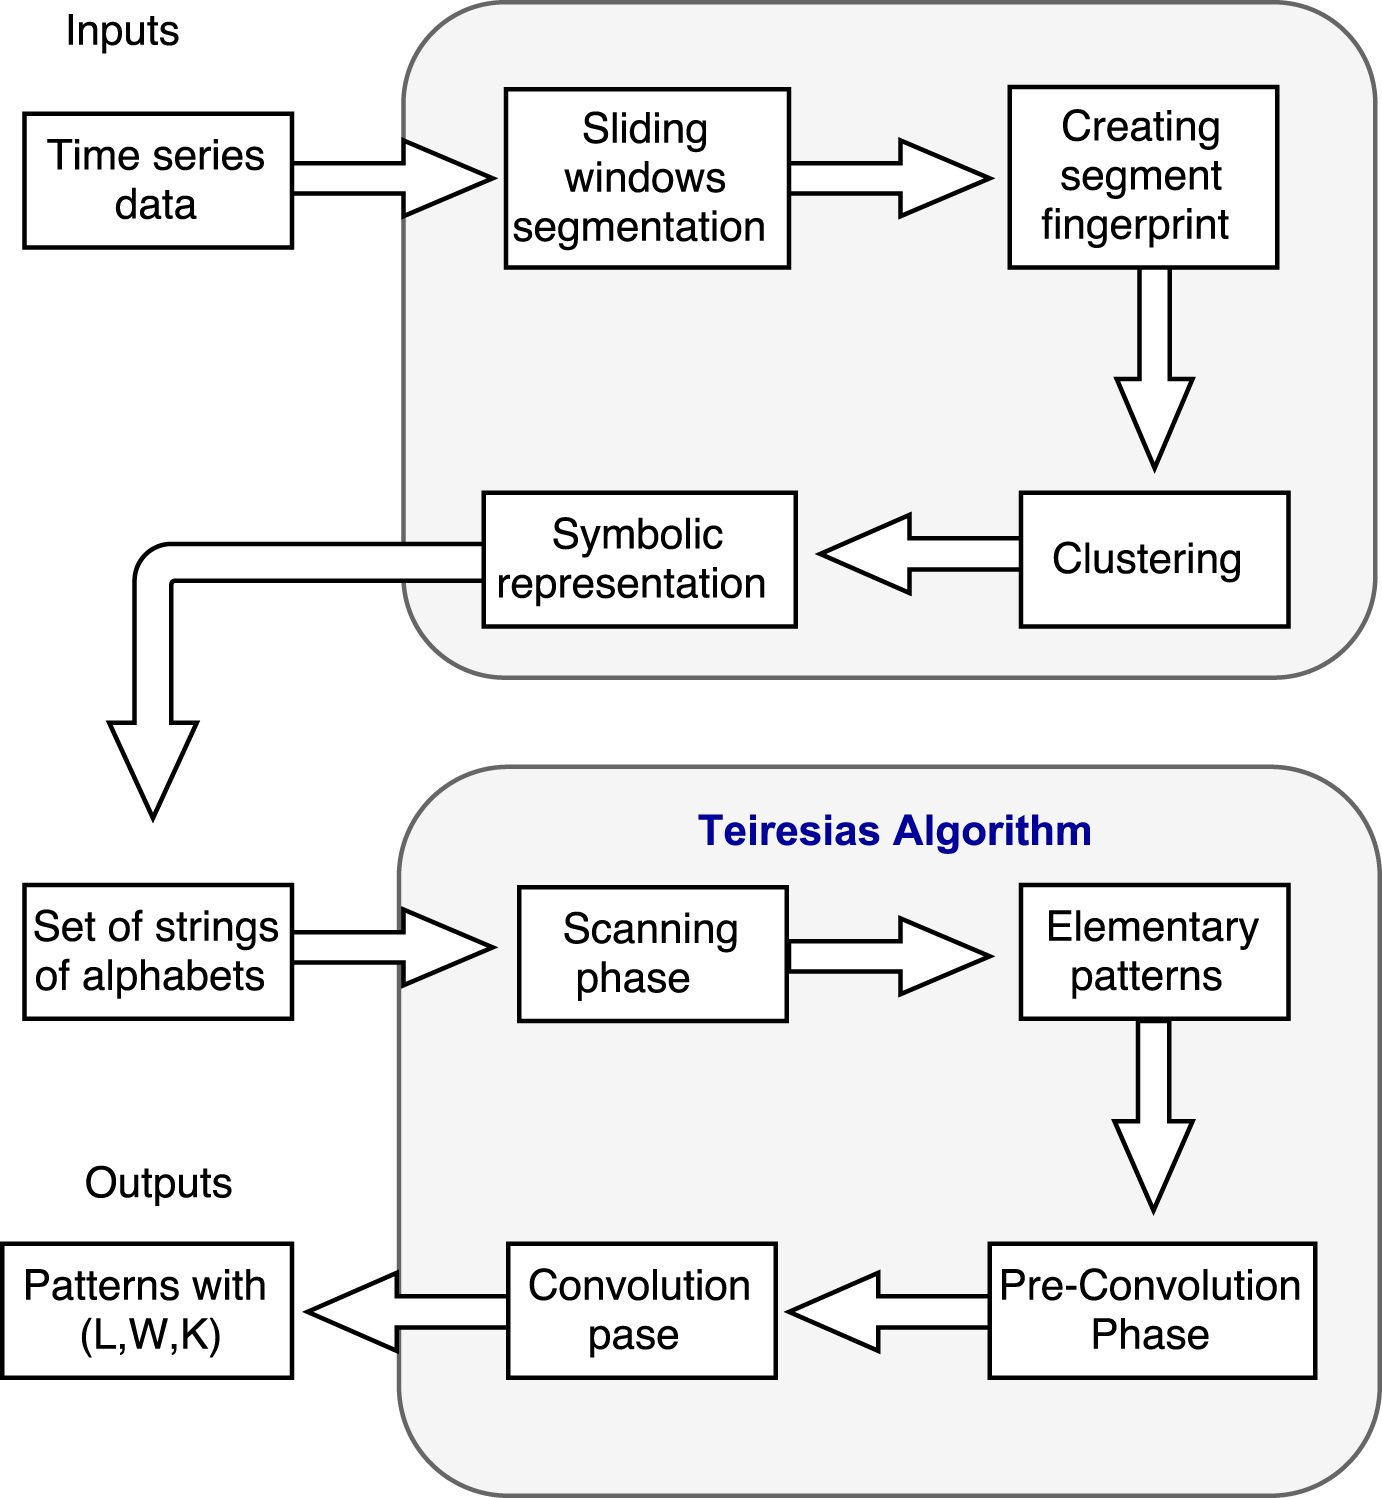
Teiresias Algorithm.
Position trajectories of a moving car derived by a human operator.
In another experimenter, a human operator is asked to drive a car in a predefined trajectory as shown in Fig. 7. The steering commands of the human operator are recorded for pattern detection using the proposed method. As shown in Fig. 8, two patterns with different length are detected.
Predefined trajectory to be followed by the human operator. Results.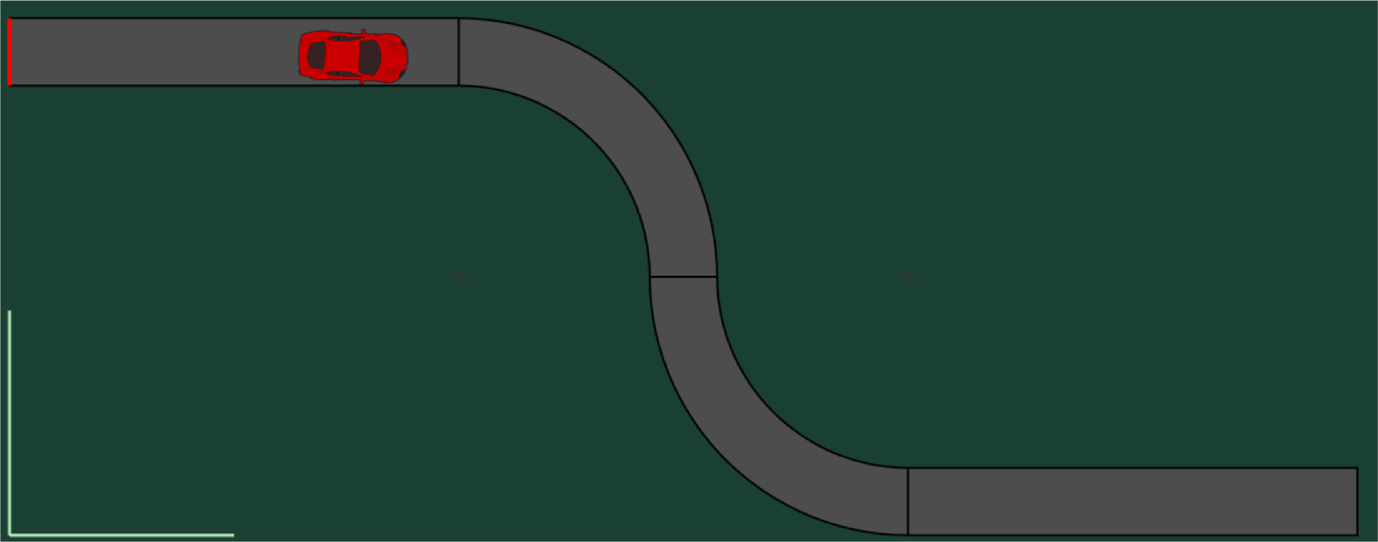
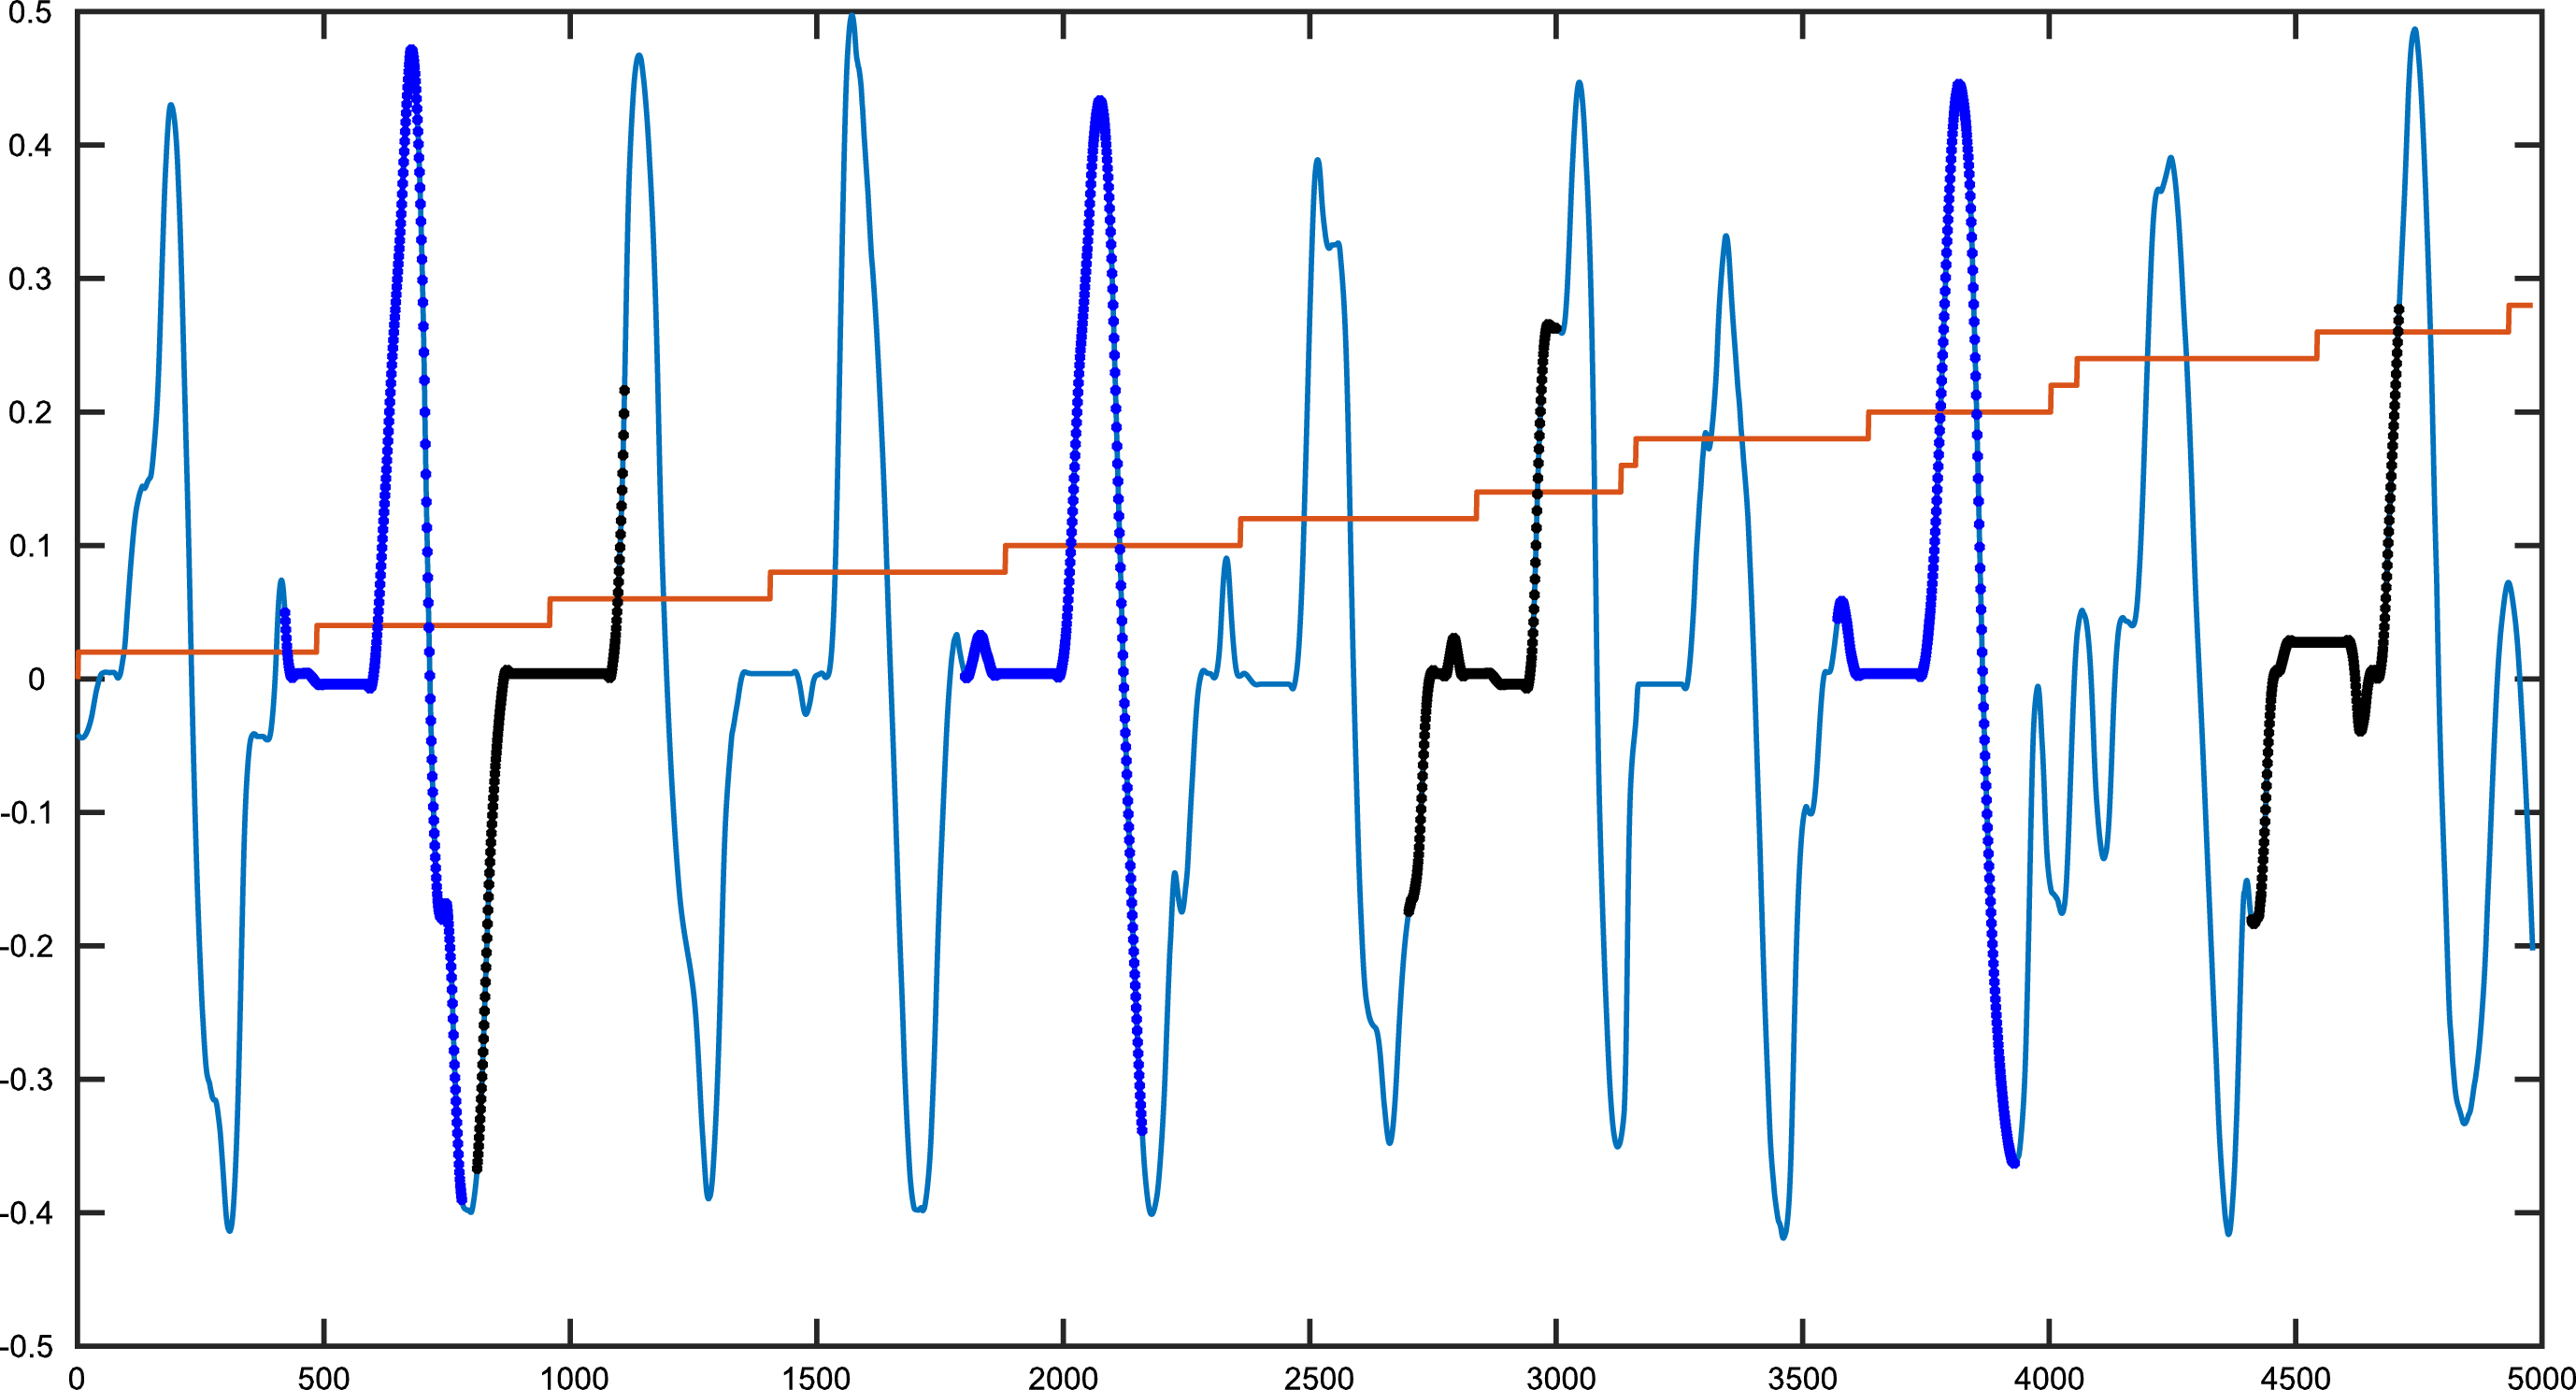
Fig. 9 presents the use of SAX symbolic representation with TEIRESIAS algorithm to detect the maximum repeated patterns in randomly generated one-dimension non smooth data. Two patterns were injected into the data and the algorithm was able to detect them as shown in Fig. 9.
SAX symbolic representation with TEIRESIAS algorithm to detect the maximum repeated patterns in randomly generated one-dimension non smooth data.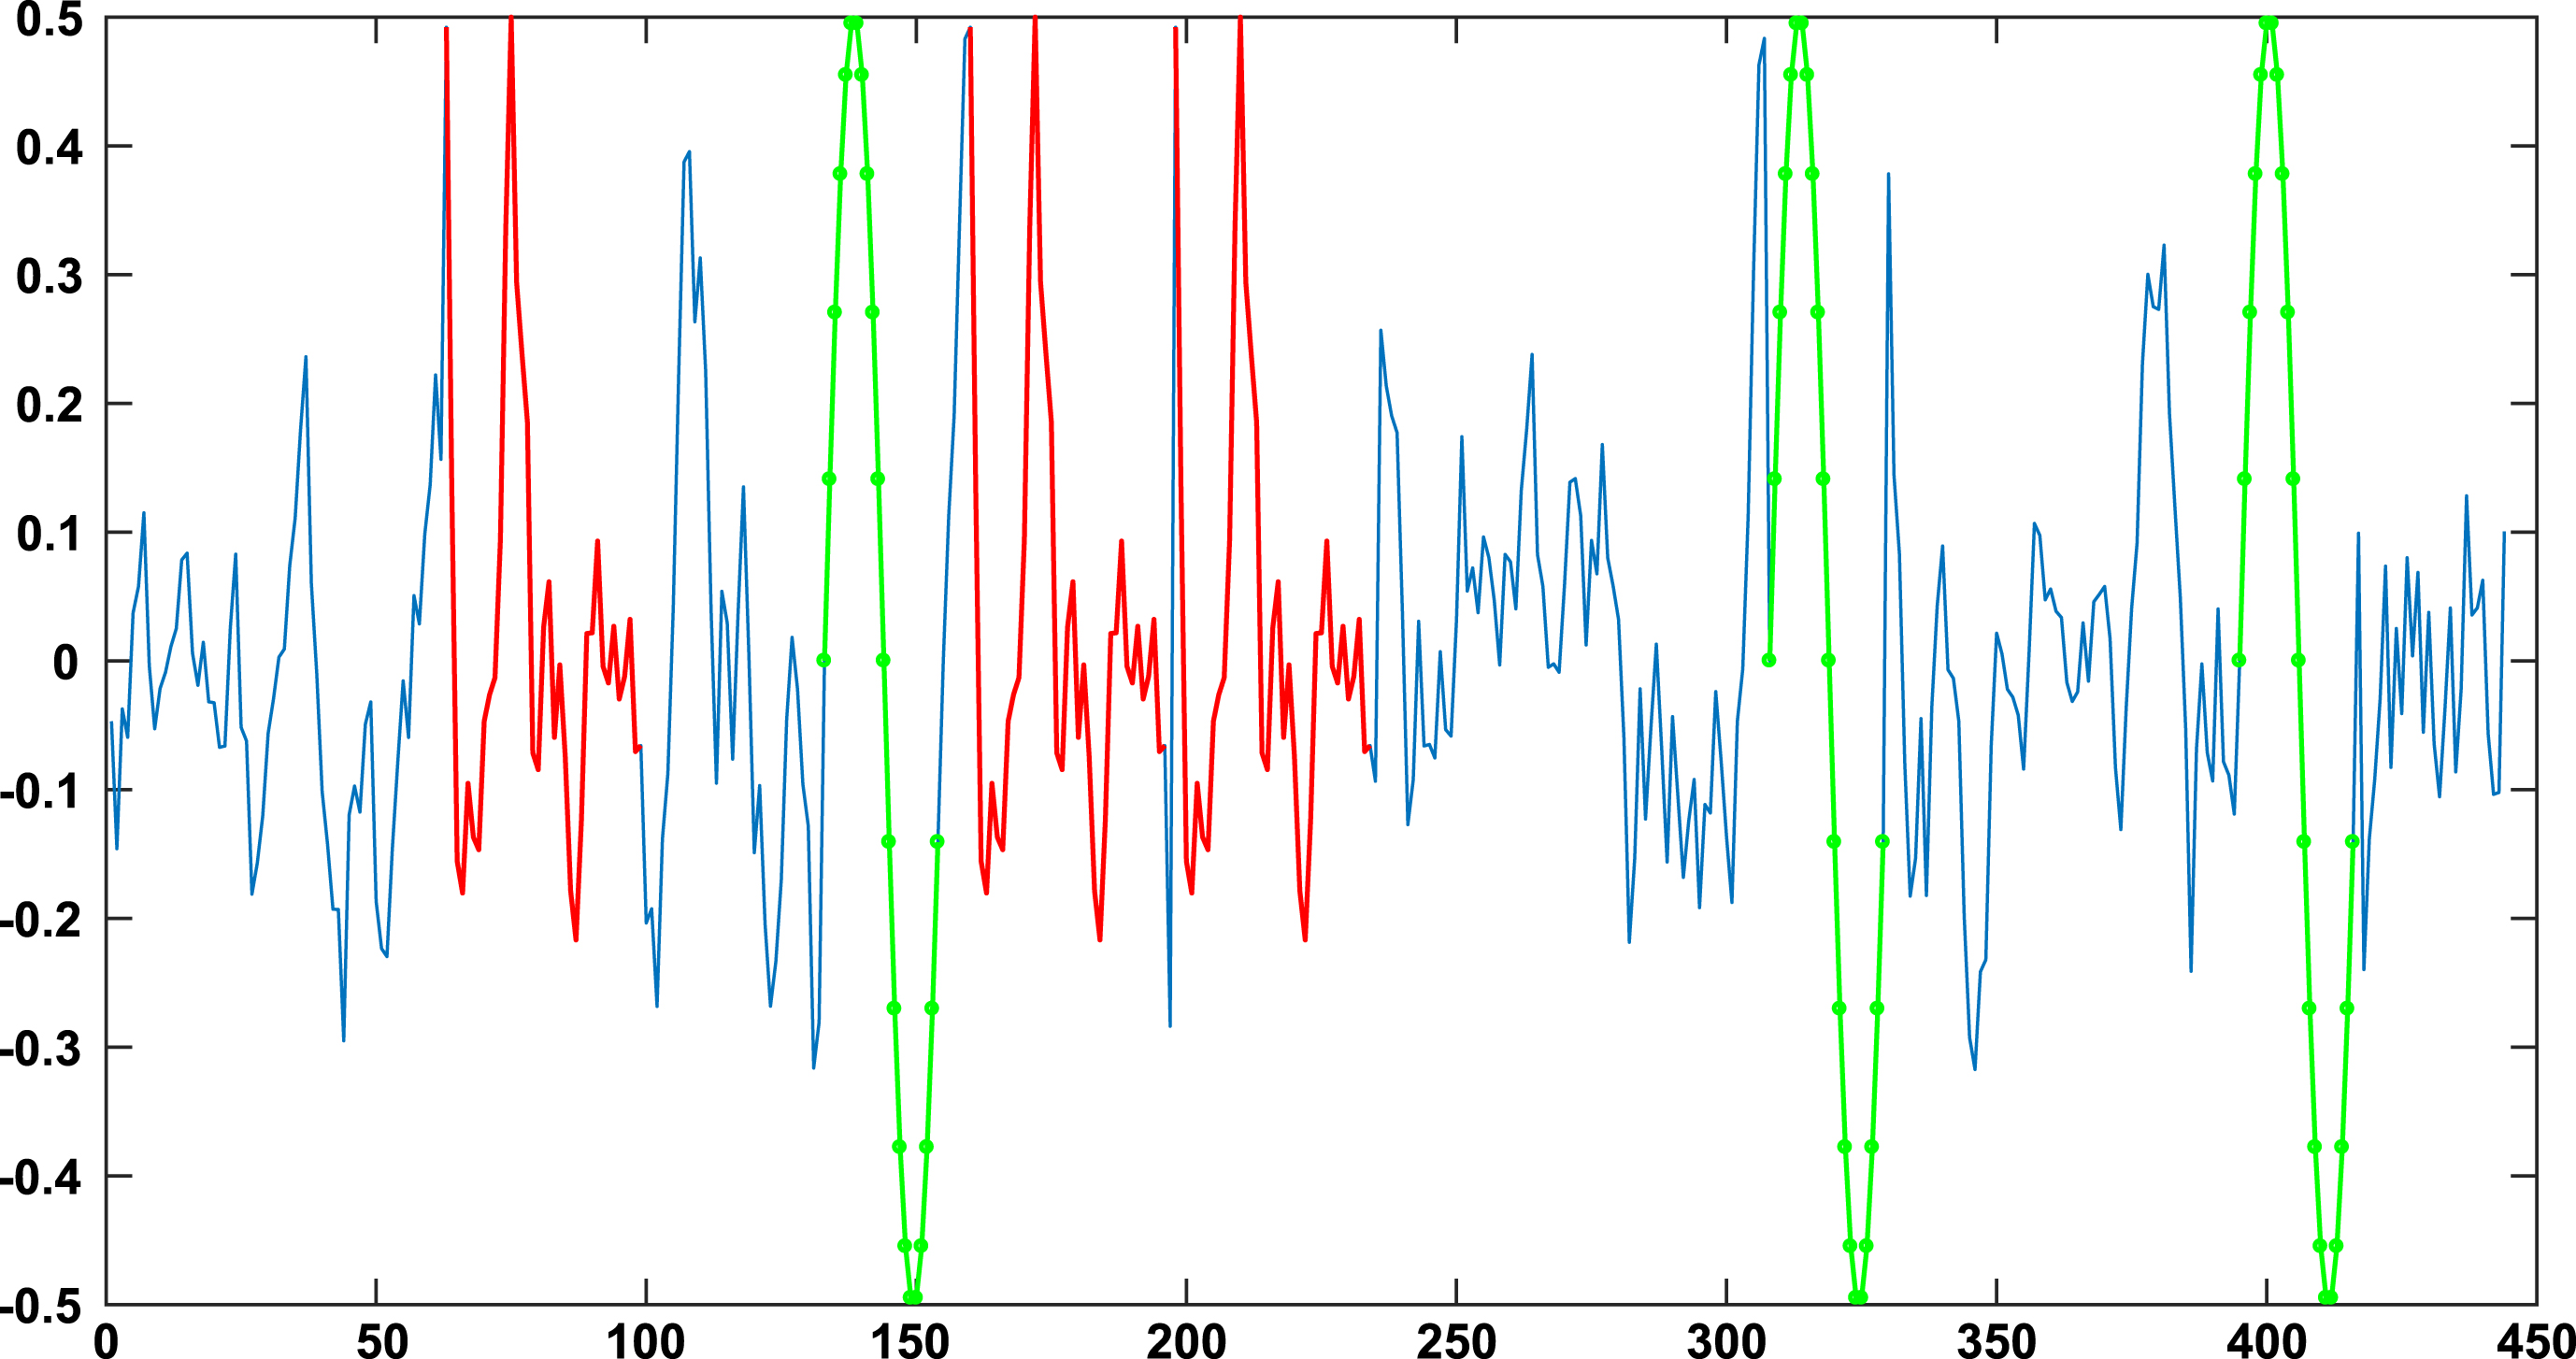
In this paper, we proposed a new geometrical shape-based measures for pattern detection in time series data. The proposed algorithm discover the maximum repeated maneuver in to phases. The first phase consists of trajectory segmentation, creating segment fingerprint, clustering, and symbolic representations. The second phase of the proposed algorithm is pattern extraction phase, which is inherited from the motif finding algorithms in time series data and DNA sequences. The proposed method can be used for pattern detection in human-in-the-loop applications to discover repeatedbehaviors.