
Abstract
Supply chain network equilibrium (SCNE) model can provide many important results for supply chain network. Such as the production of product, the trade volume between supply chain members, and product price, etc. In this paper, the authors analyze the supply chain equilibrium and transportation network efficiency based on MSA algorithms and multilayer decision model. The super network equilibrium problem was converted to transportation network equilibrium problem, and then was planned and resolved. An example was introduced in the paper, and the model was solved. The results showed that the expansion of congestion link capacity would improve the efficiency of supply chain network. New link can cause a significant change in the distribution channel of supply chain network. Those all prove that model can be used to study the interact between related policy of road transport and benefit of supply chain network. At the same time, the model built in this paper can be applied when extended in some direction, which is the next step of research work.
Introduction
Supply chain network equilibrium (SCNE) model can provide many important results for supply chain network. Such as the production of product, the trade volume between supply chain members, and product price, etc. The representative research early in this respect is that Nagurney et al. (2002) [1] proposed the first supply chain network equilibrium model, which was multitiered and involved competition among decision-makers in a given tier, but cooperation between tiers of decision makers, consisting of manufacturers, retailers and consumers at the demand markets. Nagurney (2006) [2] demonstrated that this problem can be reformulated and solved as a traffic network equilibrium problem in terms of paths and path flows, which has opened up the study of supply chain networks as transportation networks, a subject with a much longer history and literature. Chen and Chou (2004) [3] and Liu and Nagurney (2006) [4] extended the model to a dynamic setting where decision makers seek to determine their optimal plans over a multi-period (time-dependent) plan-ning horizon. Chen and Chou (2005) [5] proposed a capacitated static supply chain equilibrium model where shadow prices are added to capacitated path costs.
However, the research on supply chain network equilibrium (SCNE) above cannot solve the problem of endogenous decision on transport charge and cost. The direct effect between traffic conditions in the transportation network and supply chain network cannot be given in the model [6]. Therefore, once considered the traffic condition in transportation networks and the change of supply chain network behavior, the existing equilibrium model of supply chain is not appropriate [7]. These models are not appropriate for analyzing the influence that the transport policy impact on equilibrium results of supply chain.
In this paper, the concept of super network which is composed of supply chain network and transportation network. And a multi-period supply chain super network equilibrium model with capacity constraints was set up [8, 9]. Model allows managers and planners of supply chain to study the influence between freight policy and supply chain, to help managers assess effect of transport policy of different periods in a given planning period [10]. At the same time, the super network equilibrium decisions of different periods in a given planning period wasgiven [11].
The main contribution of this paper is to introduce a concept of purchasing strategy while equilibrium model of supply chain was established in which the strategy behavior of manufacturers, wholesalers, retailers and consumers of demand market was involved. Variational inequality model was developed to solve the problem of supply chain network equilibrium, in which variables of freight carrier’s behavior and freight decision were involved. The supply chain network and transportation network were connected by function of the transportation cost in the model. And interactions between the two above were expounded. MSA algorithm was used to solve the result of strategy and strategy flow.
This paper is organized as follows: The related work is introduced in Section 2. Multi-period Supply chain-traffic super network is described in Section 3. The simulation test of Solution algorithm is presented in Section 4. Empirical analysis of logistics service quality is presented in Section 5. Finally, Conclusions are given in Section 6.
Related work
Agile supply chain network performs various interactions with other main environment based on the established rules, and achieves information feedback through this initiative interaction [12]. In order to fully assess the agile supply chain network, we need to measure the agility of the information in the agile supply chain network, so as to improve the adaptability of the agile supply chain network [13]. If in the supply chain network, an individual level with a strong adaptability, then this adaptability can pass on to other supply chain networks; ultimately make the entire supply chain network can improve the innovation ability [14]. Macho (1991) studied supply chain strategic management incentives [15]. Nishimori (2004) analyzed the excess capacity of supply chain enterprises [16]. Chen (2014) analyzed the coordination mechanism of emergency supply chain based on hesitant fuzzy information [17]. Giri (2015) studied the coordinated supply chain with uncertain demand and stochastic return [18]. Giri (2004) analyzed the coordinated supply chain of standby suppliers [19]. Hong (2015) analyzed the coordination of supply chain with asymmetric information and cost disruption under non-linear demand function [20].
At present, agile supply chain network belongs to the field of short development time; more emphasis is on software agile supply chain network research and analysis [21]. At present, the most widely used research system is the agile supply chain network perceptible distributed system [22, 23]. At present, many scholars at home and abroad have studied this and put forward their own views, but most of the evaluation models given are relatively simple [24]. The agile supply chain network metrics under constraint are not fully considered, and no detailed and specific calculation steps are given, which leads to the fact that the efficiency of agile supply chain network is not effectively solved.
Model building
Multi-period Supply chain-traffic super network
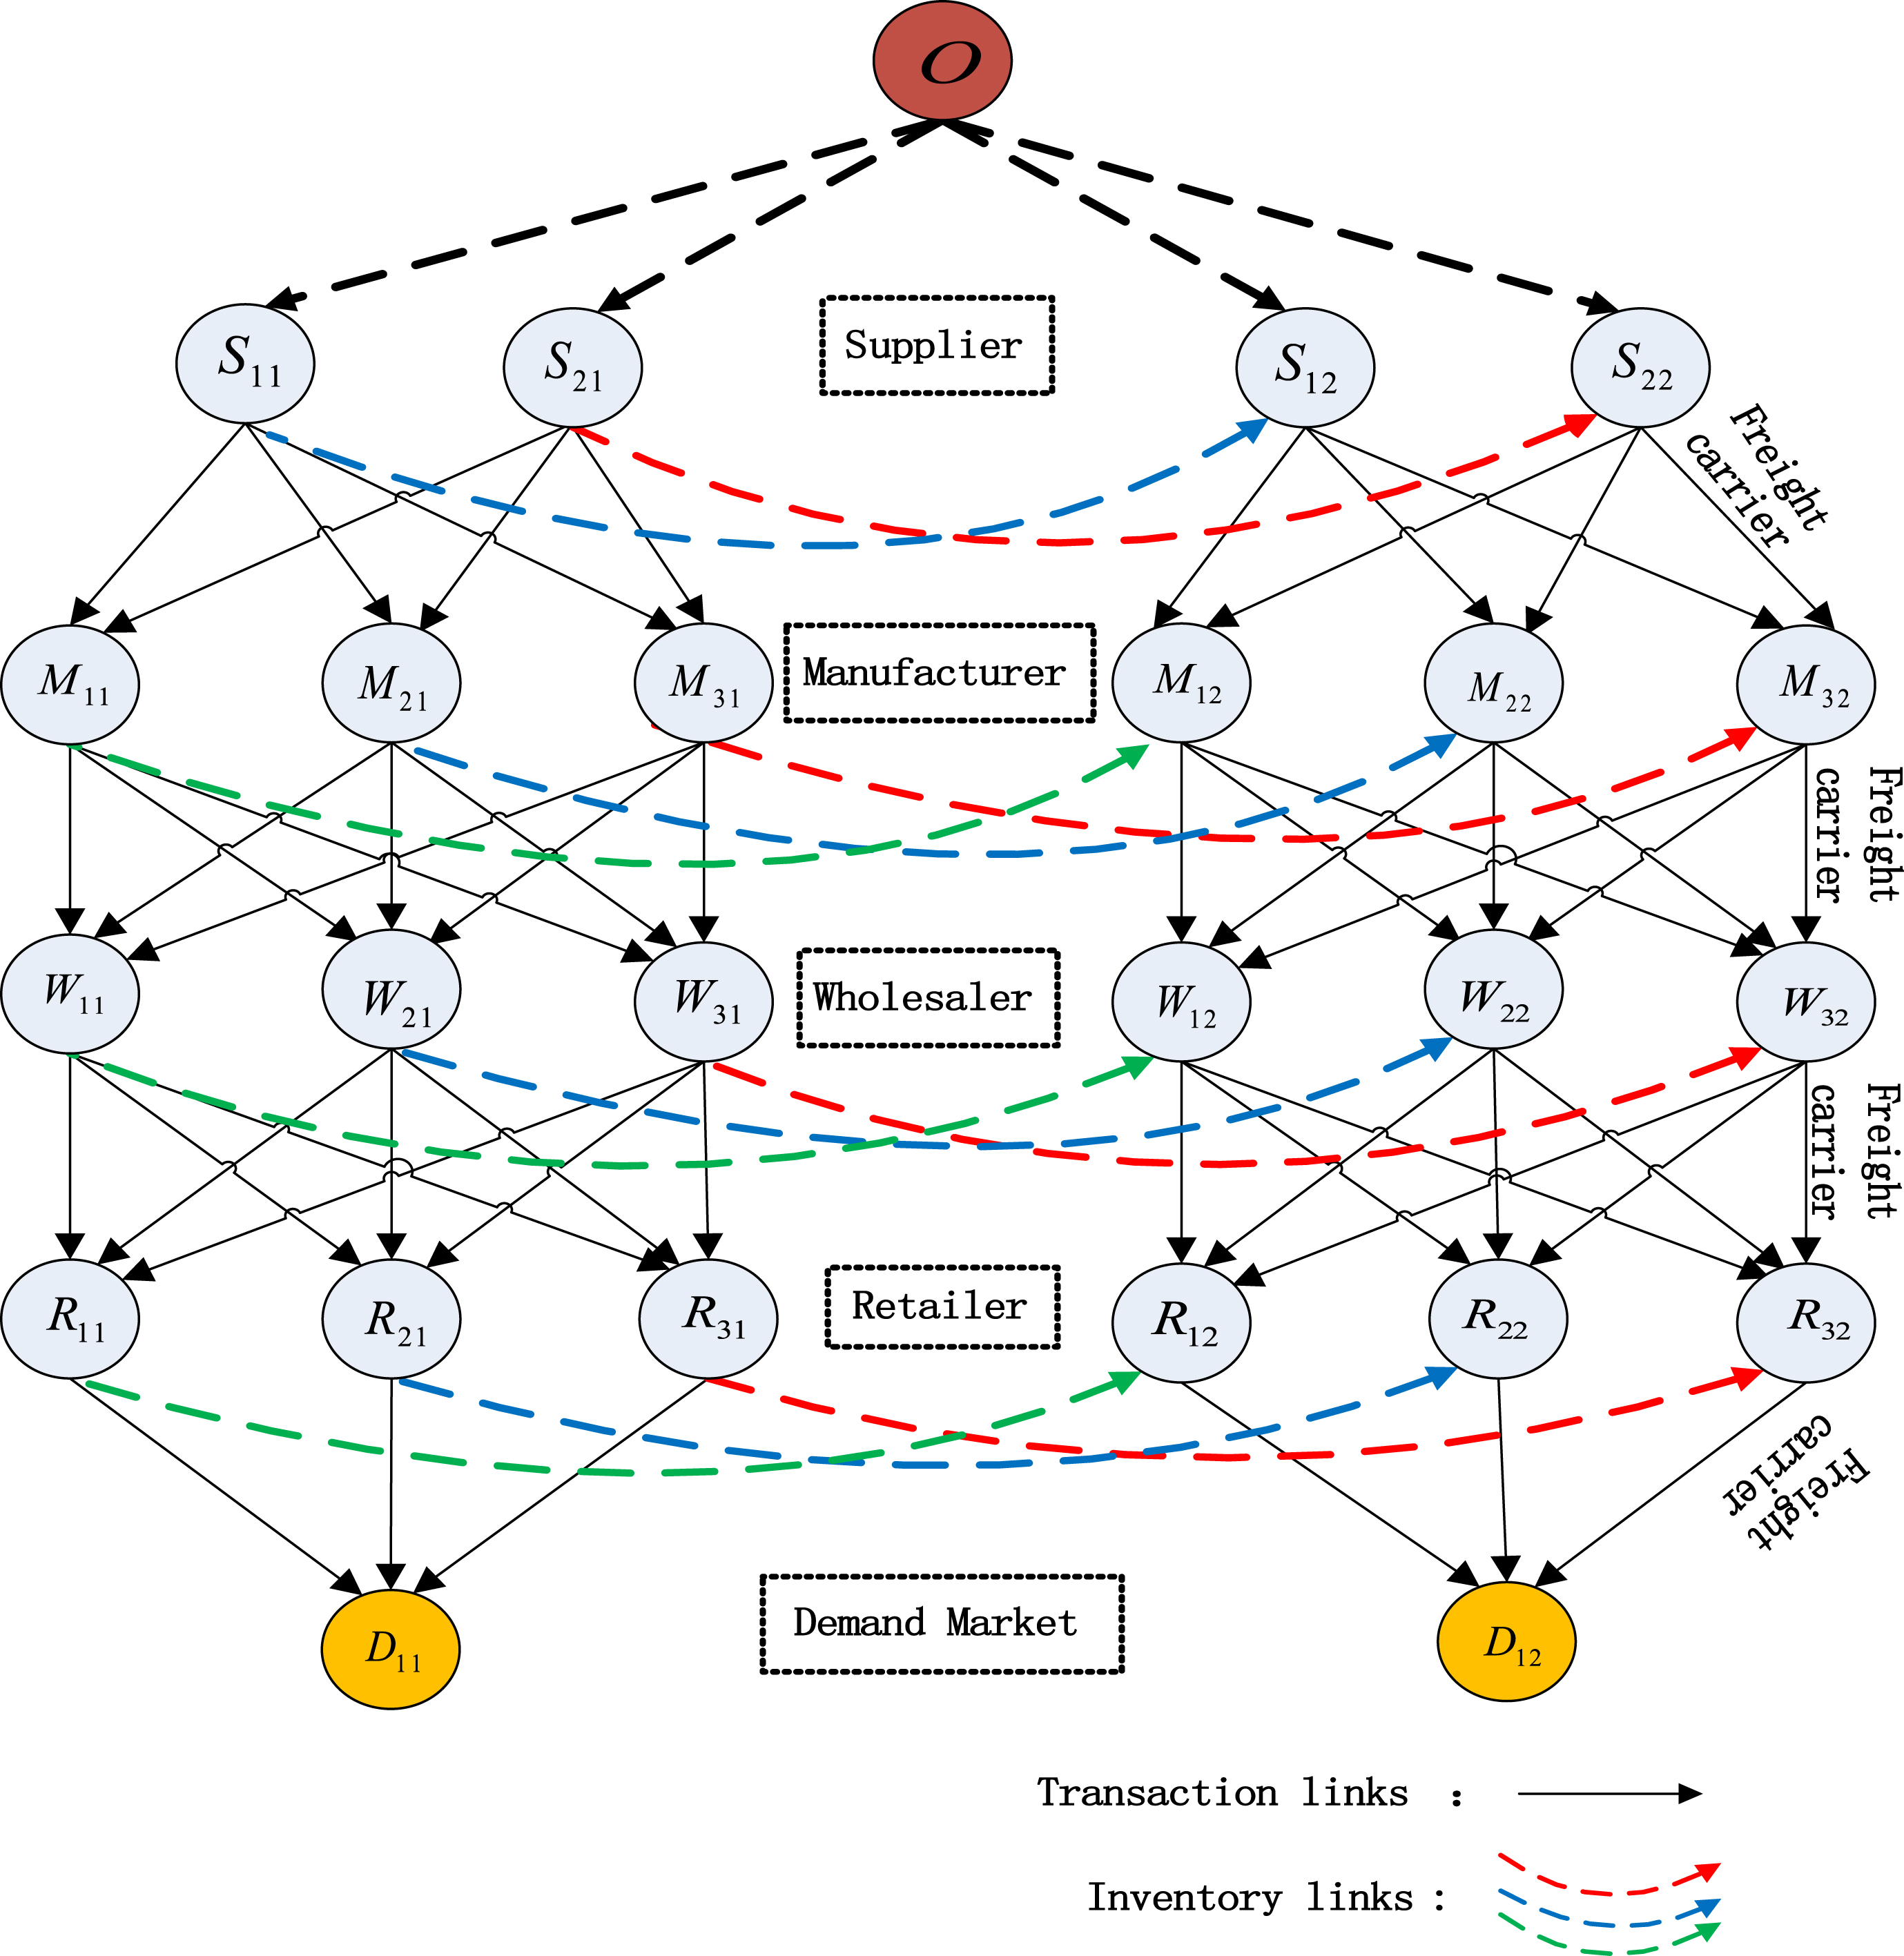
We present a multi-period SCNE(Supply Chain Network Equilibrium) model of five layers with capacity constraints where SCN for the same products are involved in a traffic network. It consists of six sectors: sources, manufacturers, wholesalers, retailers, demand markets and freight carrier over T time periods (indexed by t). For each specific period t, S (indexed by n) competitive sources are involved to provide raw materials to manufactures. M competitive manufacturers (indexed by i) are involved in the production of a homogeneous product, which can then be purchased by W wholesalers(indexed by j), who, in turn, supply products to R retailers(indexed by k). Consumers at D demand markets (indexed by l) purchase products from processors.
Consider a transport network G (V, A) with the set of node V sand that of links A, the SCN above with the same distribution channel lie on the traffic network of G (V, A). The links in the supply chain network are of two types. The first type denotes transportation/transaction links between two consecutive tiers and the second type represents inventory links in which the product can flow from one period to the next for the same agency. Sources, manufacturers, wholesalers, retailers and demand markets in the SCN exist on the nodes in the traffic network. Freight vehicles trips are therefore generated from and attracted at each node in it, since the products are trad-ed between such decision-makers.
Other traffic than the freight vehicles can also be generated from and attracted at each node in the traffic network. Set of origins for all the traffic is represented as B ⊆ V, and the set of destinations as S ⊆ V. Every node in the traffic network allows both the generation and attraction of traffic. No more than one decision-maker dealing with the same kind of product can be located at a single node in the trafficnetwork.
The multi-period supply chain network equilibrium condition
Assuming that all the cost functions for each node are continuously differentiable and convex as well as that the nodes compete in a noncooperative fashion (see Nagurney et al., 2002a), the optimality conditions for all nodes can simultaneously be expressed as the following variational inequality respectively: Let
For each time period t, we assume that each node is faced with supply cost functions
Let
For suppliers, determine (
For manufacturers, determine (
For wholesalers, determine (
For retailers, determine (
For consumers, determine
For freight carriers, determine
where
X: vector of traffic volume
The behavior of passenger cars is assumed to follow the user equilibrium traffic conditions with variable demand. Thus, the demand of passenger cars in a given OD pair fluctuates, depending on the travel cost (i.e., travel time) on its shortest path, equilibrium conditions are equivalent to obtaining
We demonstrate, through a super network construction similar to the one used in the model of Liu and Nagurney (2006), that the optimal solution of the capacitated multi-period supply chain-transport network equilibrium model described in Section 2 can be obtained from solving a new transportation network equilibrium model with purchasing strategies and variable demands.
Similar to the concept common in the transportation equilibrium literature with elastic demands, we say that a strategy assignment vector is in a user equilibrium if all utilized strategies connecting an OD pair have equal and minimal expected costs which are equal to the disutility associated with that OD pair and if the market clears for each OD pair under a positive price or disutility: For every OD pair and every strategy, it should satisfy Equations 9 and 10:
The transportation equilibrium conditions (9) and (10) can be expressed as the following variational inequality: determine
Y: a vector with y s as its components.
C s (Y*): expected strategy costs
Test supply chain network.
Solution algorithm
The steps of the solution algorithm include two loop operations. In the outer loop operation, product price interactions are diagonalized. In the inner loop, the variable demand subproblem is solved as an equivalent fixed demand subproblem by giving an upper bound of demand.
Step 1: Outer loop operation
Step 1.1: Set initial multi-period product prices to zero, {χ lt } 1 = {0}, Set {χ lt } 1 = {0} and go to Step 1.2.
Step 1.2: Impose upper limits for the demand functions:
Step 2: Inner loop operation
Step 2.1: Select an initial strategy s* [1], and set
Step 2.2: Compute C (Y[α]). Determine s* [α], the optimal (or the least expected cost) strategy with respect to Y[α]. Set
Step 2.3: If

Equilibrium arc flows for SCN.
Step 3: Check for equilibrium
Set {χ
lt
} τ+1 = {χ
lt
} α+1, If
To demonstrate the validity of our model, we consider a hypothesized supply chain network (Fig. 1). It was assumed to be located in a urban traffic network, and we built this new network which was called supply chain-traffic supernet work (Fig. 2).
The link distances are set to 1 (for link numbers 1,2,5,6,7,8, 13,14,15,16,17,18,19,20,23,24,26,26,27 and 28), 2 (for link numbers 3,4,29,30,31 and 32), (for link numbers 11,12,33,34,41 and 42), (for the remaining links), respectively. Here, only one kind of product is assumed to be manufactured, transacted and transported.
Both the functional forms and parameter values of C
nt
, C
it
, C
jt
, C
kt
, b
nt
, b
it
, b
jt
, b
kt
, C
nit
C
ijt
, C
jkt
, C
klt
, g
nt
, g
it
, g
jt
, g
kt
, g
ht
, d
lt
, l, k, η, v and t
a
are determined so that the existence and uniqueness of solutions are ensured. These settings are also based on the existing studies (e.g., Nagurney et al., 2002a; Patriksson, 1994; Nagurney et al., 2005). The multi-period SC-T-SNE cost functions associated with the five tiers are given in Table 1. The multi-period demand functions in demand markets are provided in Table 2. Test supernetwork.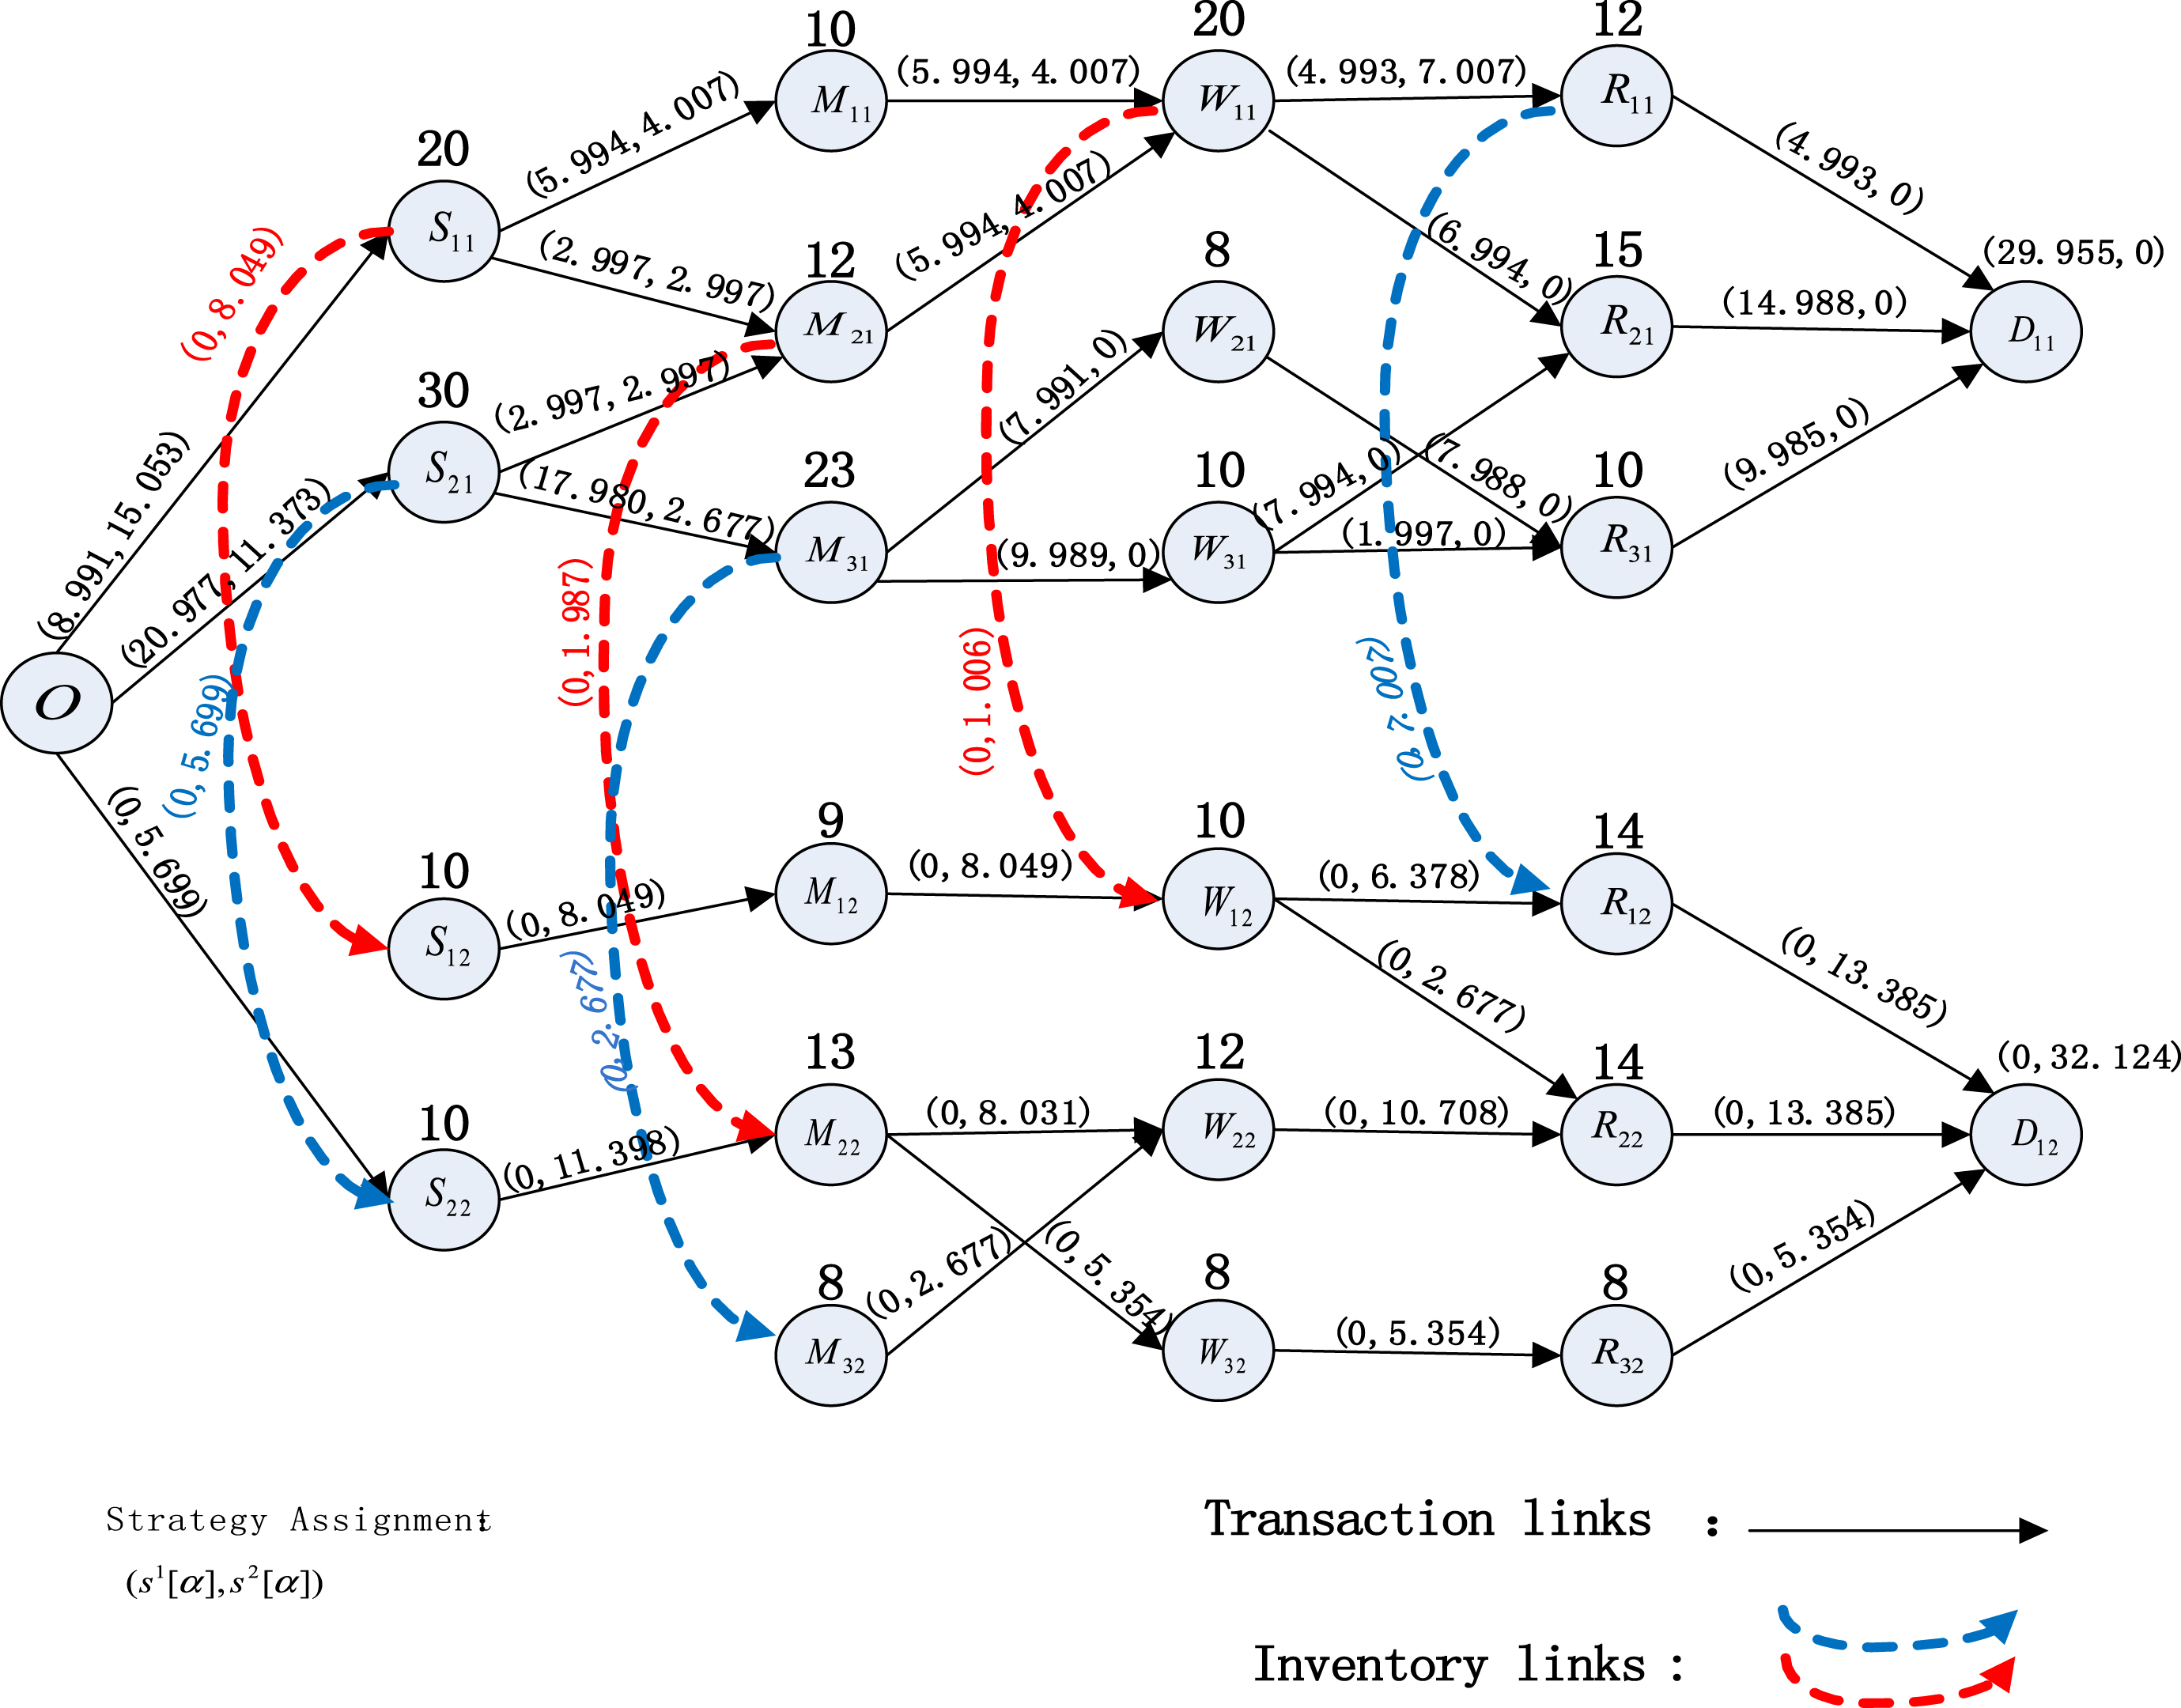
t0,a: free travel time on link a,
C a :traffic capacity on link a.
By applying the solution algorithm, the loop operation was iteratively solved about 120 times. The algorithm converges and yields the equilibrium link flows in Fig. 3. We seek to compare constringency effect between traditional projection method (Liu and Nagurney, 2006) and our MSA, the comparison result was shown in Fig. 4.
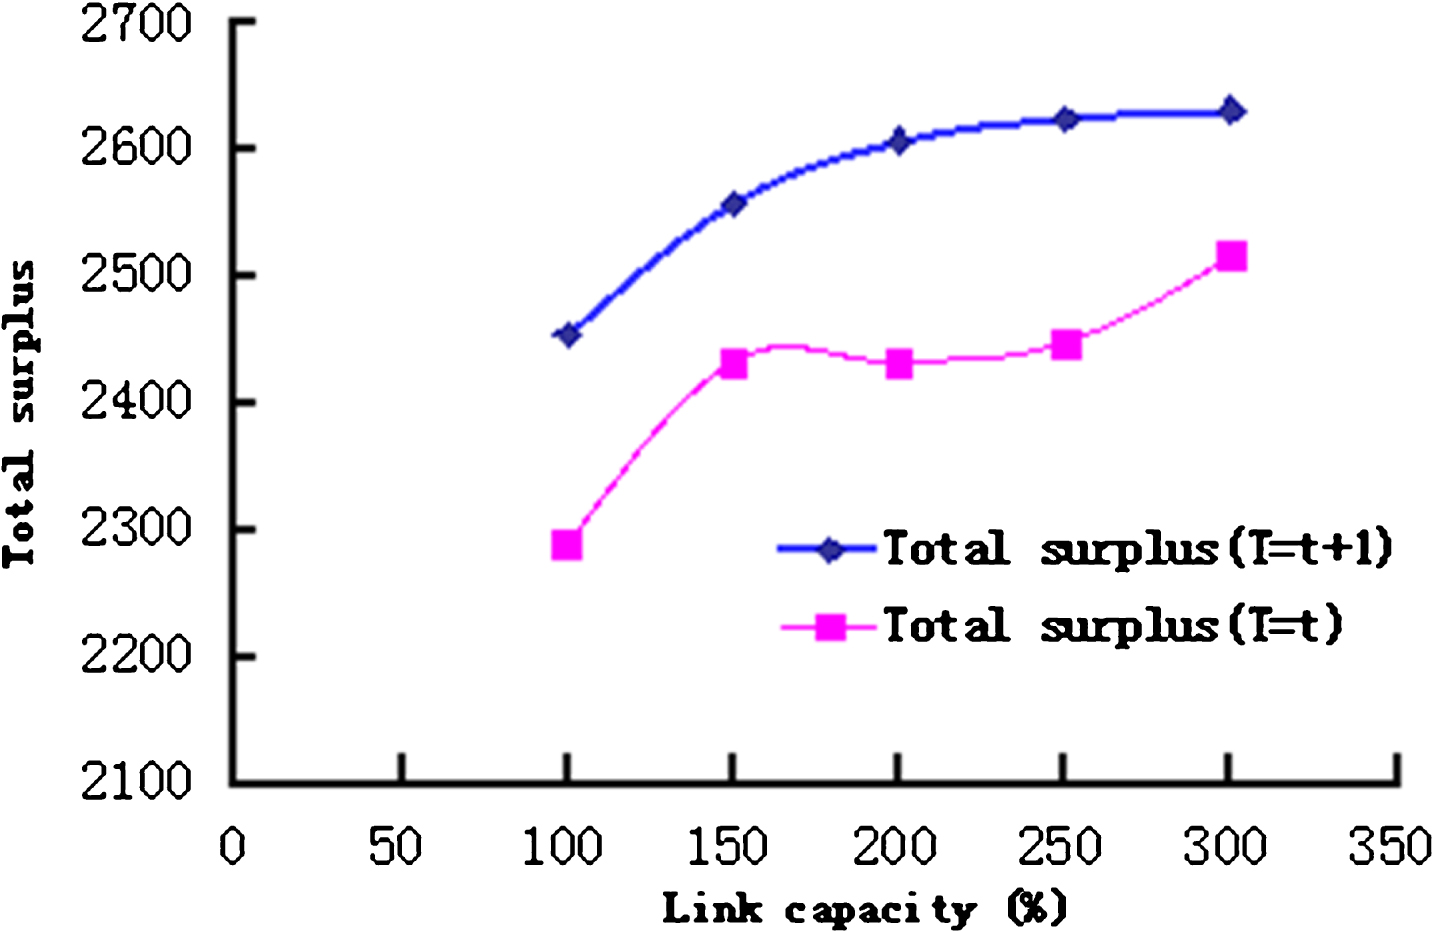
Links 3 and 34 are found to be the most congested links in the traffic network. Therefore, the capacity of these links is expanded from 100% to 300%. This can be considered as the case where the transport measures for increasing the capacity of congested links on the road network are implemented like road widening. Figures 5 and 6 show the influence in the efficiency of supply chain network induced by traffic conditions.
Figures 5 and 6 respectively indicate the changes in total amount of products transacted and the surpluses in SCN as a result of link capacity expanded. It can be seen from Figures 5 and 6 that the amount of products manufactured and the surpluses increase as the link capacity increases. The increase in total surplus means the enhancement of the efficiencyof SCN. Accordingly, the capacity expansion ofcongested links would improve the efficiency ofSCN.
Data sources
The main content of this study is the influence of logistics service quality.5 scale by Likert, “is not in conformity with the” and “comparison with”, “say”, “consistent” and “fit” of these 5 options, respectively 1, 2, 3, 4 then, 5 points, in the form of scoring, so that consumers scoring for the problems described in accordance with their true feelings, true views in order to be able to close to the consumer. Formal sample collection, this study used convenience sampling method with special questionnaire website, designed the network questionnaire, the final total of 350 copies of questionnaires, obtained 295 valid questionnaires, the effective questionnaire was 84.1% overall. Comparison between MSA and the projection method. Relationship between amount of products and increasing the capacity of congested links. Relationship between total surplus and increasing the capacity of congested links. Sample statistics

In order to purify the measurement items of potential variables, this paper selects the total correlation coefficient (Item-Total Correlation Corrected, re-ferred to as CITC) to eliminate the non - consistent measurement items. For the CITC value of less than 0.5 and can be added to increase the clone Bach series of numerical items to be deleted. Through the operation of SPSS18.0 statistical software, statistical results are shown in the following table:
Cronbach’s alpha reliability test
Cronbach’s alpha reliability test
As shown in Table 2, relationship quality scale correction project all items of the total correlation (CITC) was more than 0.5, the overall Cronbach and customer satisfaction and customer trust s reached 0.802 and 0.828, the internal consistency of the items is ideal, this part of the reliability test. The use of SPSS18.0 software, the reliability of the B2 C business platform of logistics service quality in flexibility, time, information, empathy, 6 dimensions of economic and other problems of the KMO and Bartlett test of sphericity, the results shown in Table 3. Principal component analysis of problems, the results can be seen in Table 4, there are 6 eigenvalues greater than 1 components.
KMO and Bartlett’s test
Total variance of logistics service quality
From Table 5, we can see that the customer satisfaction to the logistics service quality of the regression model to adjust the R square value is 0.507, which indicates that the model has reached 50.7%, the customer satisfaction factor has a good explanation ability. The test value of DW is 2.043 in the range of 1.5 to 2.5 and is very close to 2, which indicates that there is no sequence correlation between the error term and the error term is independent. By Table 6, the VIF values of all variables are distributed in the range of 1.431 to 1.806, which are less than the critical value 10, so the regression model can be judged. Through the above analysis, we can know that the regression model of customer satisfaction through the test.
Abstract of model
Abstract of model
In this paper, we formulated a multi-period SC-T-SNE model, which can handle the problem of super networks connected by supply chain and transportation network. And the equilibrium condition was explained by the concept of strategy and strategy flow. The super network equilibrium problem was converted to transportation network equilibrium problem, and then was planned and resolved. However, the existing SCNE model can be limited to solve the problem of supply chain network. An example was introduced in the paper, and the model was solved. The results showed that the expansion of congestion link capacity would improve the efficiency of supply chain network. New link can cause a significant change in the distribution channel of supply chain network. Those all prove that model can be used to study the interact between related policy of road transport and benefit of supply chain network. At the same time, the model built in this paper can be applied when extended in some direction, which is the next step of research work.
Regression coefficient
Footnotes
Acknowledgment
The research in this paper is supported by the Social Science Foundation of Hunan Province in China under Grant No.2014JD29.