
Abstract
Macroeconomics is a very complex and huge system. With the improvement of China’s market economy, it is of great theoretical significance and practical value to apply quantitative economics methods and models to study the macroeconomic state and forecast the economic development trend. The development of regional economy is restricted by natural conditions and social and humanistic conditions, and it is a complex system with many factors and levels. By using grey system theory, data processing can reduce its randomness and strengthen the inherent trend of data, so it is possible to use as few data as possible to establish a model describing economic system. Through empirical test, the author analyses the main factors of unbalanced regional economic development and puts forward the comparative advantages of regional development. According to the simulation results, the predicted results are stable and reliable. The conclusion of the study has a certain reference value for the formulation of macroeconomic policies. By strengthening the guidance of government classification, the regional economic disparity will be narrowed continuously.
Introduction
Since the implementation of the policy of reform and opening up, China’s economy has achieved great development, the traditional planned economy has been gradually transformed into a socialist market economy [1]. With the deepening of the reform of the socialist market economy, economic development has gradually formed a benign trend of market orientation and government regulation, and gradually improved [2, 3]. In this context, the role and status of regional economy is becoming more and more important. A correct understanding and careful study of the law, function and operation mechanism of economic development and change within a certain area will help us to understand the relationship between regional economic development regularity and influencing factors, which will benefit the coordinated development of the whole national economy [4]. The regional economy is a large system composed of many interrelated elements with certain causality [5]. There are many factors that affect economic development, such as production, consumption, price, investment and other factors. In addition, the uncertainty of the movement of system factors makes the regional economy fluctuate around its general trend in its own operation [6]. One of the main functions of regional economic management is to predict the development and trend of regional economic system. On this basis, economic development plans and economic decisions are worked out to determine the goals of economic management and the realization of this goal plan, and take measures of regulation and control [7, 8]. It can be seen that a scientific and rational economic prediction for a certain area and a scientific development plan based on it is of great significance for promoting the sustained, rapid and healthy development of the region’s economy.
The main contribution of this paper is to using grey system theory, data processing can reduce its randomness and strengthen the inherent trend of data, so it is possible to use as few data as possible to establish a model describing economic system. The conclusion of the study has a certain reference value for the formulation of macroeconomic policies.
This paper is organized as follows: The related work is introduced in Section II. The industrial network model and index system construction in Section III. Prediction model of regional economic development in Section IV. Empirical analysis of complex correlation coefficient and weight in Section V. Finally, Conclusions are given in Section VI.
Related work
In addition to paying attention to the hard economic strength, the potential of regional economic development should also pay attention to the soft power of the economy, and it cannot be evaluated only by economic indicators. Aroche [7] constructs the potential model of regional economic development [7]. Qin [8] simulates a qualitative input-output method [8]. Rodrigues [9] analyzed the fault-tolerant control mechanism and tested the simulation results of the data [9] Sontag [10] analyses the application of identifying bilinear systems and the controllability of data [10]. So in addition to selecting indicators of economic dimension, this paper also selects indicators of science and education dimension, ecological environment dimension and social dimension to achieve the purpose of forecasting the comprehensive development of regional economy.
(1) Dimensions of science and education
Now the economic development is no longer a time to rely solely on human resources. The place where the advanced factories need manual operation is only a few key positions on the production line. With the continuous development of the society, Taieb [11] notes the proportion of human resources in the world’s economic development is becoming smaller, and the proportion of science and technology is becoming larger [11]. The development of modern economy cannot be separated from science and technology and education. The rapid transformation to real productivity in the world and the rapid development of science and technology has become the main driving forces of modern productive forces [12]. To observe the development of the whole world, one of the most important factors to be noted is the rapid development of science and technology. Van [12] said education plays a key role in science and technology and economy. China is the most populous country in the world [12]. Verdult [13] research about the huge population has become a heavy burden of economic and social development [13]. To develop the economy, we must improve the quality of the population and transform the heavy burden of overpopulation into the great advantage of human resources. In order to achieve this change, the key is education.
(2) Ecological environment dimension
It has become a symbol of China in the new century to coordinate the relationship between ecological environment protection and economic development, take appropriate countermeasures and develop green economy and circular economy. The use of environmental protection to promote economic restructuring has become an inevitable trend of economic development [14]. Vicario [15] said the protection of the environment is the protection of the productive forces, and the improvement of the environment is the development of the productive forces [15]. China has put forward the concept of Scientific Outlook on Development, the new concept of achievement, green GDP, sustainable development, developing circular economy, taking the road of new industrialization, developing eco agriculture, changing the mode of economic growth, building a resource conserving society and environment-friendly society, which includes thinking from the angle of ecology economy thought.
(3) Social dimensions
Social public service provides a lasting power for the development of the national economy. Good social public service can effectively solve all aspects of basic life, health and education, improve consumption level, and affect the economic development of various industries [16]. This series of chain reactions will promote regional economic development. In the course of the development of the country, a lot of energy is always taken to solve the problems of health, employment, policy and public opinion [17]. We are going to run with the public service level of national economic development to adapt to the actual needs of economic development. To meet the actual needs of economic development, we need to carry out various constructions to prevent a large number of unreasonable capital planning, post function setting and system construction from slowing down economic growth, so as to create a better social environment for China’s economic development.
Model and index system construction
Model construction
There are a lot of methods to build the industrial network model. The modeling of industrial network model is described as follows:
First, to select the coefficients of the modeling. The network model is established based on the input-output data matrix (such as the intermediate transaction volume matrix, consumption/distribution coefficient matrix, and the other matrices calculated by intermediate transaction volume matrix and consumption/distribution coefficient matrix) [18, 19]. Different numerical matrix represents different meanings of the industrial network model. The consumption coefficient represents the industry.
Second, to determine the critical value. Supposing that the number of industries in the whole industry system is n, then E (i, m) refers to the coefficient of Item i in the m-th industry. E (1, j) , E (2, j) , …, E (n, j) (j = 1, 2, ⋯ , n) are arranged in descending order, and the Weaver-Thomas index of the coefficient of Item i in the m-th industry is calculated as:
W matrix stands for the Weaver-Thomas matrix. Supposing k j = min {W (1, j) , W (2, j) , …, W (n, j) , }, then the corresponding index k j of the j-th industry is the critical value. By calculating the Weaver-Thomas index, n independent critical values α1, α2, …, α n are obtained for n rows. Similarly, taking “column” as the unit to search for the critical value, n independent critical values β1, β2, …, β n are obtained for n columns.
Third, to construct the 0-1matrix. In each row or column of the W matrix, the element that is greater than (or equal to) the critical value is defined as 1 which indicates that there is an edge between the corresponding nodes; the element that is smaller than the critical value is defined as 0 which indicates that there is no edge between the corresponding nodes [20]. After doing this, the industry is put in the original order to obtain the 0-1matrix M of the industrial network model.
Fourth, to draw the industrial network diagram. The industrial network diagram is drawn based on the 0-1matrix. If Mij = 1, there is a directed edge from industry i to industry j, and if Mij = 0, there is no incident edge between industry i and industry j.
After completing the four steps, the industrial network model is constructed. Zhao-Model is able to effectively identify the significant input-output relationship between industries.
Concept and index system construction
The analysis of industrial network must be based on the understanding of the connotation of industrial network. Industrial network has three levels of meaning: the first level refers to the relationship between industries, describing the interdependence and influence between industries, which is the basis for illustrating industrial linkage; the second level explains the relationship between a single industry and the entire industry system, depicting the status and influence of a single industry in the whole industry system; the third level refers to the relationship structure between industries, presenting the overall characteristics and attributes of industrial relations [21]. The first and second levels of meaning are analyzed on the basis of input-output relationship, and the third level is analyzed based on the diagram as well as industrial network [22, 23].
According to the connotation of industrial network, the various types of relationship structure in the industrial network are grouped into two fundamental types: the one is the relationship structure which takes a specific industry as the research object, and represents the relations between the industry and other related industries; the other is the relationship structure which takes a specific relationship structure as the research object, and explains the special sub-networks in the industrial network [24]. The two fundamental types completely describe the topological structure of industrial network, and they are the basis for the research on industrial network linkage [25]. The former type is called industrial neighbor linkage, and the latter is known as industrial local linkage. In the two types of linkage, some are defined as the important relationship structures including the forward and backward linkages, the linkage with good connectivity, and the linkage of significance for the connectivity of the network, and they present different industrial linkage effects.
Industrial linkage indices are used to describe the status and role of a specific industry in the whole industry system. In this paper, industrial linkage indices are analyzed from six perspectives: the linkage degree of an industry, industrial cycle degree, industrial network structural hole, industrial betweenness, industrial network effect coefficient, and industrial lateral linkage. They are the fundamental indices for identifying and determining the key industrial clusters in the region.
(1). The Linkage Degree of an Industry
The degree of the nodes in the network is a simple but significant index to describe a single node, and it is called the linkage degree of an industry in the industrial network [26]. According to the linkage directions, it is further divided into linkage out-degree and linkage in-degree. Industrial linkage out-degree presents the number of forward industries directly supplied by industrial nodes, while industrial linkage in-degree describes the number of backward industries which are directly demanded by industrial nodes. Supposing that N represents the industrial network, and A = (a
ij
) n×n is the adjacentmatrix of N, then there will be:
ID i represents industrial linkage in-degree, and OD i stands for industrial linkage out-degree.
(2). Industrial Cycle Degree
The cycle degree of an industry refers to the number of directed cycles crossing the target industry in the industrial network, depicting the neighbor linkage in the industrial circulation and reflecting the industry’s ability to participate in the economic circulation. The more the cycles are, the more industries the industrial circulation affects, indicating that the industry is more important in the economic cycle. Generally, the relative value of industrial cycle degree is used to describe the cycle degree of each industry in the entire industry system, and it is calculated as follows:
dc (i) represents the cycle degree of industry i, and pd c (i) stands for the relative cycle degree of industry i, showing the percentage of the cycle degree of industry i in the sum total of the cycle degree of all the industries in the industrial network.
(3). Industrial Structural Hole
Structural hole is an important concept in social networks, which describes the indirect relationship or intermittent relationship in the social network. Such kind of relationship also exists in the industrial network. Therefore, the concept of “industrial structural hole” is proposed to depict industrial neighbor linkage. Industrial structural hole is defined as the ability of the target industry in obtaining and controlling resources due to the existence of indirect relationship or intermittent relationship in the industrial network [27]. The industrial nodes in the places of structural holes have competitive advantages over the nodes in other places, including information as well as resource advantages [28]. Consequently, special attention should be paid to keeping these industries from becoming the bottleneck of regional development. In this study, the two structural indices of “industrial degree of restriction” and “industrial efficient scale” are adopted to depict the state of industrial structural hole.
Industrial effectiveness refers to the number of structural holes the industrial nodes own in the industrial network. It is the result of the linkage degree of an industrial node minus the redundant relationship in the individual network of the industrialnode.
Industrial degree of restriction refers to the extent to which the target industrial node is directly or indirectly related to other industrial nodes. The greater the degree of restriction is, the better the industrial network is closed, and there are less structural holes in the industrial network. Industrial degree of restriction can be calculated through the structure constraint algorithm proposed by Burt.
(4). Industrial Betweenness
Industrial betweenness refers to the number of shortest paths to the industrial nodes in the industrial network. This index reflects the control ability of industry i over the node pair in the industrial network when the two nodes exchange resources along the shortest path. The industrial node in the intersection place of multiple industrial relations has greater industrial betweenness, and generally is the regional key industry or bottleneck industry. Industrial betweenness is calculated as follows:
l
mn
represents the total number of shortest paths between industrial node m and industrial node n, and
(5) Industrial Network Effect Coefficient
Industrial network affecting refers to the process in which the changes of an industry in the national economy transfer in echelon through network paths to directly or indirectly cause other industries to change [29]. According to the affecting directions, it can be grouped into backward affecting and forward affecting. Industrial network effect coefficients are used for the quantitative description of these two kinds of effect. The coefficient used to describe the backward affecting is called industrial network influence coefficient, referred to as FC; the coefficient used to describe the backward affecting is known as industrial network reaction coefficient, referred toas EC.
Since the industrial affecting transfers in echelon, the k-echelon backward affecting is denoted by k - FC, and the k-echelon forward affecting is denoted by k - FC. k is a positive integer.
Supposing that N (N = (V, E)) refers to the industrial network, n represents the number of industrial codes, and w
ij
is the weight of arc (i, j), then it can be seen that w
ij
= 0 when (i, j) ∉ E. k - FC
i
refers to the k-echelon industrial influence coefficient of industry i, and k - FC
i
represents the k-echelon industrial reaction coefficient of industry i.
k refers to the number of echelons affected by industry i, ID t represents industrial linkage in-degree, and OD t stands for industrial linkage out-degree (t∈ { i, j, …, m }).
The weight matrix a ij ⩾ 0 refers to direct consumption coefficient matrix, direct distribution coefficient matrix, Leontief inverse matrix, or Ghosh inverse matrix. In special cases when the linkage coefficient a ij ⩾ 0, a complete industrial network is obtained. When the weight matrix is Leontief inverse matrix, 1 - FC i and 1 - EC i of industry i represent the influence coefficient and reaction coefficient respectively in the input-output linkage analysis. When the weight matrix is Ghosh inverse matrix, 1 - EC i of industry i stands for the revised reaction coefficient in the input-output linkage analysis. As a result, the input-output linkage analysis is a special case of industrial network linkage analysis.
(6). Industrial Lateral Linkage Degree
An industry sector may have lateral linkage with multiple industry sectors, thus having a strong lateral effect which can be measured by lateral linkage degree. The lateral linkage degree of industry i refers to the number of industries having linkage with industry i. It is divided into the synergetic lateral linkage degree and competitive lateral linkage degree.
Supposing DN c is a synergetic lateral linkage network, DN c = (V (N) , E (DN c ) , W1), i, j ∈ V (N), ij ∈ E (DN c ), and w1(ij) ∈ W1, then the total weight of all the edges having synergetic lateral linkage with industry i is called the synergetic lateral linkage degree of industry i, and it is denoted by sd c (i) = ∑w1(ij).
Supposing DN r is a competitive lateral linkage network, DN r = (V (N) , E (DN r ) , W2), i, j ∈ V (N), ij ∈ E (DN r ), and w2(ij) ∈ W2, then the total weight of all the edges having competitive lateral linkage with industry i is called the competitive lateral linkage degree of industry i, and it is denoted by sd r (i) = ∑w2(ij).
Connotation and characteristics of coordinated development of regional economy
As mentioned earlier, the coordinated development of the regional economy can be understood from different angles, and thus every aspect, as long as the content is relatively independent, one can and should be coordinated development of regional economy. But on the whole, it can be roughly divided into two parts: regional total structure coordination and regional economic coordination Coordination of regional total structure: That is, the coordination of regional development level and the coordination of development speed. The coordinated development of regional economy requires that both the efficiency goal and the balance target should be taken into account in the proportion of the total amount of the region, so that the regional economy will develop into a high level and a virtuous circle. Not only to optimize the high speed and the investment benefit of the excessive pursuit of economic growth, the minimum balance expense, not speed and efficiency at the expense of the country’s economic growth at the cost of enforcing the regional balance. Coordination of regional economic relations: The coordination of regional economic relations mainly contains two aspects: first, the coordination of regional industrial structure. The coordination of regional industrial structure means that the formation and adjustment of regional industrial structure should be carried out in accordance with the principle of rational organization of regional division of labor and regional advantages. Secondly, coordination of inter-regional flow of elements. That is, efforts should be made to eliminate all kinds of obstacles hindering the flow of regional production factors, and through the cultivation of regional markets and national unified markets, the establishment of sound market rules andregulations
Based on the above analysis and the coordinated development of regional economy, and considering the characteristics of China’s economic development, the coordinated development of regional economy is defined as: mutual openness, regional economic exchanges have become increasingly close, the regional division of labor more reasonable, not only keep the overall regional economic growth and the high, the gap of economic development between regions in the control reasonable and proper scope and gradually converge, the benign interaction between the positive and the state and process to achieve the economic development between regions. Characteristics of coordinated development of regional economy:
Comprehensiveness: The coordinated development of regional economy is a comprehensive concept. It does not merely refer to the coordination of one aspect, but the summation of all kinds of coordination relations among regions. Whether it is in the process of regional economic development of regional structure of total coordination or regional economic coordination, is one of the coordinated development of the regional economy, are not all content, cannot cover the whole concept of the coordinated development of regional economy.
Interoperability: The coordination of regional economic development in the process of change and development of every region are without prejudice to the other party or to hinder the development of the premise, but also make a regional economic development has become another favorable conditions for regional economic development. In other words, each region to other regions as constraint conditions, choose their own factors, adjust the structure, change their own functions, in order to adapt and promote the development of other regions, the regional elements constantly update and optimize the structure and inter regional mutual dependence and mutual promotion, to the regional economy to achieve sustained development in the dynamic feedback process.
Dynamic property: The coordinated development of regional economy is a dynamic concept, not a static one. This includes two aspects: first, the coordinated development must be dialectically understood. Development is the prerequisite for coordination. Only with respect to development can there be coordination. Coordination is the stipulation about the development process. Without development, there is no coordination. Isolated, static systems, because of its lack of process, only balance without coordination. Two, coordination is conditional. A structure and relationship between countries in the region cannot always maintain a state, under certain conditions, a kind of structure or relationship is optimal, but with the change of condition, it may be suboptimal, non-optimal or even unreasonable under changed conditions. Therefore, it is necessary to understand and understand the coordinated development of regional economy with dynamic rather than static methods.
Hierarchy: The coordinated development of regional economy is a relative concept, and “coordination” is relative to “disharmony". Because of the existence of relativity, the coordinated development of regional economy will be divided into degrees, that is, according to the degree of coordination, it can be divided into different levels, such as coordination, basic coordination and coordination.
Prediction model of regional economic development
Construction of index system
In order to predict the potential of regional economic development, the previous related literature has been systematically combed and summed up. Drawing on the index system of regional economic development potential put forward by many experts and scholars, the author establishes regional economic development potential index system from four aspects: economic dimension, science and education dimension, ecological dimension and social dimension. The results are shown in Table 1.
Index system for regional economic development potential
Index system for regional economic development potential
Because the data units of each index are inconsistent, it may lead to a great difference between the observed value and the real value. In order to avoid the influence of different dimensional differences on the development index evaluation, the original data is dimensionless. The calculation formula is as follows:
3.3 determine the weight of each index
In multi index comprehensive evaluation, index weight is the most basic and critical problem. The assignment of weights can directly affect the accuracy and scientificity of evaluation results. Generally speaking, in a multi index comprehensive evaluation, the change of an evaluation index can be explained by the change of other indicators, indicating that the role of the index in the comprehensive evaluation system is smaller, and it should be given its smaller weight; otherwise, it should give greater weight. Based on this, the weight of each evaluation index is determined by the weight of the complex correlation coefficient method. The specific operation steps are as follows:
According to the formula (2), the correlation coefficient matrix D and the complex correlation coefficient ki can be obtained for the m index.
In formula (4), D-i represents the correlation coefficient matrix of the removal of the index Xi. The greater the complex correlation coefficient ki shows, the greater the possibility of the index Xi being influenced by the remaining m-1 indicators, the smaller the corresponding weight in the comprehensive development evaluation system.
The correlation coefficient of ki and the countdown was normalized to obtain the weight λ
i
of each evaluation index.
Data collation
According to the index system of regional economic development potential that has been arranged, the data of relevant indexes are collected and collated first. With the Chinese Statistical Yearbook and other related websites as the main data sources, the basic index data is obtained through detailed inspection and comparison analysis. On this basis, SPSS19.0 and DPS data processing software are used to further collate the original data.
Determine the weight of the index
Calculation results of complex correlation coefficient and weight
Calculation results of complex correlation coefficient and weight
After consulting a lot of literature and simulation experiments, this paper applies multiple regression prediction model to predict the potential of regional economic development combined with the advantages and characteristics of the model. An important application of multiple regression forecasting models is to predict future trends based on knowndata.
For the model
If the observed value of the explanatory variable is given outside sample
Similarly, it is strictly said that this is only the estimated value of the predicted value of the explanatory variable, not the predicted value. The reason is the uncertainty of the parameter estimation in the model and the influence of the random term in two aspects. So, what we get is only an estimated value of the predicted value. In order to make scientific predictions, the confidence intervals of the predicted values are also needed, including the confidence intervals of E (Y0) and Y0.
(1) The confidence interval of E (Y0)
We know that
Because
This is easy to prove that
The sample estimates
So, we get the confidence interval of E (Y0) at the confidence level of (1 - α):
(2) The confidence interval of Y0
If the actual predictive value Y0 is already known, the prediction error is:
This is easy to prove that
e0 obeys normal distribution, that is e0∼N (0, σ2 (1 +
The estimator
Constructs the unified t measurement
The confidence interval of Y0 under the confidence level of a given (1 - α) can be obtained.
Model fitting analysis
Under the confidence of 95%, the critical value t0.025 (19) =2.093, the estimated value of the variance of the random perturbation term is
So the 95% confidence interval of
In the same way, the confidence interval of 95% of
The fitting degree of prediction model is 90% and the mean square error is 705.5, which indicates that the prediction results obtained by this prediction model are relatively accurate, and the statistics show that the result is 1796, within the (1711.11842.4) interval, so the prediction model of regional economic development potential is established.
Results analysis
The target data from 2013 to 2017 are selected as the original data to predict the potential of regional economic development for the next four years, as shown in Table 3.
Comprehensive index of regional economic development potential and the development index of each dimension
Comprehensive index of regional economic development potential and the development index of each dimension
In order to predict the growth trend and evolution characteristics of regional economic development potential comprehensive index and dimension development index conveniently, we draw the sequence diagram of regional economic development potential comprehensive index based on the data in Table 3, as shown in Fig. 1.
Coordinated development of regional economy.
From the forecast results, we can see that the regional economic development in the next four years will show an upward trend. The growth rate of the economic dimension is increasing, the momentum of development is the fiercest and the potential for development is the greatest. The social dimension and ecological dimension are slightly lower than the economic dimension, and the growth rate of the science and education dimension is basically guaranteed.
The industrial linkage out-degree and in-degree of each of the sectors is obtained, and they are shown in Figs. 3 and 4. From the perspective of linkage structure, the industries with high degree of linkage are the dominant or bottleneck industries in the region, and they are in need of detailed analysis in accordance with their technologies as well as economic benefits. Industries can be divided into three types according to the industrial linkage out-degree, namely, the industries with strong pushing force, industries with moderate pushing force, and industries with weak pushing force.

Sequence diagram of regional economic development potential index.
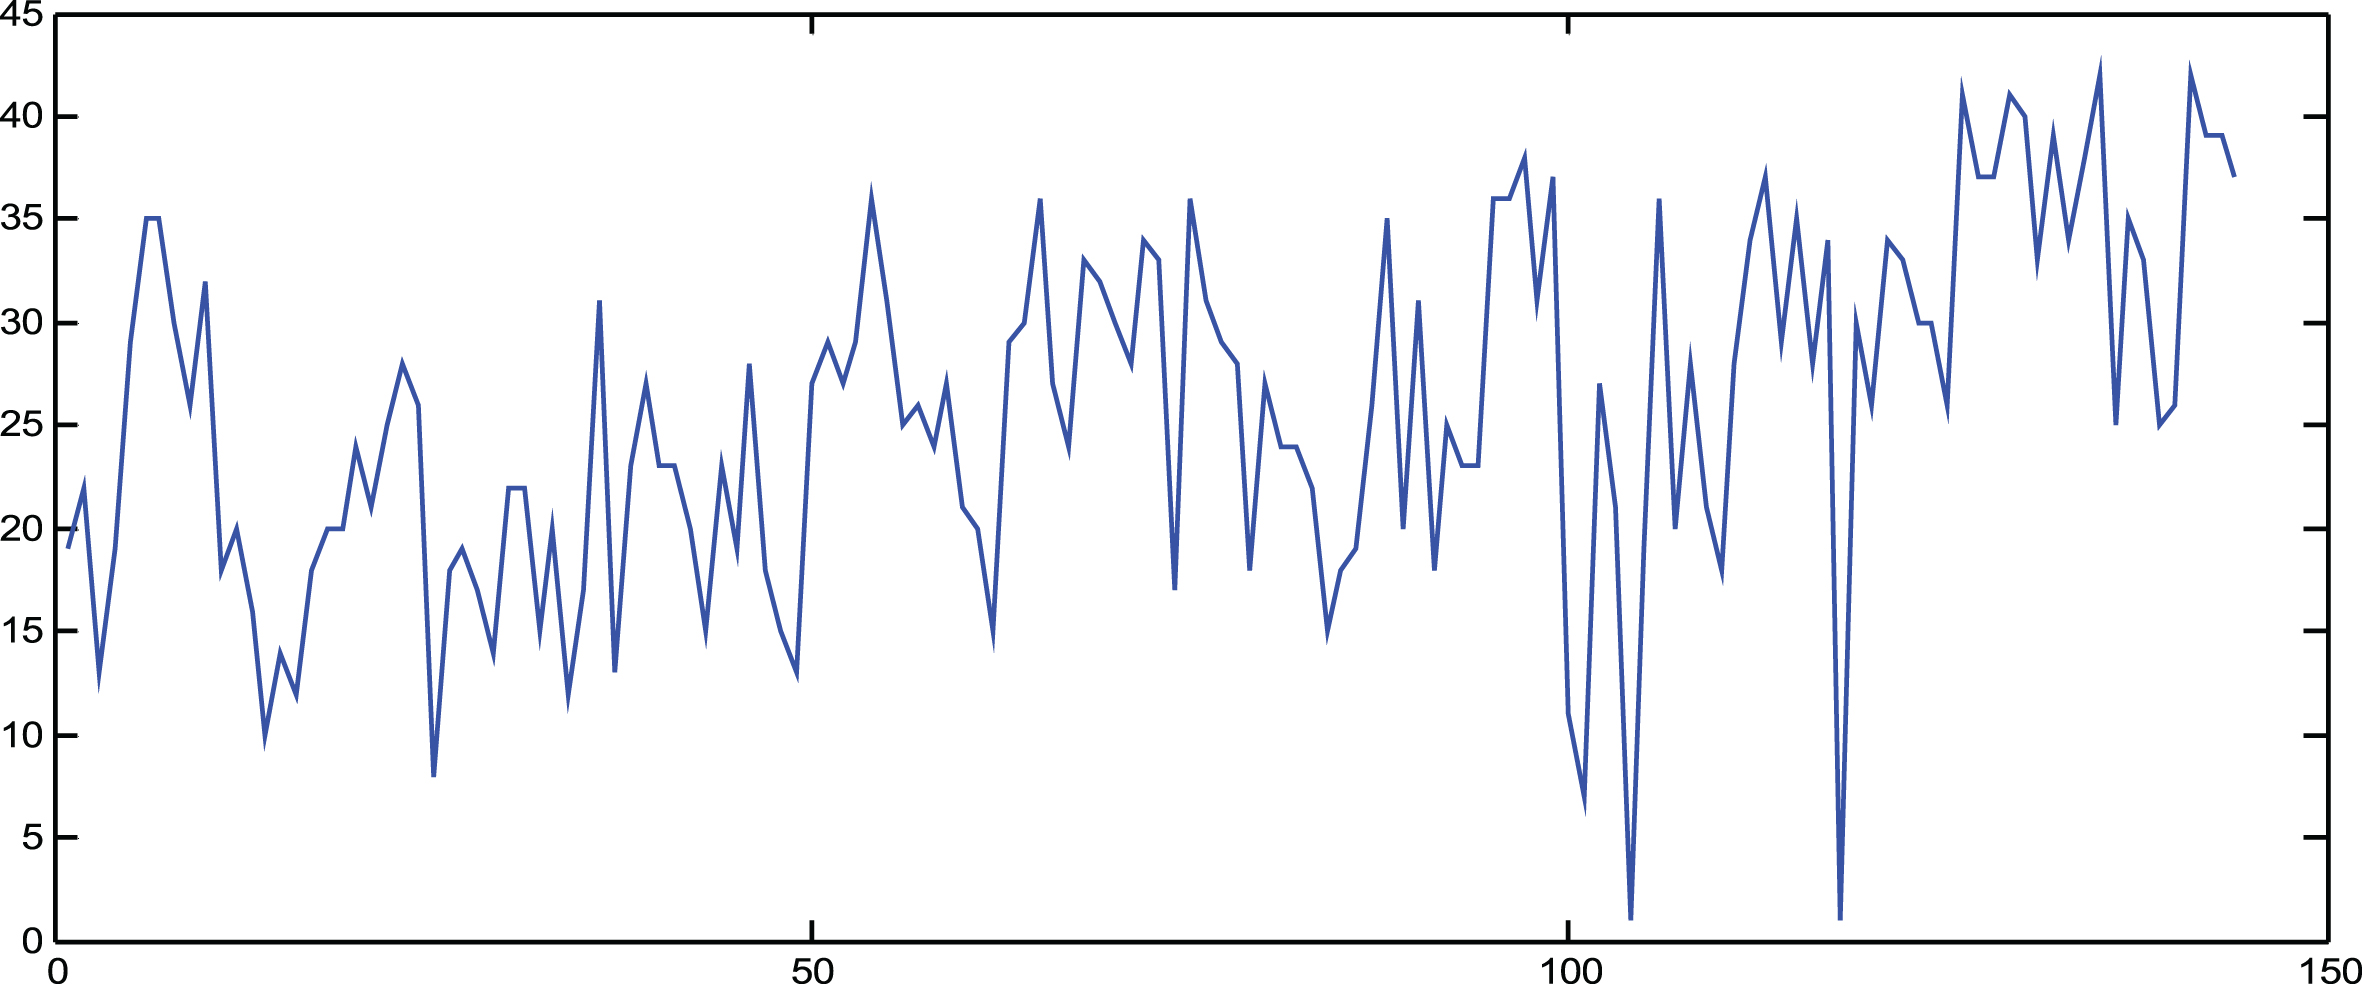
The linkage out-degree.
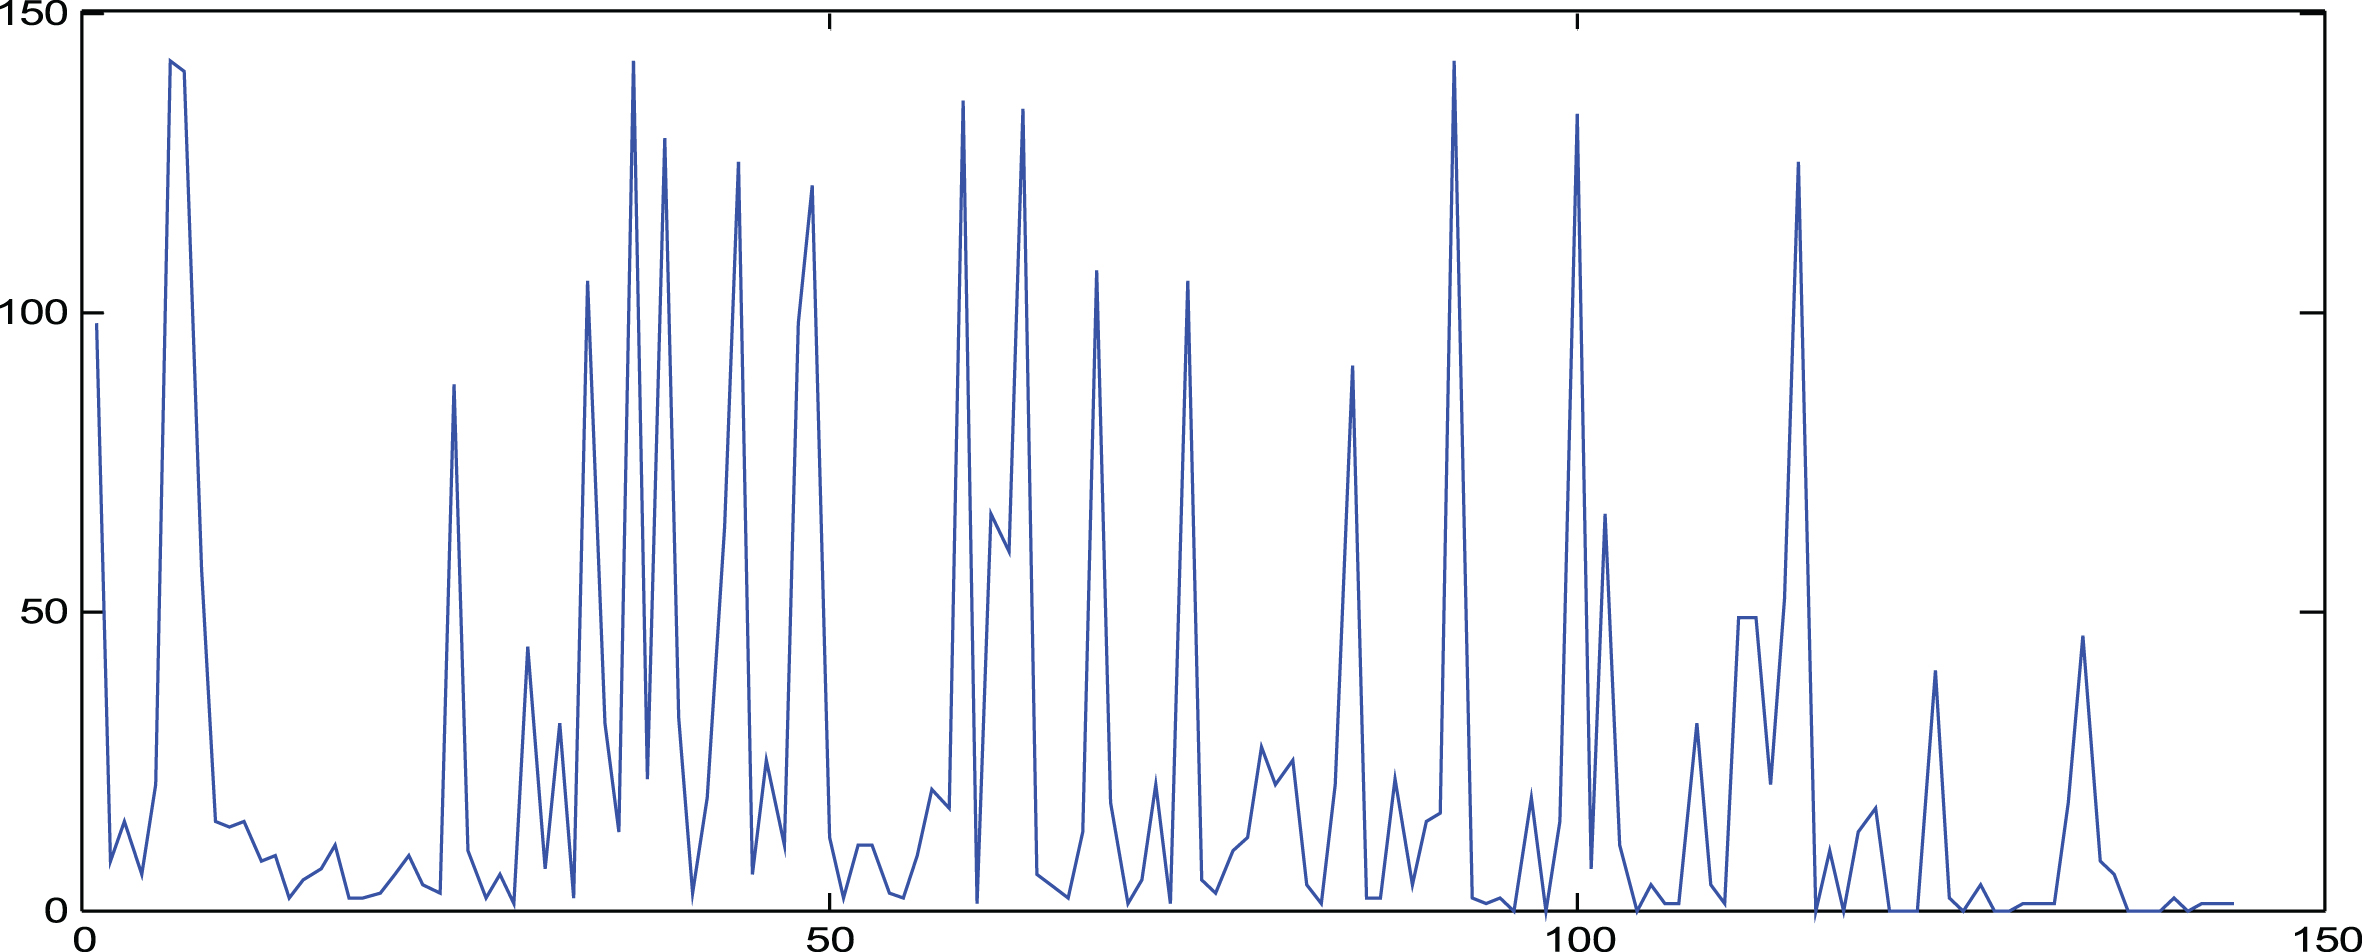
The linkage in-degree.
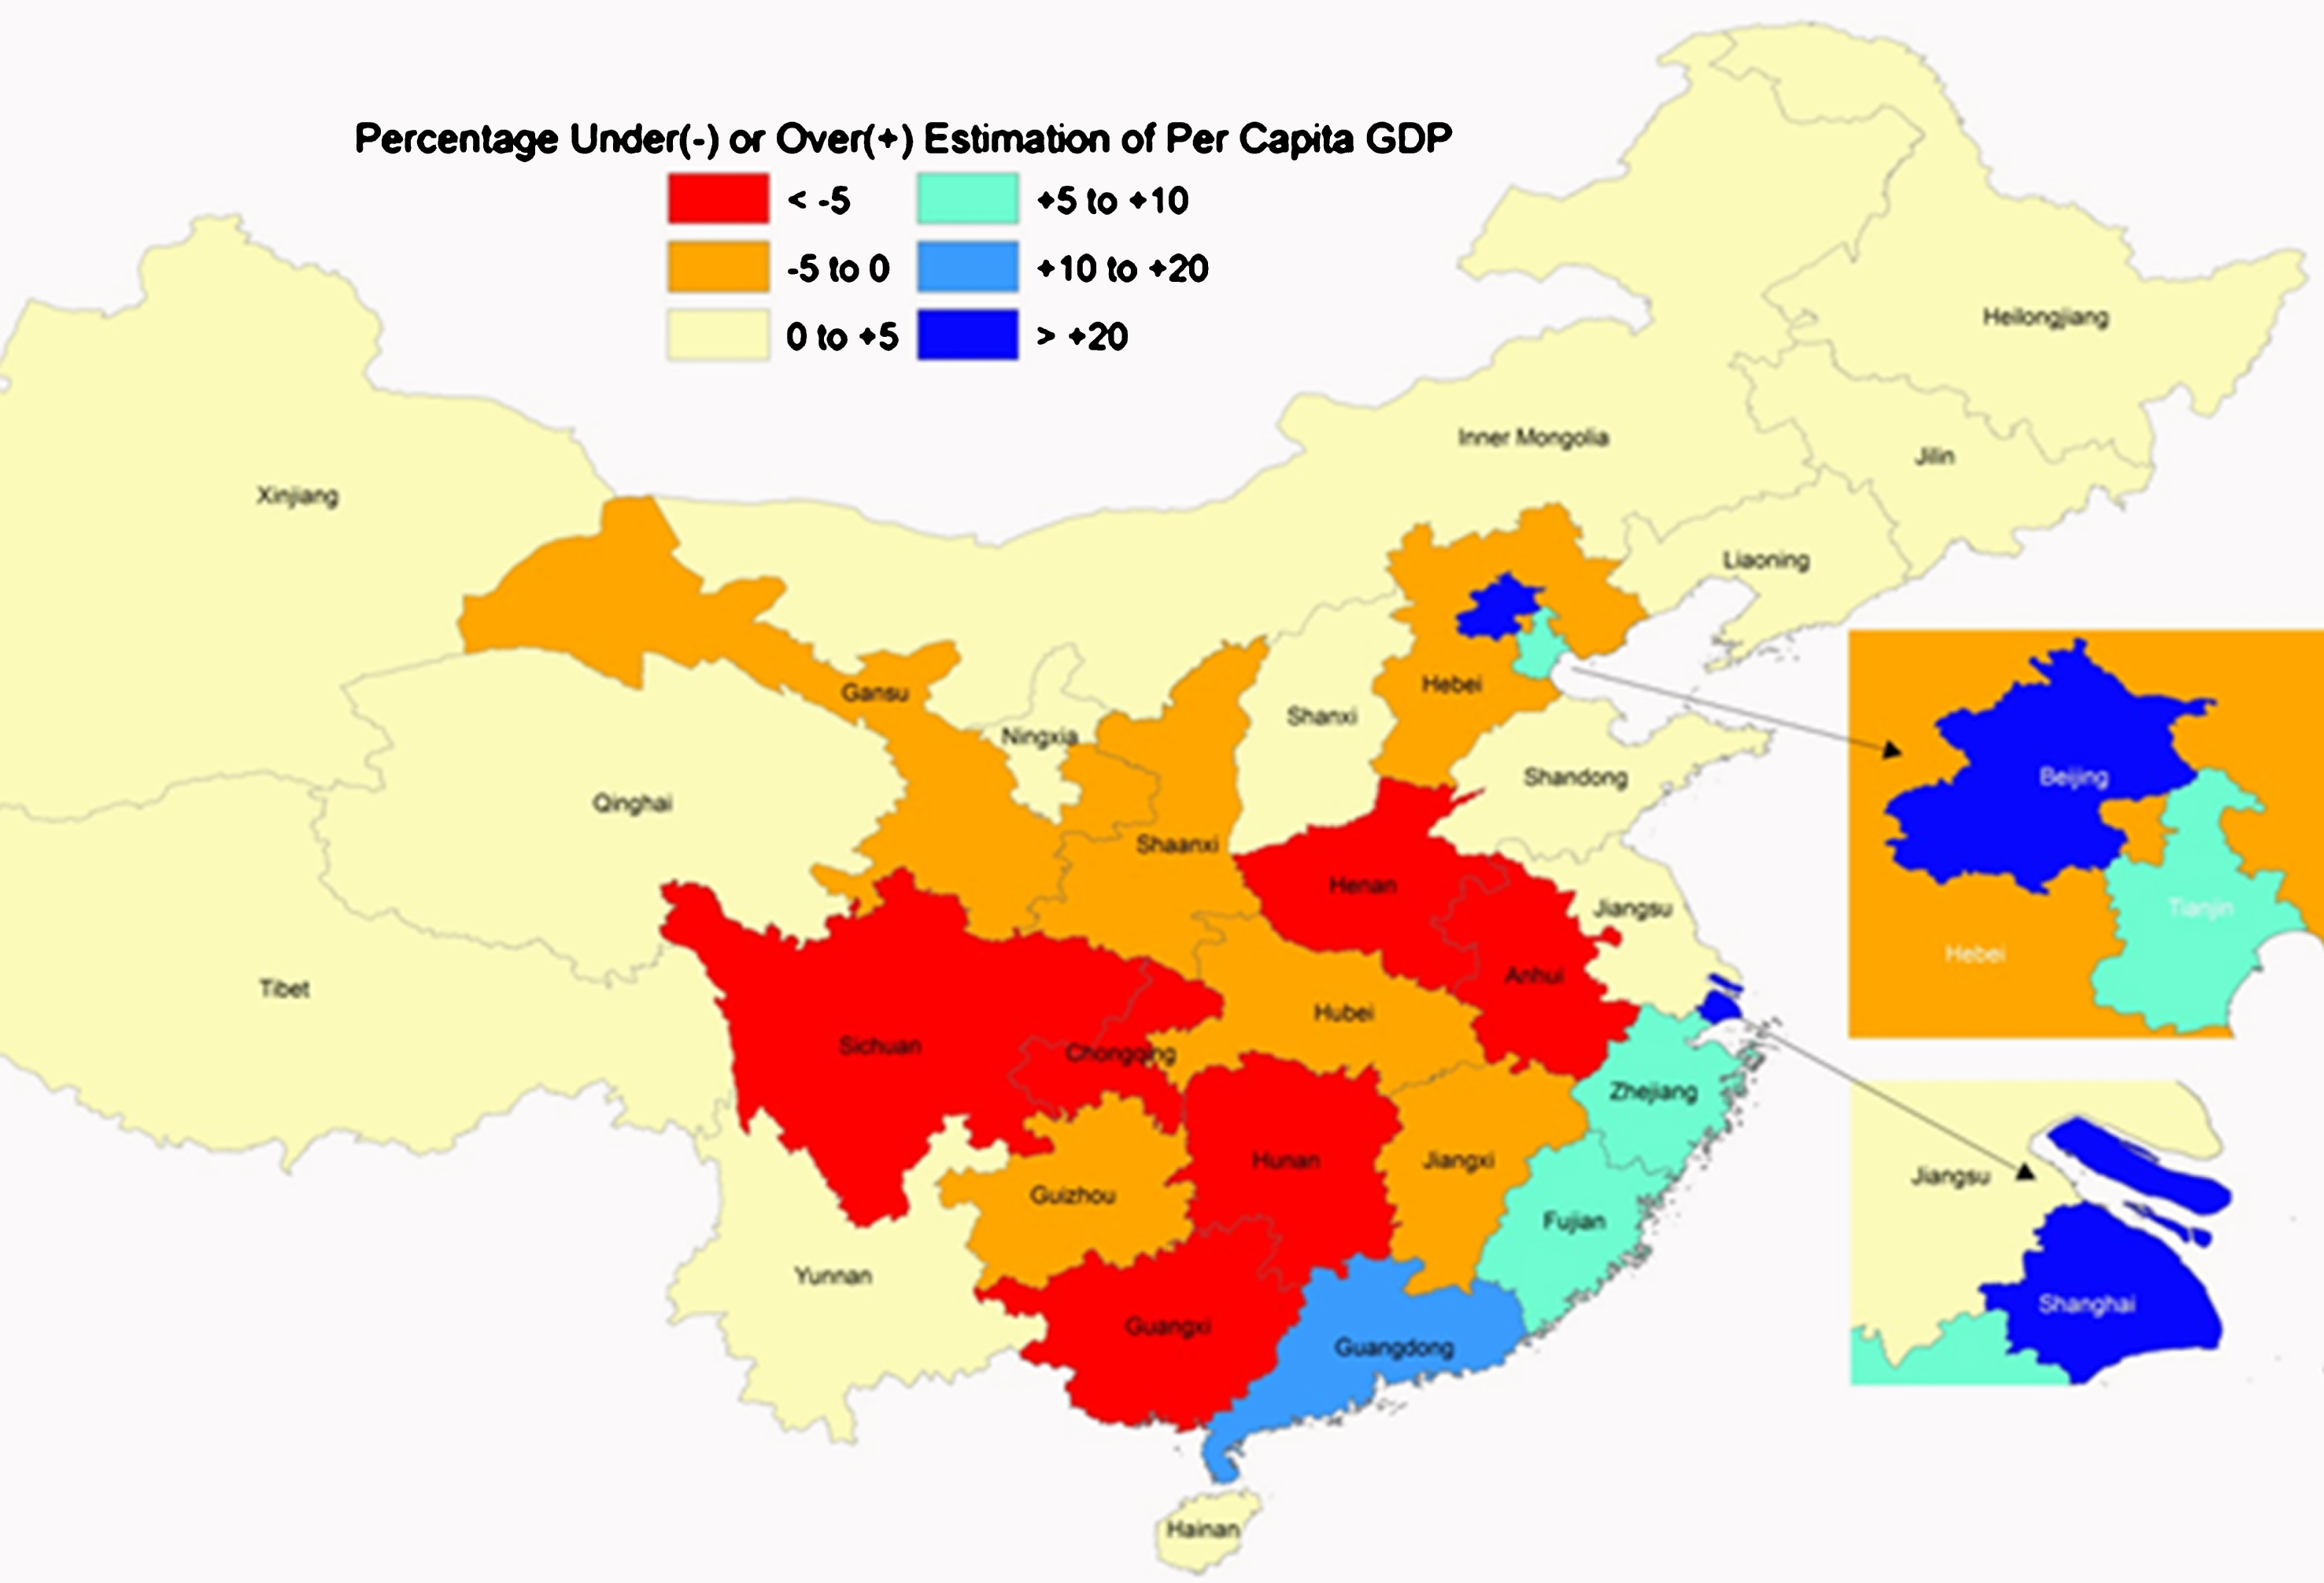
In this paper, we analyze China’s economy in the 1980–2015 to meet the β convergence, if the growth rate, convergence rate β and average period of T is fixed, the average growth rate of GDP per capita as:
Make the initial per capita GDP coefficient as:
In a given β, with T-t decreases, i.e., the average growth rate time span is long, coefficient is small, when T-t tends to infinity, alpha will tend to 0; when the T-t tends to 0, α will tend to β, if the estimated β results are greater than 0, which indicates that the test area in the time period T with absolute convergence. Establish regression model:
Among them:
If b is less than 0, corresponding to the β will be greater than 0, it indicates that the regional per capita GDP average growth rate in T - t period and the initial period of per capita GDP is negative correlation, and the corresponding economic obey absolutely convergent, i.e. backward regional economic growth will be compared with the developed region faster; phase reverse if b is greater than 0, corresponding β will be less than 0, then there is no absolute convergence.
Beta convergence test results
Table 1 shows the China’s regional economic growth regression results. The results show that the economy of our country in the sample period 1980–2010 absolute regression coefficient B is less than 0, and the coefficient a and B in 1% level significantly and estimate the beta that is greater than 0, indicating that the economy of our country in 1980 to 2010 economic growth in absolute beta convergence. The sample is divided into the three sample period, the results found that the absolute regression coefficients in the sample period 1980–1990 and 2005–2015 of the two sample period is less than 0, and then the estimated beta is greater than 0, and the two factor is at the 1% level significantly, that in the two sample period in China absolute convergence of regional economic growth; and the absolute regression coefficients in the sample period during 1990–2005, b is greater than 0, and the estimated beta coefficient a is less than 0, the 1% level significantly b in the 10% level significantly, indicating that our country is in the area between the period of economic growth tends to diverge, differences between regions in this period will be further widened, and the reality is consistent, in this period the eastern coastal provinces has been rapid economic development, the eastern region and western region economy Widening gap.
Eastern region under the excitation of various preferential policies, economic marketization and opening degree obtained rapid increase, making the region has a strong economic foundation, which in turn accelerates the economic growth; for the central and western regions, not only geographical location is not advantage and industrial base is relatively weak, and level of reform and opening up to catch up with the eastern region, which will increase the economic gap between the middle, Western and Eastern, the economy of our country region showing a zonal differences. But in the same regions as in the same geographical location and the development condition, the economy will be easy to achieve convergence, then China’s economy whether in the three major economic regions of East, middle and West Meet club convergence. This paper will be based on the per capita GDP data in each region to analyze. According to the contents of the front, the eastern region with Beijing, Tianjin, Hebei, Liaoning, Shanghai, Jiangsu, Zhejiang, Fujian, Shandong, Guangdong and Hainan the 11 provinces; Shanxi, Inner Mongolia, Jilin, Heilongjiang, Anhui, Jiangxi, Henan, Hunan and north of the lake is the nine provinces in Central region; western region have Sichuan, Guizhou, Yunnan, Shaanxi, Guangxi, Gansu, Qinghai, Ningxia and Xinjiang the nine provinces. In the three major economic zones, in addition to the analysis of the whole period of 1980–2010, the results of the study will be analyzed in three stages:
Test results of club convergence in the three major economic zones
Test results of club convergence in the three major economic zones
As an open and dynamic complex system, the development of regional economy involves many factors, such as economy, science and education, ecological environment, social guarantee and so on. The relationship between factors is complex, which eventually leads to a high degree of nonlinear data that reflects the development of the regional economy. Forecasting the potential of regional economic development, responding to the market ahead of time, can effectively prevent the severe economic fluctuations from harming the regional economy, which is very important for the development of regional economy.
Footnotes
Acknowledgments
This work is supported by (1) National Social Science Foundation’s annual general project “Antitrust Economics Research on Vertical Restriction of Manufacturers” (15BJY002); (2) National Social Science Foundation’s later-stage funding project “Research on the Unbalance of Economic Development and the Adjustment and Upgrading of Industrial Structure” (17FJY014); (3) Research on the Evaluation System of the Quality of Higher Vocational Education in Hubei Province (2017ZDZB12), a major tendering project of the Educational Science Planning of Hubei Province in 2017. (4) Focus Research Base of Humanities and Social Sciences in Hubei Higher Education Institutions (Hubei Skilled Talents Training Research Center).