
Abstract
At present, the application of artificial intelligence in the identification and classification of sports technology is still relatively small, and it is difficult to effectively improve the training and competition quality of athletes. Based on this, this study takes badminton as an example for analysis. Moreover, based on the complexity and multi-deformation of this motion, this study uses machine learning as the basic algorithm to design a real-time classification algorithm for badminton action. At the same time, this paper improves the traditional algorithm, designs an improved training model, and verifies the effectiveness of the design algorithm by experimental method. In addition, this paper constructs a feature statistics and pace training system with the support of machine learning algorithms through statistical analysis and statistical badminton technical features and realizes the intelligentization of badminton batting action classification and recognition. Finally, this paper designs a comparative test for system functional testing. The system test shows that the system can effectively improve the action classification and recognition effect and can provide theoretical reference for subsequent related research.
Introduction
People hope to quickly find highlights or stars in a large number of football game videos, or to appreciate a very technical movement. This requires the video system to have the ability to discern actions and collect clips, and machine learning is an effective way to solve this problem. It is not just for the audience, it is also true for the sports training process. Through machine learning technology, technical analysis can be effectively carried out, and the lack of training can be found in time to correct, and the effective physical improvement effect can be improved. At the same time, with the changes in the rules of sports competition, new technologies and different styles of play have emerged more. The new technology has become an important scoring method in the competition, so it is necessary to combine the actual situation to carry out technical analysis of sports competitions [1].
In recent years, with the rapid development of artificial intelligence and machine learning and the continuous iteration of artificial intelligence technology, the application of artificial intelligence in various fields has increased dramatically, and a new wave of industrial revolution of “artificial intelligence +” has been formed. Among them, artificial intelligence has also begun to appear in the field of sports. Taking the popular badminton sport as an example, some products of data analysis and intelligent movement have emerged, and the charm of artificial intelligence technology applied to traditional sports has been initially demonstrated [2]. But at present, the application of artificial intelligence in badminton is limited in depth and breadth. Most of the training methods of badminton use one-on-one or one-to-many manual teaching methods, and the improvement of the player’s own level depends largely on the professional level of the coach. Moreover, there is no more detailed quantitative analysis standard for the player’s technical level and shortcomings. Therefore, there is a lack of targeted training for players to play their individual advantages and make up for their own shortcomings [3]. Therefore, this paper uses the relevant algorithms of machine learning to identify and classify sports technology and promote the application of artificial intelligence technology in the sports industry.
Related work
At present, most researchers at home and abroad focus on feature extraction and classifier design, which can simply classify motion recognition problems into classification problems of time-varying data. The key technology is how to extract more valuable key information from the video data and match the key features to determine the action classification of the test data [4]. At present, the research of behavior recognition is mainly aimed at the analysis and research of human motion with high degree of freedom. Meanwhile, the motion description of the human body in the video is more complicated than the rigid body motion of the vehicle. Therefore, how to choose effective and sufficient expression to realize the recognition and understanding of the content of the expression scene is very difficult [5].
In the past few decades, people have done a lot of in-depth research on moving target detection, feature extraction, classification and behavior understanding methods in video motion analysis, and have achieved certain results, and put forward many effective methods. Foreign researchers have recognized the importance of this topic earlier and developed countries such as the United States and the United Kingdom have conducted in-depth research very early [6]. As early as 2000, the relevant departments of the United States carried out relevant research and set up a visual monitoring major item. In the course of three years, the project has been in-depth research on battlefields and civil scenes in order to achieve automatic analysis technology for real-time monitoring [7]. At present, the main research work of researchers mainly focuses on two key steps of action feature description and classification recognition. Commonly used motion feature representation methods include shape representation, appearance representation, and motion information representation. The shape representation is used to represent the human body posture by establishing a two-dimensional or three-dimensional parametric model of the human body and using the model parameters obtained by the analysis. For example, AF Bobick et al. [8] proposed the concept of motion energy map and motion history graph based on the silhouette contour feature and expressed the behavior characteristics by finding the matrix of the two. D. Weinland et al. [9] extended MHI to a three-dimensional historical action cube, a real-time empty cube, and expressed the behavior using a Fourier amplitude spectrum in a cylindrical coordinate system. Wang Heng et al. [10] proposed a method for characterizing the entire video motion feature using dense trajectories and motion boundary descriptions. Yuan Chunfeng et al. [11] proposed to use 3DR conversion method in space-time interest points to realize motion recognition. Li Wang et al. [12] proposed a 3D feature word bag method for deep video, to identify human motion in the depth image sequence. Specifically, an action diagram is first used to explicitly simulate the dynamics of the motion. Then, a set of 3D points is used to describe a set of prominent pose features that correspond to the nodes in the action map. In addition, the paper also proposes a simple but effective prediction method based on the 3D feature word bag scheme of depth map sampling. The experimental results show that as long as about 1% of the 3D points in the depth map are sampled, more than 90% of the recognition accuracy can be obtained. The recognition error rate of this method is halved compared to the recognition based on two-dimensional contours. Yang Xiaodong et al. [13] proposed another method based on depth image, which models the 3D bone nodes in the depth image sequence to represent the motion. Hussein et al. [14] proposed a method based on the temporal hierarchy covariance descriptors of 3D skeletal node regions. Guha Tanaya et al. [15] proposed a new sparse-coded descriptor for motion recognition for complex actions in video. J. Wang et al. [16] proposed a feature coding method, namely local constrained linear feature coding technology, to improve the image feature recognition ability. This method can replace the traditional SPM. LLC uses local constraints to project each descriptor into its local coordinate system, and the projected coordinate coefficients are maximized to form the final feature representation. Moreover, the effect obtained by the linear classifier method is significantly better than the traditional method. Everts Ivo et al. [17] used a human motion recognition method based on time and space points of interest. The spatio-temporal interest point feature obtains the dynamic characteristics of a long time by analyzing the spatio-temporal context, and uniformly considers the continuity of time and space, and is more robust to the processing of effects such as illumination and occlusion. The method used in this paper is also based on feature extraction of spatio-temporal points of interest and is described in detail in Chapter 3. B. Khaleghi et al. [18] proposed the types and methods of information fusion based on multi-sensor information sources. This includes data-related convergence: data defects, outliers and spurious data, conflicting data, modalities of data, association of data, alignment of data alignment, and processing architecture for multi-source information fusion. In addition, mathematical analysis methods such as Dempster-Shafer evidence theory (DSET), fuzzy set theory, rough set theory, probability map method, serial Monta Carlo (SMC) theory and Markov chain Montaguero (MCMC) are proposed for data fusion [19].
In the academic field, some international journals such as CVIU, IJCV, PAMI, etc., international conferences such as ECCV, ICCV, ICPR, CVPR, etc., all take human motion recognition as an important research direction. Algorithms for human motion recognition, such as dense optical flow algorithm without deep learning, support vector machine algorithm for machine learning, cyclic recurrent neural network algorithm for deep learning, and convolutional neural network algorithm, have achieved certain experimental results in the action video database [20]. In the past ten years, people have carried out a lot of in-depth research on the detection and tracking and classification and recognition methods of human action behavior based on video library and achieved certain results. Moreover, some practical intelligent monitoring systems have emerged, which have made great contributions to the fields of computer vision and video tracking analysis [21].
Theoretical analysis
Visual feature extraction
When analyzing the visual features of the extracted video, a frame near the middle of the lens is extracted as a key frame, and then the visual features of the key frame are extracted. The semantic shots are labeled according to the visual characteristics of the keyframes and other modal features of the shot. The key frame selection method is as shown in formula (1) [22]:
Among them, kf is the key frame, and bf and ef are the start frame and the end frame number respectively, fix () is the rounding operator.
In this paper, keyframes are selected according to formula (1), keyframes are converted to HSV color space, and the chroma (H component) N H histogram, saturation (S component) N S histogram and luminance (V component) N V histogram of the converted image are calculated, [N H = 64, N S = 64, N V = 256. The three-color component histograms of the n-th frame of the video are [23]:
According to formula (2), the variable is defined as:
Among them, Peak (Hist (V)) is the peak of the V component histogram and PeakIndex (Hist (V)) is the position index of Peak (Hist (V)). LeftBound (Hist (V)) is the position index range that varies between 0 and PeakIndex (Hist (V)), and its corresponding value is 1/ - 20 of the peak of the V component histogram, Peak (Hist (V))/ - 20. The calculation of RightBound (Hist (V)) is the same as the calculation of LeftBound (Hist (V)), except that the search direction is from PeakIndex (Hist (V)) to N.LeftBound (Hist (V)) is obtained from the saturation histogram and is calculated in the same way as LeftBound (Hist (V)). Figure 2 illustrates the locations of LeftBound (Hist (V)) and RightBound (Hist (V)).
According to formula (7), it is judged whether the pixel is a stadium pixel.
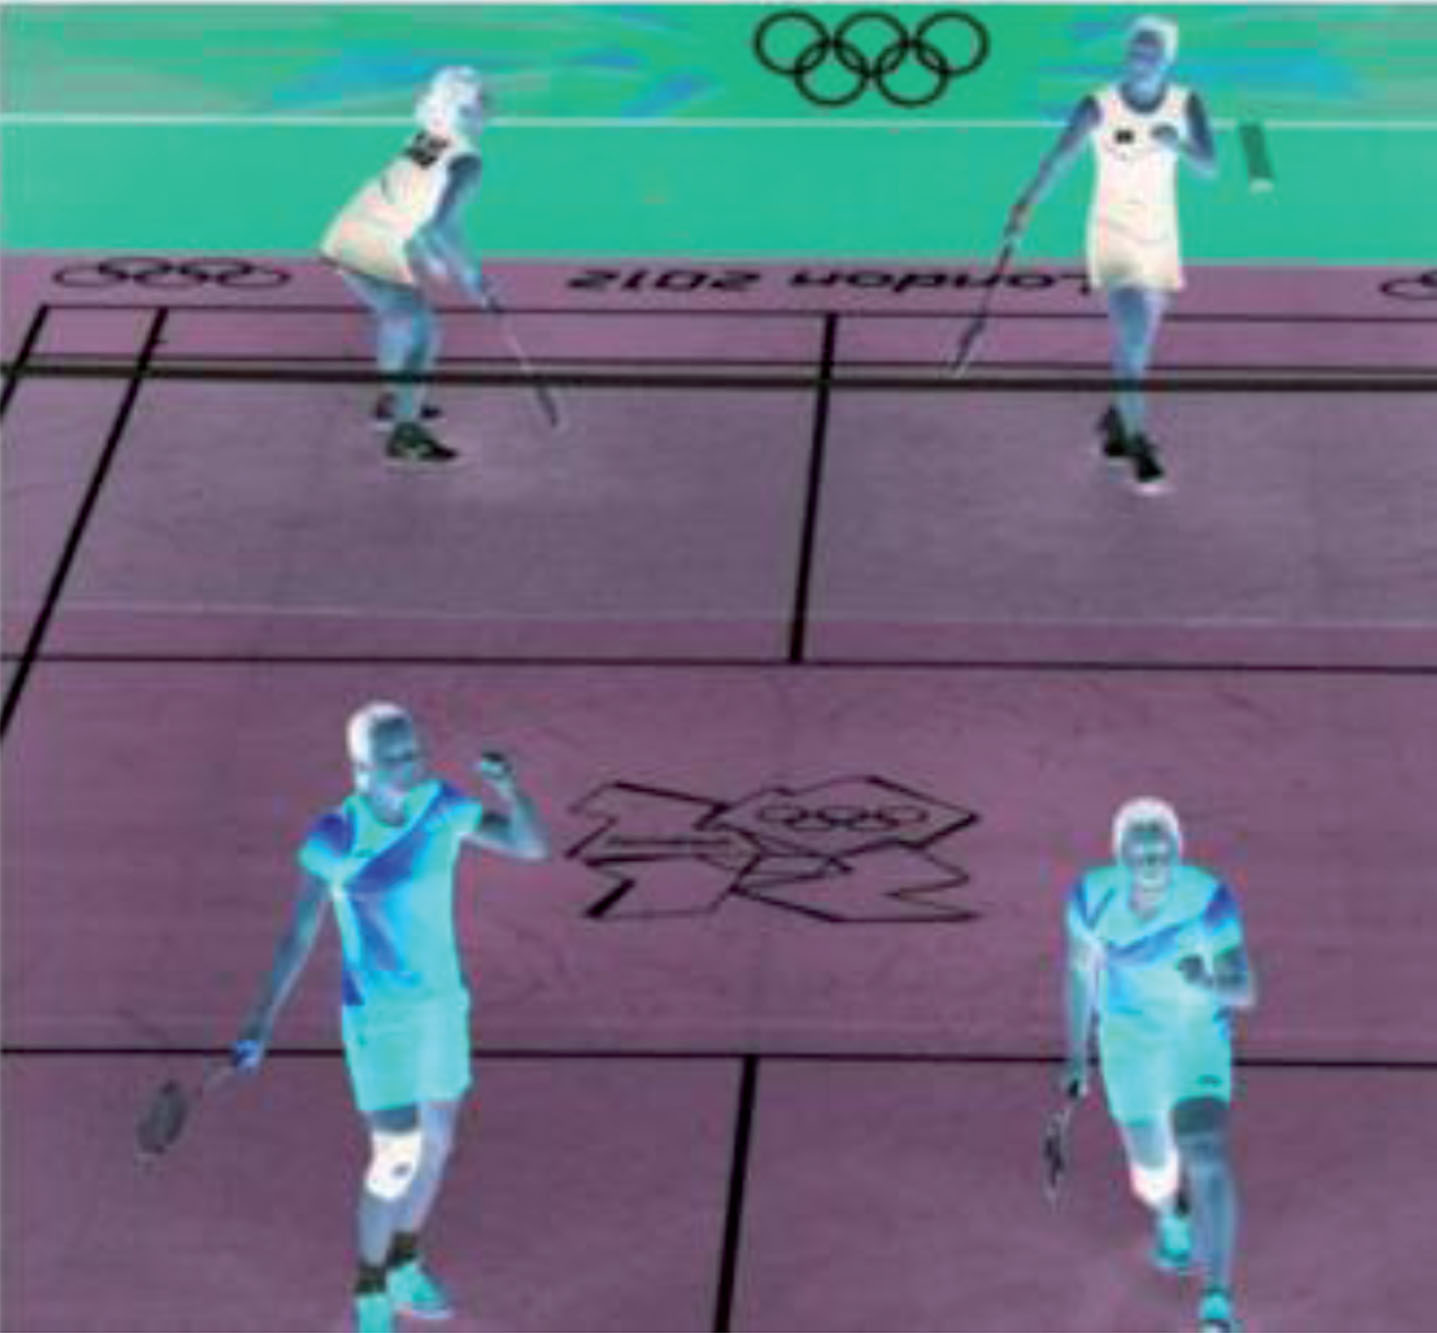
Among them, r, g, and b are the R, G, and B values of the image (x, y) pixels, respectively, and the range of values is [0 255].θ1, θ2, θ3 are variable parameters, which are set to 10, 5, and 8, respectively. The results of the stadium test are shown in Fig. 1 [24].
Feature extraction process.
The image is divided into 16 × 16 patches to construct a course area block diagram GB (i, j). In the i, j-th block in the vertical and horizontal directions, the pixel set B ij is defined as:
Then, the course area block diagram a is calculated by the formula (9).
Among them, 0 ≤ i < M/ - 16, 0 ≤ j < N/ - 16, Mand N are the height and width of the image, respectively. It is determined by the threshold T Ground whether an image block is a course block, and this paper sets T Ground = 0.5. If the number of pixels in an image block, that is, the number of pixels of Ground (x, y) = 1, is greater than or equal to T Ground in the total number of pixels of the image block, the image block is regarded as a field block. After the initial establishment of the course area block map, the course area block fill is performed, the purpose of which is to eliminate the area of the course block that is missed when constructing the course area block map. The area is filled according to formula (10) [25].
If there are one or two course blocks in the horizontal or vertical direction of an image block, then these blocks are considered to be the course area blocks, as shown in Figs. 1(c), (g), and (k). The method can clearly obtain the course area and avoids the misunderstanding of the stands in the image frame as the course.
(2) Rectangular division and calculation of the number of grass blocks
After the course area is filled, all the blocks are divided into a set of rectangular areas by the golden ratio 3 : 5 :3 along the image width direction. In the Golden-section part of the image, the number of blocks belonging to the course area in the j-th rectangular area is counted. Among them,
There are differences in the size of the characters in different shots of the football video. The most obvious difference is the size of the face area. Therefore, this paper determines the face area by human skin color pixel detection and connected domain analysis. The specific methods are as follows:
It has been found through experiments that the color value of a pixel in the CbCr plane of the YCbCr color space is considered to be the skin color if it is within the rectangular area represented by the formula (12).
The edge pixel ratio (ER) of a video frame is generally defined as the ratio of the edge pixels of the image to the total pixels. The calculation method is as follows:
(1) The video frame is converted from RGB to YCbCr color space; (2) The Canny edge detection operator is used to perform edge pixel detection on the Y component of the image; 3) The edge pixel ratio of the image ER is calculated according to the formula (13).
Among them, N edge is the number of edge pixels detected by the Canny edge detection operator on the Y component of the converted image after converting the image from RGB to the YCbCr color space.
In this paper, the texture information generated by the gray level co-occurrence matrix is used to extract the texture information of the image, and the following scalar is used to characterize the gray level co-occurrence matrix:
The energy is the sum of the squares of the values of the gray level co-occurrence matrix, reflecting the uniformity of the gray distribution of the image and the thickness of the texture, and is calculated according to formula (14):
Contrast reflects image sharpness and texture groove depth. The deeper the texture groove, the greater the contrast and the clearer the visual effect. Conversely, the contrast is small, the groove is shallow, and the visual effect is blurred. It is calculated according to formula (15):
Entropy is a measure of the amount of image information that represents the degree of non-uniformity or complexity of the texture in the image. It is calculated according to formula (16):
Among them, M and N are the height and width of the image co-occurrence matrix, and P (x, y) is the value of the element at the co-occurrence matrix (x, y).
Among them, μ i , μ j and σ i , σ j are the mean and standard deviation of p i , p j , respectively, p i = ∑ y p (x, y) is the sum of the elements of each row in the matrix p, and p j = ∑ x p (x, y) is the sum of the elements of each column in the matrix p.
In this paper, we use the simplified approximation model to extract the three main motion parameters of camera motion.
The three parameters of the camera movement were sorted out, p1 = s, p3 = - sfα, p4 = sfβ. fα is the pan ratio, fβ is the tilt ratio, and s is the zoom ratio. we set q3 = - fα, q4=fβ, then Equation (18) is converted to formula (19):
Among them, S represents the scaling ratio, -q3 represents the translation ratio, and q4 represents the tilt ratio. S > 1 indicates a zooming motion, S < 1 indicates a zoom out motion, and S = 1 indicates no zoom motion; -q3 > 0 represents a right translational motion, -q3 < 0 represents a left translational motion, -q3 = 0 represents no translational motion; q4 > 0 represents a downward tilting motion, q4 < 0 represents an upward tilting motion, and q4 = 0 represents no tilting motion.
The three motion parameters extracted by the camera motion estimation method operated by the MPEG compression domain use only the motion vectors produced by MPEG encoding, and no other processing techniques are needed.
A Gop in an MPEG compressed video image set is a continuous set of pictures. Therefore, MPEG encoding divides pictures (frames) into three types: I, P, and B. I is an internally coded frame, P is a forward predicted frame, and B is a bidirectionally interpolated frame. Each Gop has a B frame between P frames, and only I frame or P frame can be used as reference frames for motion estimation and compensation, so camera motion parameters can be estimated using only P frames.
We assume that V ≜ (V x , V y ) T is the motion vector corresponding from one image point ω ≜ (V x , V y ) T to the next corresponding point ω′ ≜ (V x , V y ) T , and the coordinates are: V x = x - x′ . , V y = y - y′. In order to estimate the unknown conversion parameters from the previous reference frame to the current P frame, the position of each non-zero motion inter-coded macroblock and the best matching macroblock calculated from the MPEG motion vector is considered to be a feature pair between the P frame and the previous reference frame.
Specifically, we assume that the frame size is M × N and is divided into
Among them, (i0, j0) is the position of the image center pixel in the image. Matching this macroblock is the center of the macroblock in the previous reference frame, and its coordinates centered at the center of the image are calculated by Equation (21):
Among them, m
k
= (vartrianglej
k
, - vartrianglei)
T
. Therefore,
The calculation formula of camera parameter estimates is:
Among them, N is the number of inter-coded macroblocks with non-zero motion vectors.
In this paper, two schemes are proposed. One is the mean training method, which performs data layer fusion on the input of the model, that is, the observation sequence of the sample, and performs model training after taking the average of multiple sets of training data under the same model. The second is the frequency weighted training method, which linearly weights the frequency at which the sample observation sequence appears in the model. We assume that the sequence of M numbers can be represented as O(m),m ∈ [1, 2, . . . , M], and P m is the frequency at which the m-th observation sequence appears. The correction formula can be expressed as follows:
Statistical Table of Recognition Rates of Three Training Algorithms
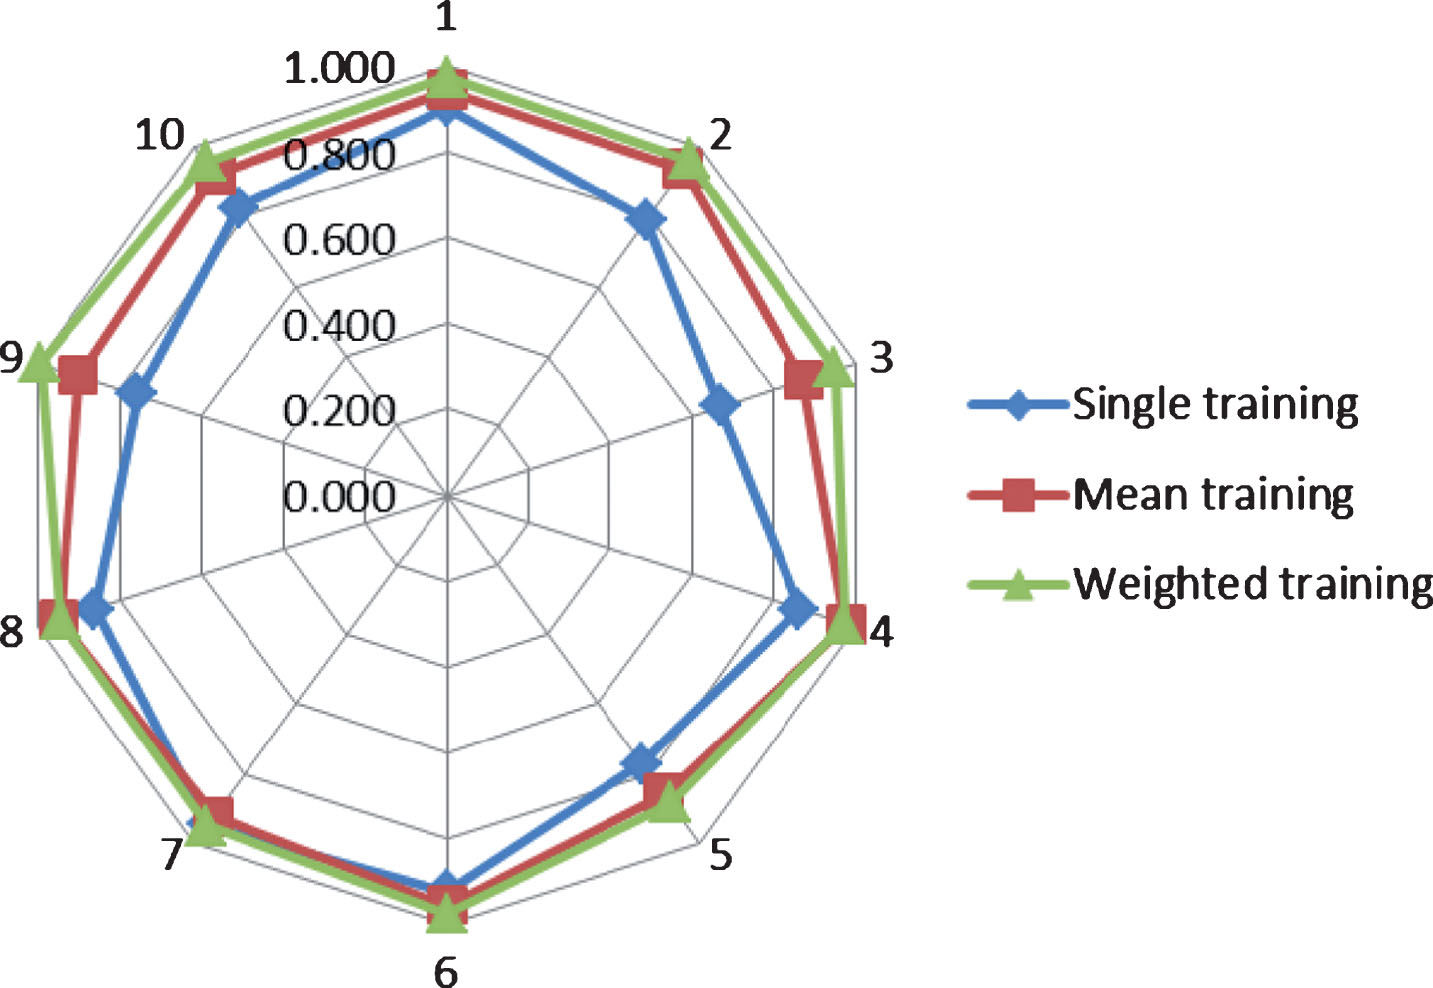
Statistical graph of the recognition rate of the three training algorithms.
From the data in Fig. 2 and Table 1, it can be seen that the frequency-weighted training algorithm can effectively improve the recognition rate of the model. Therefore, the training algorithm is used to train the sample. The sample data of the training is 100 hitting data of ten kinds of teeing actions, and the corresponding model is obtained by the improved training algorithm. For any hitting action to be identified, the observation sequence of the hitting action is obtained by the data preprocessing algorithm, and the conditional probability of the optimal state sequence appearing in the ten kinds of hitting action models is calculated by the Viterbi algorithm. After that, the model corresponding to the maximum conditional probability is found, and the corresponding ball striking motion of the model is taken as the recognition result.
The running acceleration signal is measured by the window segmentation technique based on the single running event, and the running signal is used to measure the running distance. It should be noted that the coordinate system established on the badminton court is constant, and the direction of the X and Y axes in the coordinate system of the sensor itself changes dynamically with the movement of the pace. Since the X, Y axis related motion data collected by the sensor is relative to the coordinate system of the sensor itself, it is necessary to decompose the offset angle and the displacement amount of the coordinate system of the sensor itself into the X and Y axis directions of the site coordinate system in each time interval a, thereby obtaining the actual coordinate information and the deflection angle of the sensor position relative to the site coordinates in the time interval. The accumulation of the coordinate information of the X and Y axes in the field coordinate system at each time interval is the final step displacement coordinate information. The specific formula of the algorithm is as follows:
It can be obtained by fitting the acceleration and angular velocity signals collected by the sensor. Δt i is defined as a short time interval. During this time interval, it is determined that the sensor coordinate system is not deflected, that is, the direction of the axis coordinate system of X′ and Y′ remains unchanged. Sx′ (Δt i ) is the displacement of the X′ axis in the time interval Δt, θ (Δti+1) is the deflection angle of the coordinate system X′OY′ relative to XOY in the time interval Δti+1, and S x (Δti+1) and S y (Δti+1) are the displacements of the X-axis and the Y-axis in the XOY coordinate system during the Δti+1 time interval. t0 indicates the end of a pace, S x (t0), S y (t0) represents the final displacement of a step in the coordinate system, which is the final step displacement coordinate information.
The initial probability, transition probability and observation probability of HMM contain important information to measure the size of the model, including the size of the observation set and the number of states, and the input of the model, that is, the length of the observed sequence, is also the decisive factor for the accuracy of the model identification. In this paper, the HMM is established and trained by dynamically adjusting the three important parameters of observation set size, state number and observation sequence length, and the average recognition rate under the corresponding parameter model is obtained.
When the observation set size is 32, the length of the observation sequence and the number of states are adjusted to obtain a three-dimensional variation map corresponding to the recognition rate. By comprehensively comparing and adjusting the three important parameters of HMM, it is concluded that the system identification rate is the highest when the number of states is 9, the length of the observation sequence is 10, and the size of the observation set is 32, which is up to 94%.
According to the data segmentation technique of the batting action extracted in the data preprocessing algorithm, three different segmentation methods are compared, and a preprocessing algorithm with higher recognition rate is selected.
Algorithm 1: Sliding window segmentation based on the moment of hitting. For each hitting point of the shot, the peak detection of the hitting moment is performed, and each of the fifty sample points before and after the hitting moment is used as the hitting action feature.
Algorithm 2: Sliding window segmentation based on maxima. The sliding window with a window width of 100 is used for maximal detection and resetting, and each maxima is generated corresponding to the extraction of a batting action.
Algorithm 3: Event-based window segmentation. By detecting two events of the athlete’s starting and hitting, the window is divided as the starting and ending time. The results obtained are shown in Fig. 3.
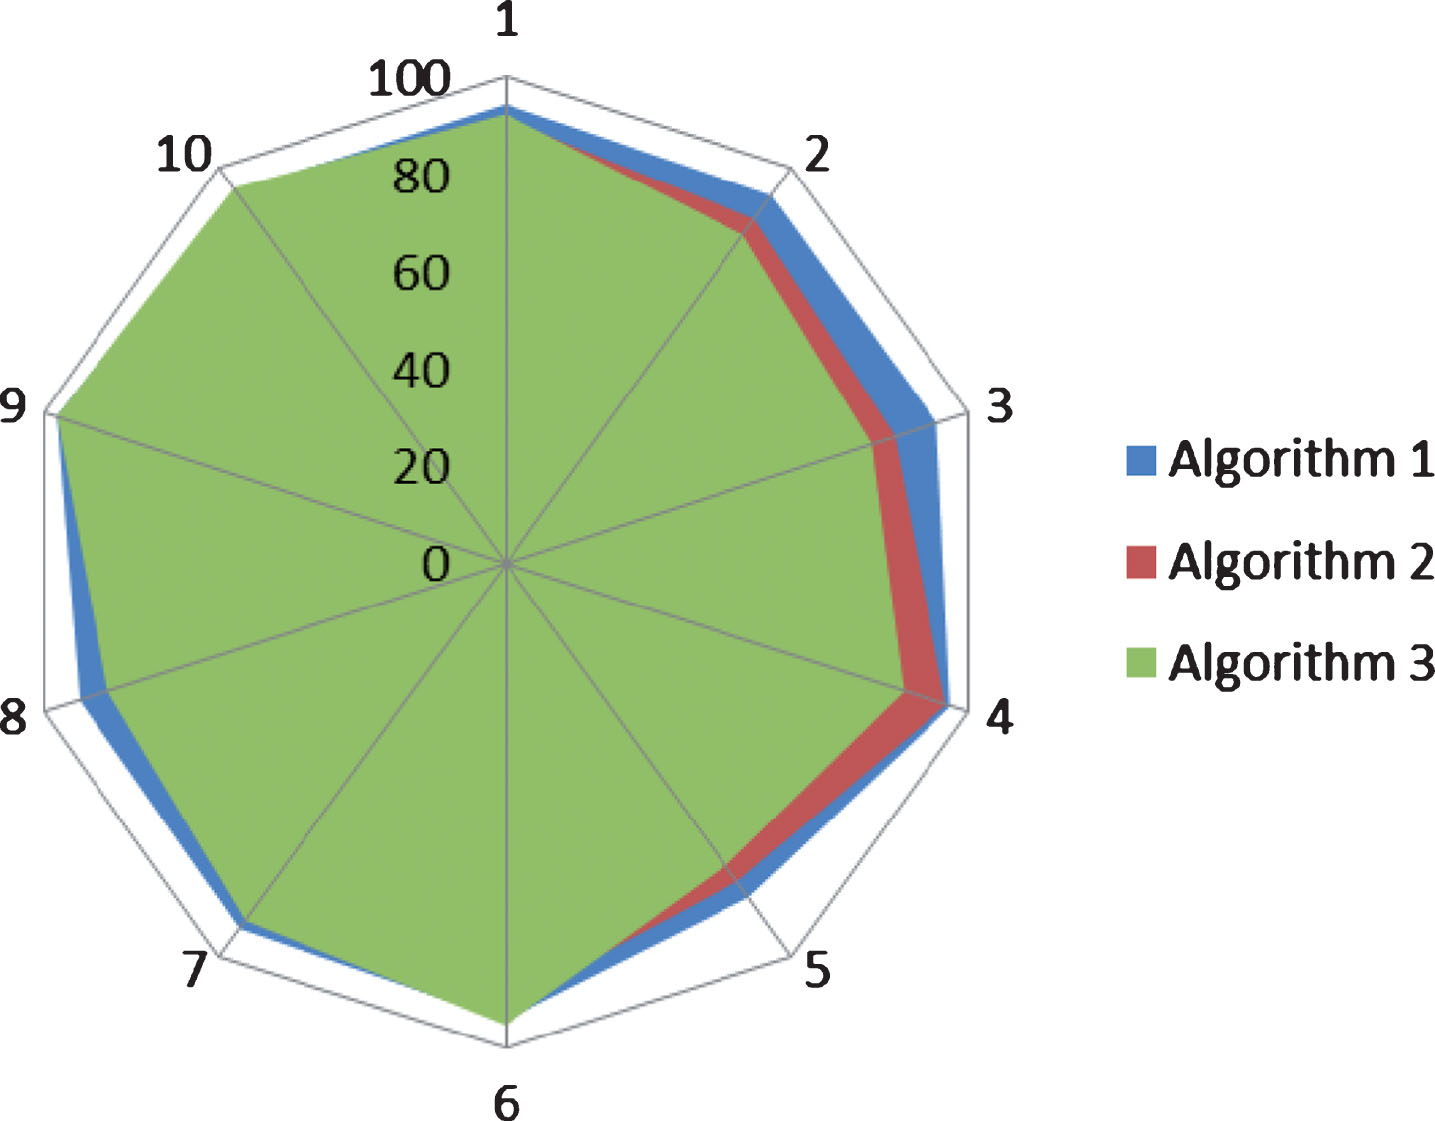
HMM motion recognition rate of different preprocessing algorithms.
The three different area colors represent the above three different methods of extracting the batting action, and the blue part of the figure represents the algorithm 1. It is not difficult to see from the figure that Algorithm 1 has included Algorithm 2 and Algorithm 3 in it, indicating that Algorithm 1 has a slightly higher hitting motion recognition rate.
Through the above analysis, it can be seen that Algorithm 1 has a higher recognition rate than Algorithm 2 and Algorithm 3. Therefore, the algorithm 1 is used to extract the batting action, that is, the hitting point of each hitting ball is detected, and the 50 sample points before and after the hitting moment are used as the hitting action features.
Comparing different algorithm training and recognition models, the model algorithm with higher recognition rate is selected as the method. Model 1: SVM-based training and recognition. Ten kinds of hitting actions are identified by the algorithm model of the support vector machine. Model 2: Training and identification of traditional HMM. Model training is performed by the traditional Baum-Welch algorithm, and the posterior probability of each batting action model is calculated and compared and identified. Model 3: Training and identification of improved HMM. Model training is performed by the improved Baum-Welch algorithm, and the posterior probabilities of each batting action model are calculated and compared and identified.
Experimental method: The single variable principle is adopted, that is, the above three different algorithm models are used to train and identify ten kinds of batting actions, the training data and the sample data are unchanged, and the other data processing methods remain unchanged. As shown in Fig. 4, three different strip colors represent the above three different algorithm models, and the coverage area in the radar map indicates the accuracy of the motion recognition rate. As can be seen from the figure, model 3 has completely covered the model 1 area, only a small part of the model 2 area is not covered, and most departments are included in the model 3. Therefore, it can be seen that the third method has a slightly higher hitting motion recognition rate.
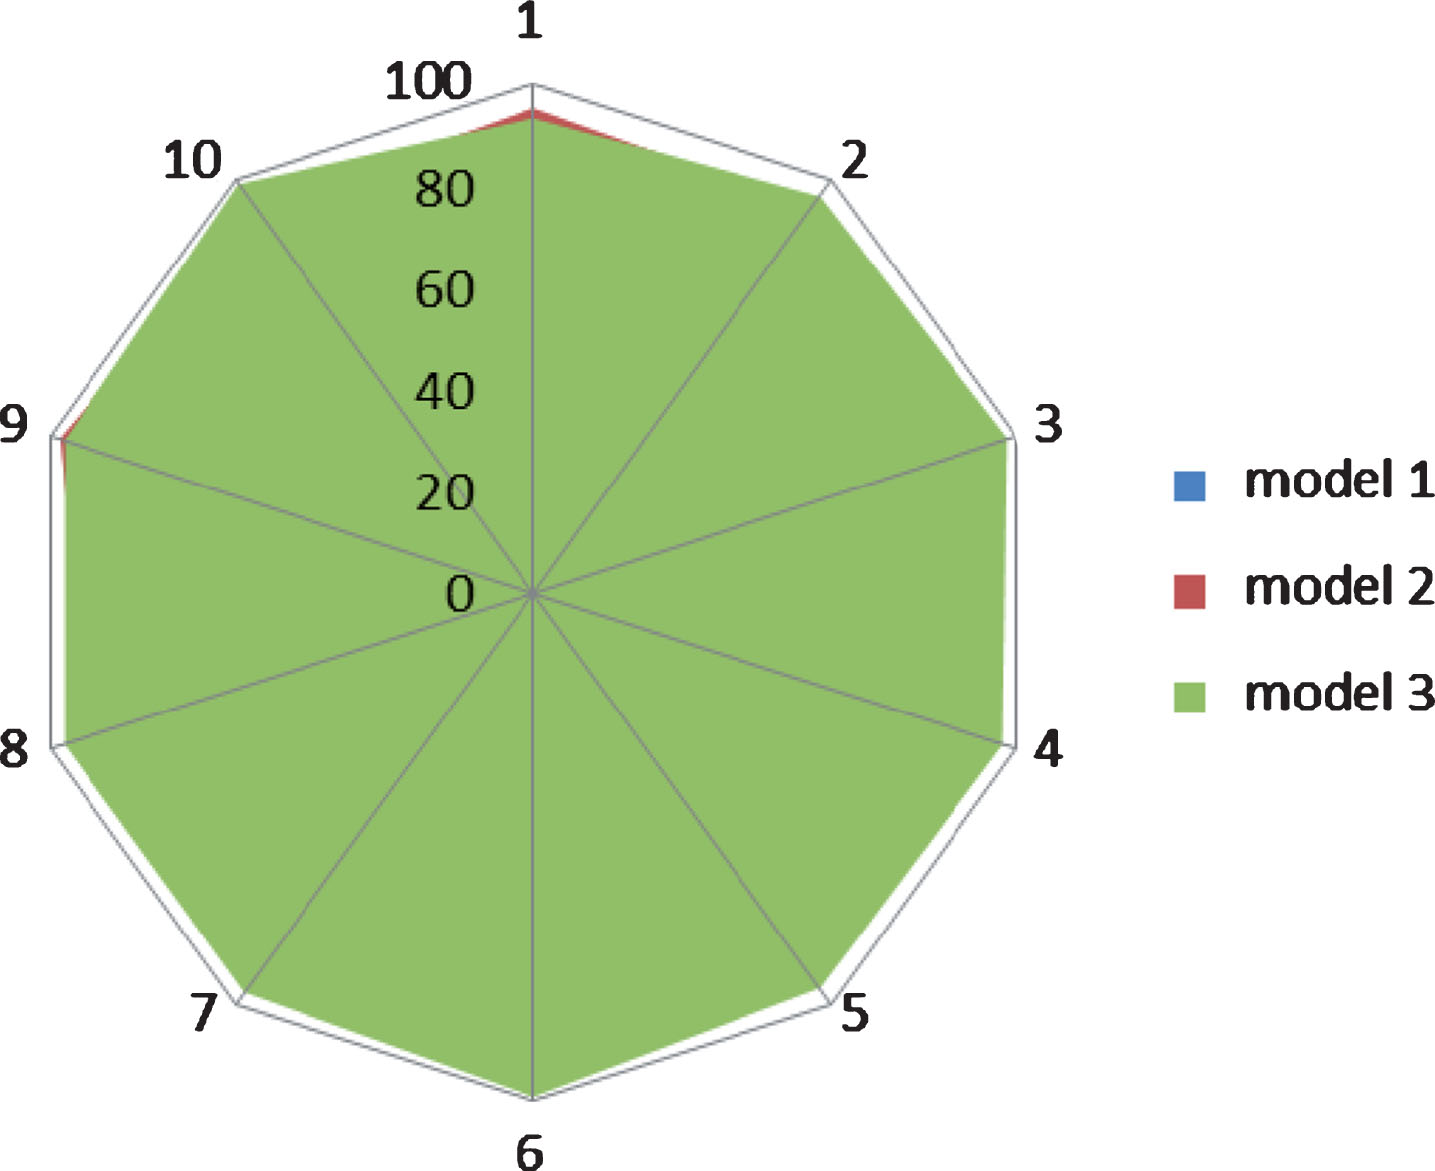
Action recognition rate of different model algorithms.
Experimental conclusion: Model 1 has a higher recognition rate than Model 2 and Model 3. Therefore, in this paper, method 3 is used to establish, train and identify the batting action model. That is to say, the improved HMM is used to identify ten different badminton batting actions, and the average recognition rate based on the same athlete can reach 97%.
Explore the impact of the same athletes and different athletes on the recognition rate of the system. Method 1: The same athlete, that is, the training data and test data are all from the same athlete. Method 2: Different athletes, that is, training data and test data are composed of a mixture of different types of athletes. That is, using the above two different sample data sources, the system recognition rate is tested by using the badminton batting action recognition algorithm. Experimental results: As shown in Fig. 5, two different colors represent the above two different data sources, and the different color coverage areas in the radar chart represent the motion recognition rate.
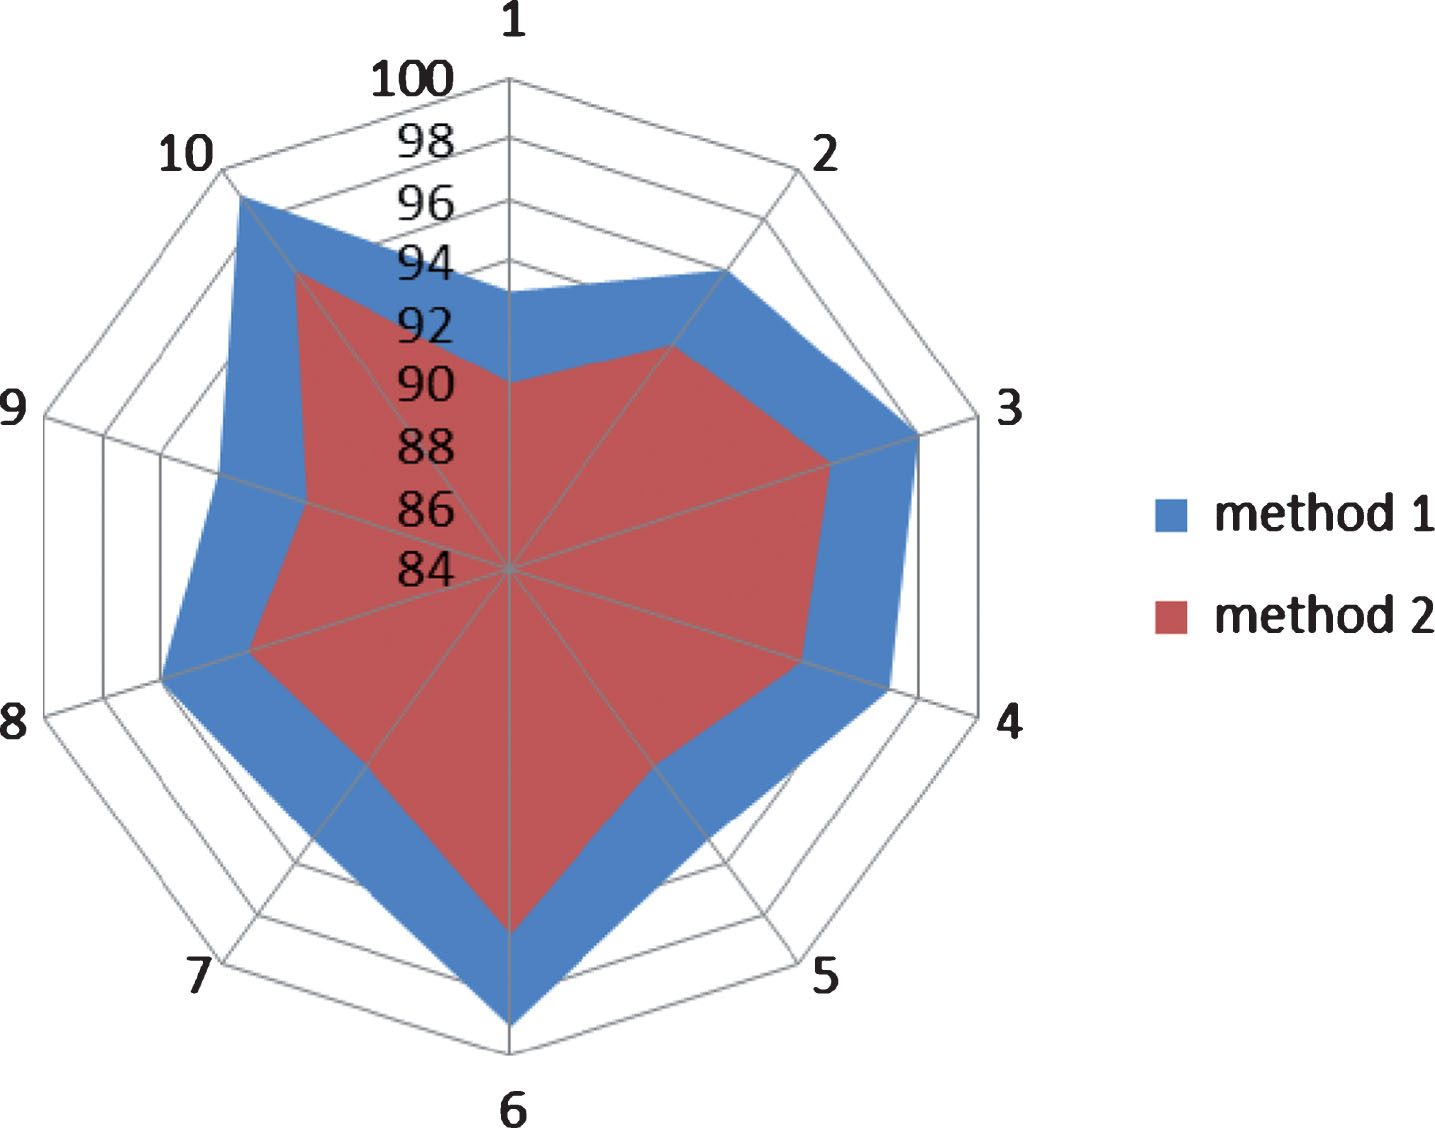
The same and different athletes’ motion recognition rate.
The conclusion of the experiment: the average recognition rate of the system based on the same athlete can reach 97%, and the average recognition rate based on different athletes can reach 94%. That is to say, mixing the data of different athletes for training and recognition will have a certain impact on the system recognition rate, which will reduce the average recognition rate of the system by about 3%.
Functional testing of badminton technical statistics and pace training systems. The test details are shown in Table 2 below. The statistical chart is drawn as shown in Fig. 6.
Score table of functional test
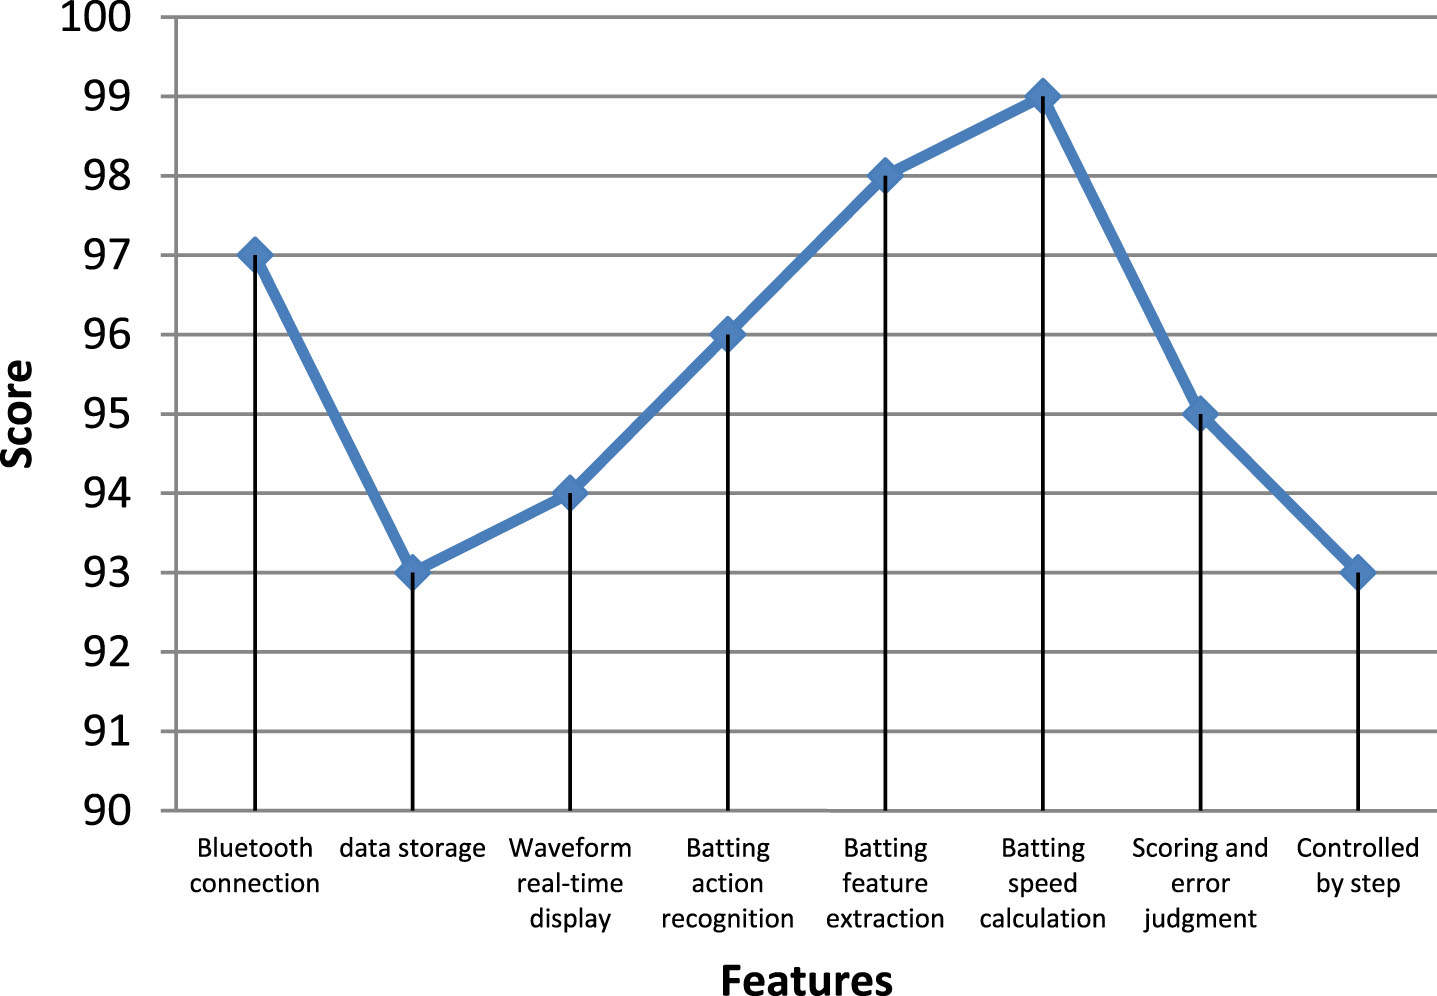
Statistical diagram of the functional test.
It can be seen from Table 2 and Fig. 6 that the functional tests of this study are all above 93 points, and the functional performance is excellent. Therefore, the system can meet the practical requirements, and it can be applied to practice by debugging and optimizing.
The badminton application system constructed in this paper focuses on solving the hardware and software engineering problems from data acquisition to algorithm programming and provides a functional platform for intelligent analysis and auxiliary training of badminton sports. However, in order to obtain good training results, more professional athletes and coaches are needed to participate, so that a large amount of data is accumulated, and technical parameters that are more in line with the laws of the badminton are extracted. At the same time, we can use the current popular big data and cloud computing related technologies to build a cloud platform for big data analysis, data mining and data analysis of a large number of player competitions and training data and analyze the technical advantages and shortcomings of various athletes, so as to improve the technical level of athletes faster.
In the aspect of digital player technical feature statistics and pace training, aiming at the one-on-one or one-to-many traditional training methods of badminton professional coaches and athletes, this paper proposes a method and training program based on machine learning algorithm for digital quantitative analysis of athletes’ technical quality level. For the two important technical components of badminton, namely the badminton’s batting action and the pace of being controlled, this paper uses the digital indicators to generate statistical reports on athletes’ technical statistics, analyzes and compares the level of athletes with different technical levels, compares the technical characteristics of various batting actions and controlled steps, and conducts effective guidance and targeted training. These measures make up for the shortcomings of traditional coaching methods such as insufficient coach resources, uneven coaching levels, and inefficient training methods, and apply the advantages of digital intelligence and rapid learning of artificial intelligence to badminton.
Another application of the badminton batting action recognition algorithm based on this paper is to combine a virtual reality and augmented reality technology to study a badminton intelligent game or intelligent training system. Through inertial sensors, data gloves, virtual helmets, smart cameras and locators, it realizes a human-computer interaction badminton game, allowing users to experience the live and fun of badminton games more realistically. At the same time, by combining this paper and improving the intelligent training algorithm of this paper, the effect of technology improvement and sports fun merger is achieved.
Conclusion
This study explores the classification and recognition techniques of badminton batting. When analyzing the visual features of the extracted video, a frame near the middle of the lens is extracted as a key frame, and the visual features of the key frame are extracted, according to the visual features of the key frame and other modal features of the lens. In this paper, the texture information of the image is extracted by the statistical information generated by the gray level co-occurrence matrix, and the three motion parameters are extracted by the camera motion estimation method operating in the MPEG compression domain. It only uses the motion vectors produced by MPEG encoding and does not require other processing techniques. At the same time, this paper proposes two options. The first is the mean training method: data layer fusion is performed on the input of the model, that is, the observation sequence of the sample, and the model training is performed after taking the average value of the plurality of training data in the same model. The second is the frequency-weighted training method, which linearly weights the frequency at which the sample observation sequence appears in the model. In addition, the running acceleration signal is measured by the window segmentation technique based on the single running event, and the running signal is used to measure the running distance. Through experimental research, we can see that the functional test functions of this study are excellent, so the system can meet the practical needs, and it can be applied to practice by debugging and optimizing.