



Abstract
The usefulness and ease of use of Big5 dashboard have been proposed to explore hierarchical structure of personality traits. First, Big5 system architecture and its components are described. Afterwards, we present how to calculate Big5 indicators from available big mobile data sets. Hereafter, Big5 traits can be predicted based on those just-specified indicators. To proof of our concepts, implementation results will be presented in the context of the Big5 dashboard which has been designed and developed to predict Big5 personalities in a representative and interactive manner.
Keywords
Introduction
Hierarchical structure of personality traits, i.e. extraversion, agreeableness, conscientiousness, neuroticism, and openness to experience is known as the five-factor model (Big5) [12, 25]. According to [25], these Big5 personality traits have been utilized to recognise connecting among personality and different behaviors. Those factors are very important for business people to understand their clients. Especially in the field of mobile data, the number of users will pass the five billion in 2019 [27] and mobile phone logs have been made by service providers available to researchers [3] as well as to commercial partners [21]. As a result, personality indicators specified from big mobile logs open the door to exciting roads for next generation of social sciences [6].
Furthermore, [7] showed that data can be collected from the onboard sensors and other phone logs. In [3], determining personality of a cell phone client through standard mobile logs has turned into a point of enormous interest. Those mobile log data could therefore give a profitable subtle and cost-effective choice to study based measures ofpersonality [3].
According to [11], dashboards are basic components in supporting interactive queries in data warehousing systems, as they provide analysts the perspective on basic business measurements that reflect the business execution conditions between and within data sources.
In this context, the Big5 dashboard has been proposed and developed based on three data sets of mobile phone logs collected from Orange Senegal [4]. First, those big mobile data sets are extracted, transformed and loaded into the Big5 data warehouse’s fact tables, then aggregated into multi dimensional data cubes, the concepts of which have been introduced in our previous literatures [7, 15]. Afterward, a set of Big5 indicators has been retrieved and calculated from those multidimensional data cubes. Furthermore, we also reuse an available set of indicators calculated and provided by the Bandicoot tool [3]. In this context, machine learning algorithms, especially, Naive Bayes classification [23, 25] are studied and applied on the just-specified set of indicators to predict if phone users were low, average, or high in Big5 factors [21]. To proof of our concepts, Big5 dashboard use cases have been designed in UML (Unified Modeling Language) and developed to enables user(s) to explore the hierarchical structure of personality traits in an interactive manner.
The rest of this paper is presented as follows: Section 2 introduces typical approaches and projects related to our work; after introducing the Big5 system architecture and its concepts, i.e. Big5 indicators, and Big5 predicted based on Naive Bayes classification in Section 3, Section 4 will present our application results in the context of Big5 dashboard. And lastly, Section 5 gives a summary of our achieved as well as future works.
Related work
The features of our approach can be established in the research field of predicting personality traits based on on machine learning algorithms. Moreover, predicting the personality of cell phone clients, besides being imperative exclusively from the mental perspective, can likewise give an important framework for mobile computing [28]. Especially, business people can retrieve information and knowledge from mobile phone data sets, which become very big and contain many features [2].
Personality is an essential factor in deciding individual variation in thoughts, emotions and behavior patterns [23]. In [9], personality can be predicted by abusing different features extracted from Facebook data, e.g., age, gender; statistical data for user’s activities, e.g., number of likes; linguistic features, e.g., word count, etc. Furthermore, [10] used n-grams as features and Naive Bayes algorithm as classification algorithm to determine author’s personality from weblog texts. Moreover, [22] anticipated uprightness by estimating the particularity and objectivity of the verbs taken from WordNet and Senti-WordNet. In [1], personality is specified by different classification approaches, for example Support Vector Machine, Bayesian Logistic Regression. Moreover, On another hand, the ability to draw relationship between behavioral aspects rectrieved from relevant information integrated from cell phones, just as personality, could prompt modeling and applying AI machine learning techniques to predict user’s personality traits [2, 5].
In [2, 3], we have been focusing on main key features: developing a data management system [9, 16–19] to handle mobile logs, which can be seen as a big amount of data; calculating new Big5 indicators, which could be retrieved from the data management system; then deploying a tool to predict Big5 personalities. This paper can be considered as an extended version of our previous work in [16]
Big5 system architecture
In this section, the Big5 system architecture and its components are presented as illustrate in Fig. 1.
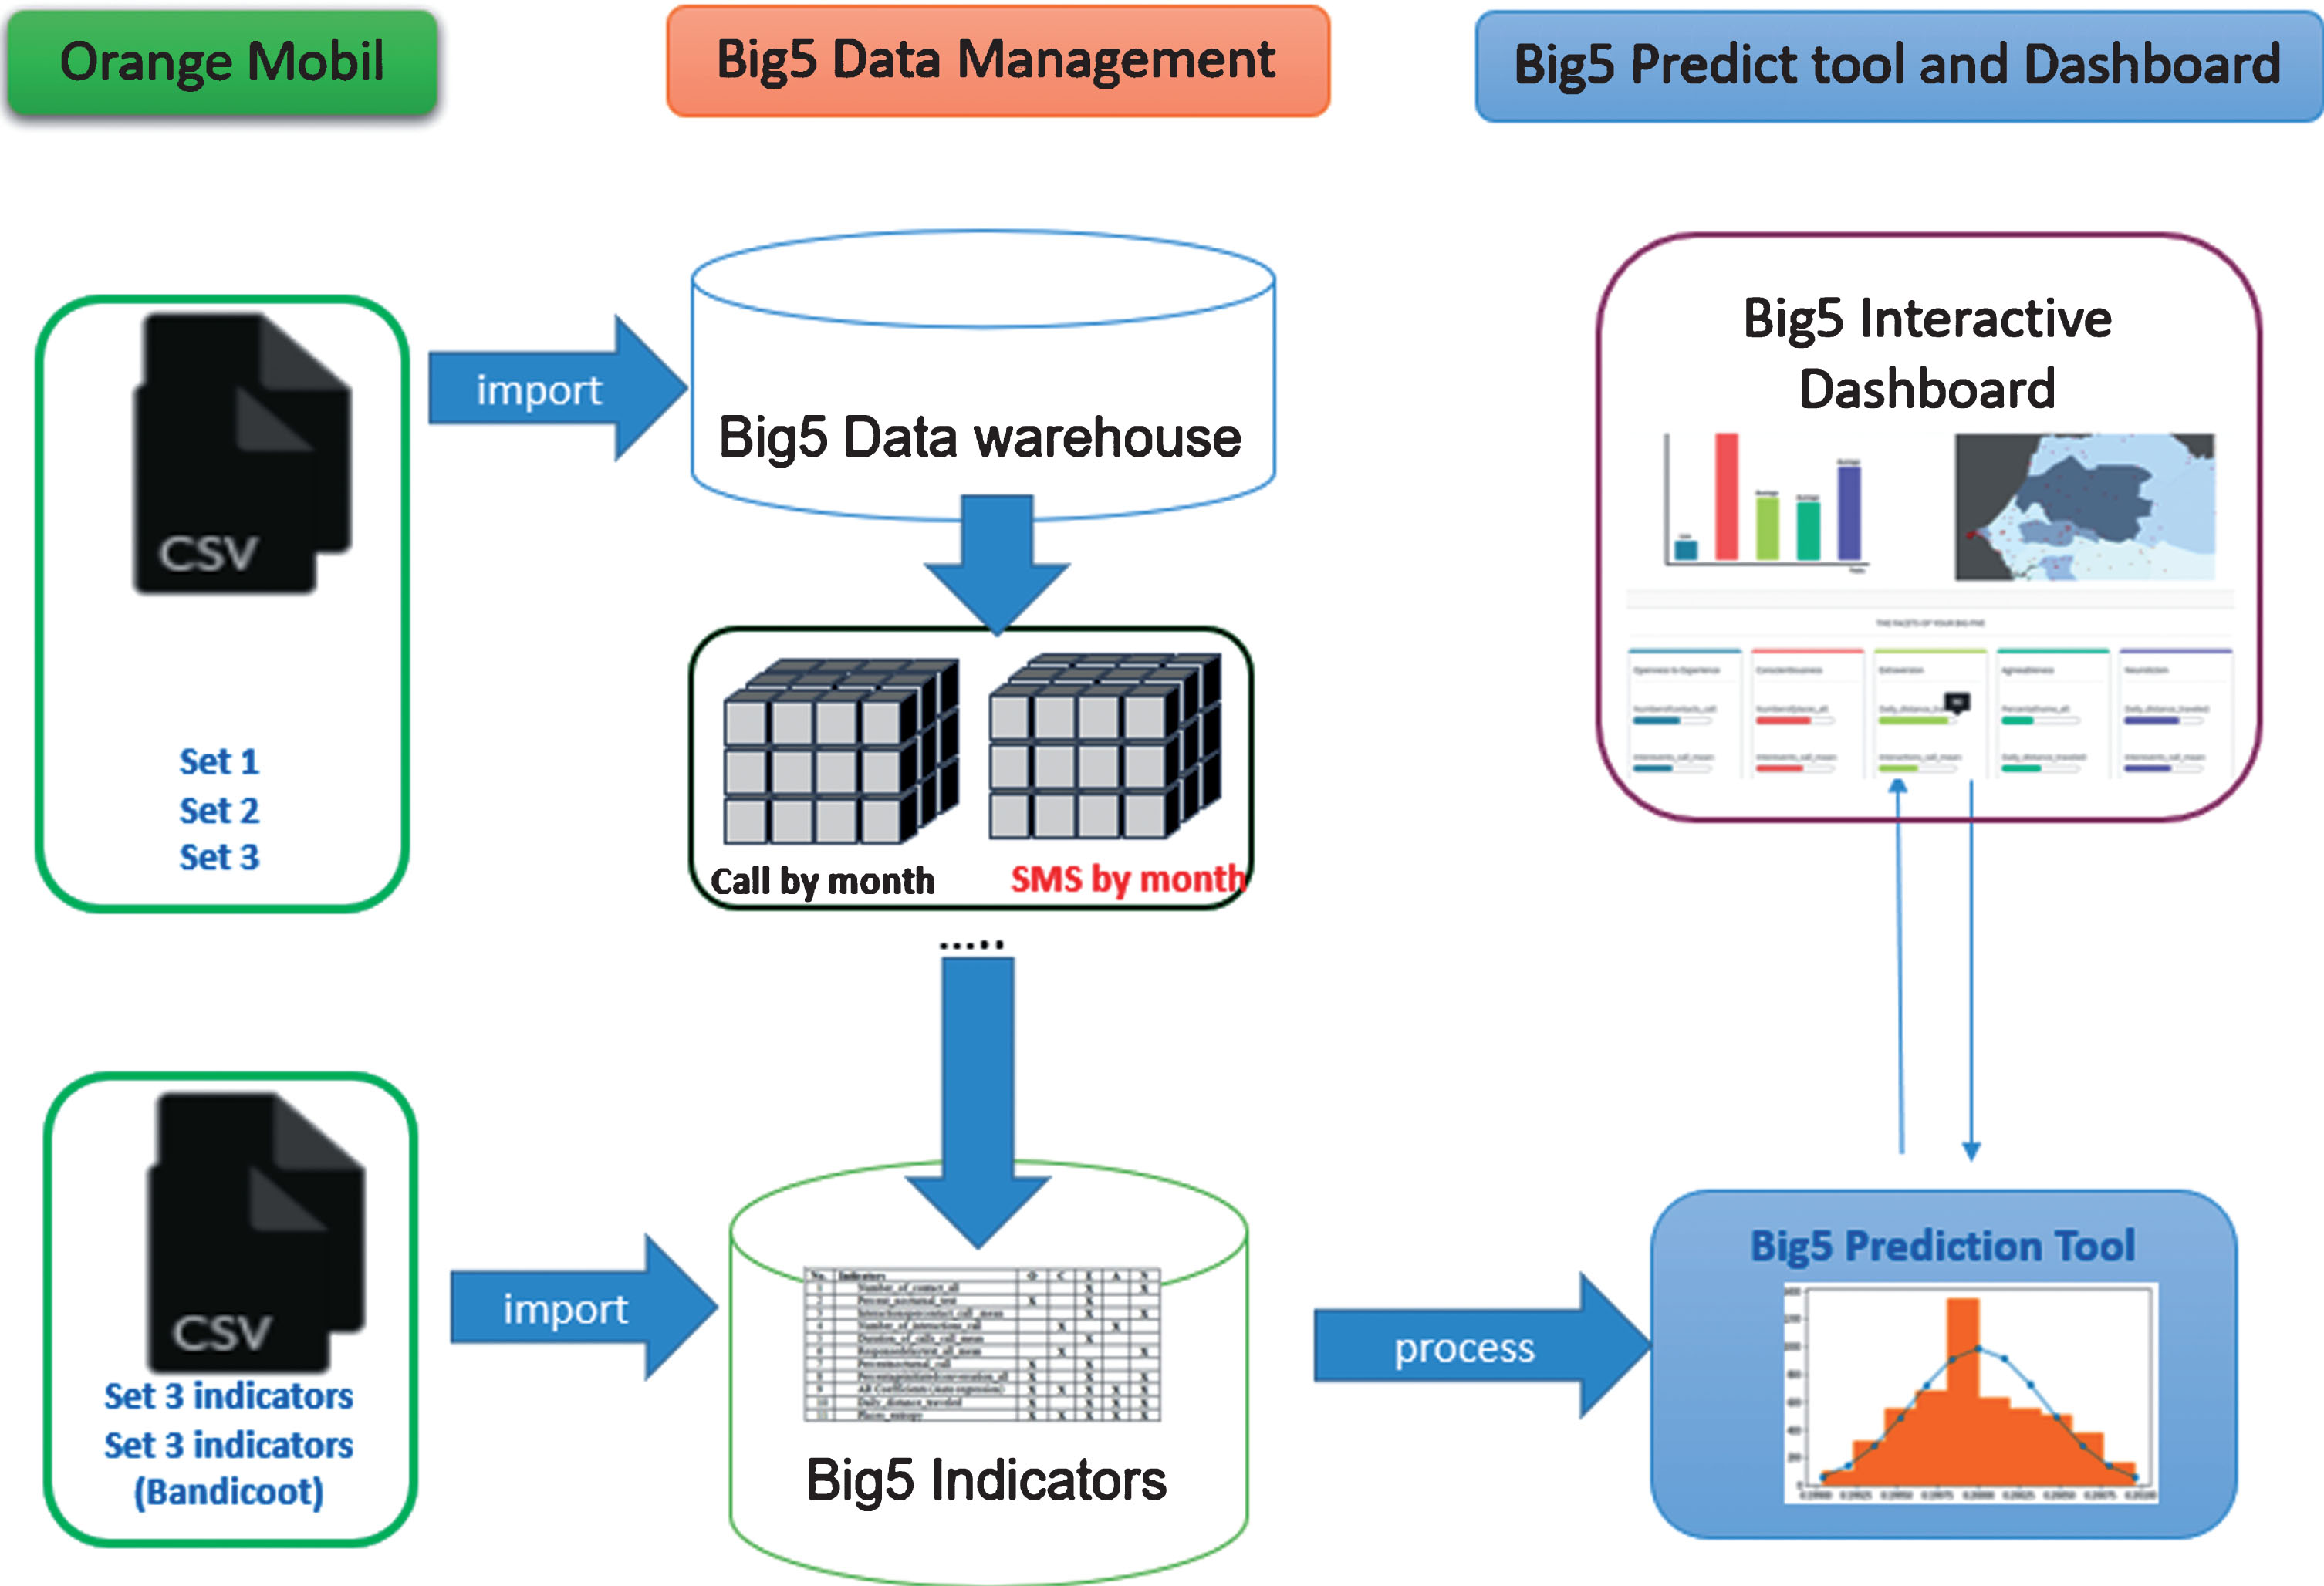
Big5 system architecture.
First, three Orange Senegal big mobile phone data sets [3] have been preprocessed and integrated into the Big5 data warehouse. Afterwards, a set of indicators are retrieved from Big5 data cubes, and then have been used to predict Big5 traits as presented in sub-section 3.4. Furthermore the Big5 dashboard also provide an interactive framework which enables user(s) to customize Big5 indicators in term of dashboard slides.
In this section, mobile data sets gathered from the 1666 towers distributed across Senegal [3] have been preprocessed and used to specify Big5 indicators. The datasets include log information of calls and SMSs exchanged among 9 million mobile users during the year 2013. With regards to this big data challenge, those mobile log infromation have been appropriately anonymized before being handled to scientists [4]. An example of SMSs antenna to antenna mobile logs is presented as follows:
Big5 data warehouse definition
According to [16], the Big5 data warehouse has been defined:
Big5DW=< Big5Dims,Big5Facts,Big5FTs,Big5Gbys>
Where:
Big5Dims is a set of main dimensions, i.e. Site and Time.
Big5Facts is a set of decision variables, i.e. number_of_calls, total_call_duration, number_of_sms.
Big5FTs={FTCalls,FTSMSs} are fact tables, namely FTCalls, FTSMSs. Table 2 represents a subset of FTCalls.
Big5Gbys contains grouped data cubes specified by the hierarchical levels of Time and Site dimensions, e.g. CallbyNightTime, SMSbyMonth, SMSbyYear, etc.
An example of SMS antenna to antenna logs
An example of SMS antenna to antenna logs
A subset FTCall
In [16], Big5 classifiers have been defined:
Table 3 shows an example of specified Big5 indicators for towers from Orange data sets.
Example of specified Big5 indicators for towers from Orange data sets
Afterwards the linking between Big5 indicators and traits can be recognized as illustrated in Table 4.
The linking between calculated indicators and the Big5 traits
Based on a class variable cl ∈ CL and a Big5 indictor vector id (id1, …, id
n
) [16], Bayes’ theorem states the relationship as follows:
Applying the Naive independence assumption then:
P(cl) follows Uniform distribution [28], hence the probability is equal to each trait.
In our context, formula 4 is used to predict degree levels of personality dimensions. First, we dichotomize indicators into low (l) and high (h) degrees. More detail, a continuous variable id is converted to discrete variable id that has low and high values by using its median. Then, Multinomial Naive Bayes method [24] is used to calculate.
P (cl|id i , …, id n ) by using distribution of low or high in each personality’s dimension.
For examples, we have a vector of indicators of a user as follows:
After dichotomization, id = {h, l, h, h, l}, we then apply formular 4 to calculate degree of personality dimensions on user’s indicators.
Using the result, we determine degree levels of personality dimensions according to a set of degree values. Low or average or high degree of a trait are specified based on mean and standard deviation as follows:
A trait is low degree if its value less than a; average if the value is between a and b, or high degree if the value is greater than b.
Finally, we use sets of median, distributions of the two values and sets of a and b to predict degree level of personality dimensions.
In the user’s point of view, the Big5 dashboard has been proposed to empower user(s) to browse the hierarchical structure of personality traits anticipated by Big5 indicators. Therefore, the dashboard consists of set-up and interactive phases. In this context, a set of available calculated indicators for predicting Big5 traits has been used to form an interactive framework in the set-up phase by using Big5 dashboard widget. Afterwards, personalities can be tracked by mean of the Big5 interactive dashboard.
Big5 data visualization scenarios
The following paragraphs represent a typical scenario development used to analyse the sample mobile data provided by Orange [3]. As illustrated in firgure 2, the derived Big5 map is a data visualization scenario to identify the Big5 traits distribution in Senegal that are highly susceptible to business analysis and other shocks.
Emphasis was placed on key indicators such as number of outgoing calls, duration of calls and entropy of calls, where entropy is a measure of the network variability of different towers contacted from a given tower. As a result, the Big5 map of the dashboard captures the definition of metrics and related context indicators and Big5 traits as presented in Table 4.
Big5 dashboard Set-up phase
In the dashboard set-up phase, the Big5 dashboard definition artifacts used in our approach are based on the specifying of Big5 indicators which are input parameters of predict functions for the dashboard data visualization scenarios.
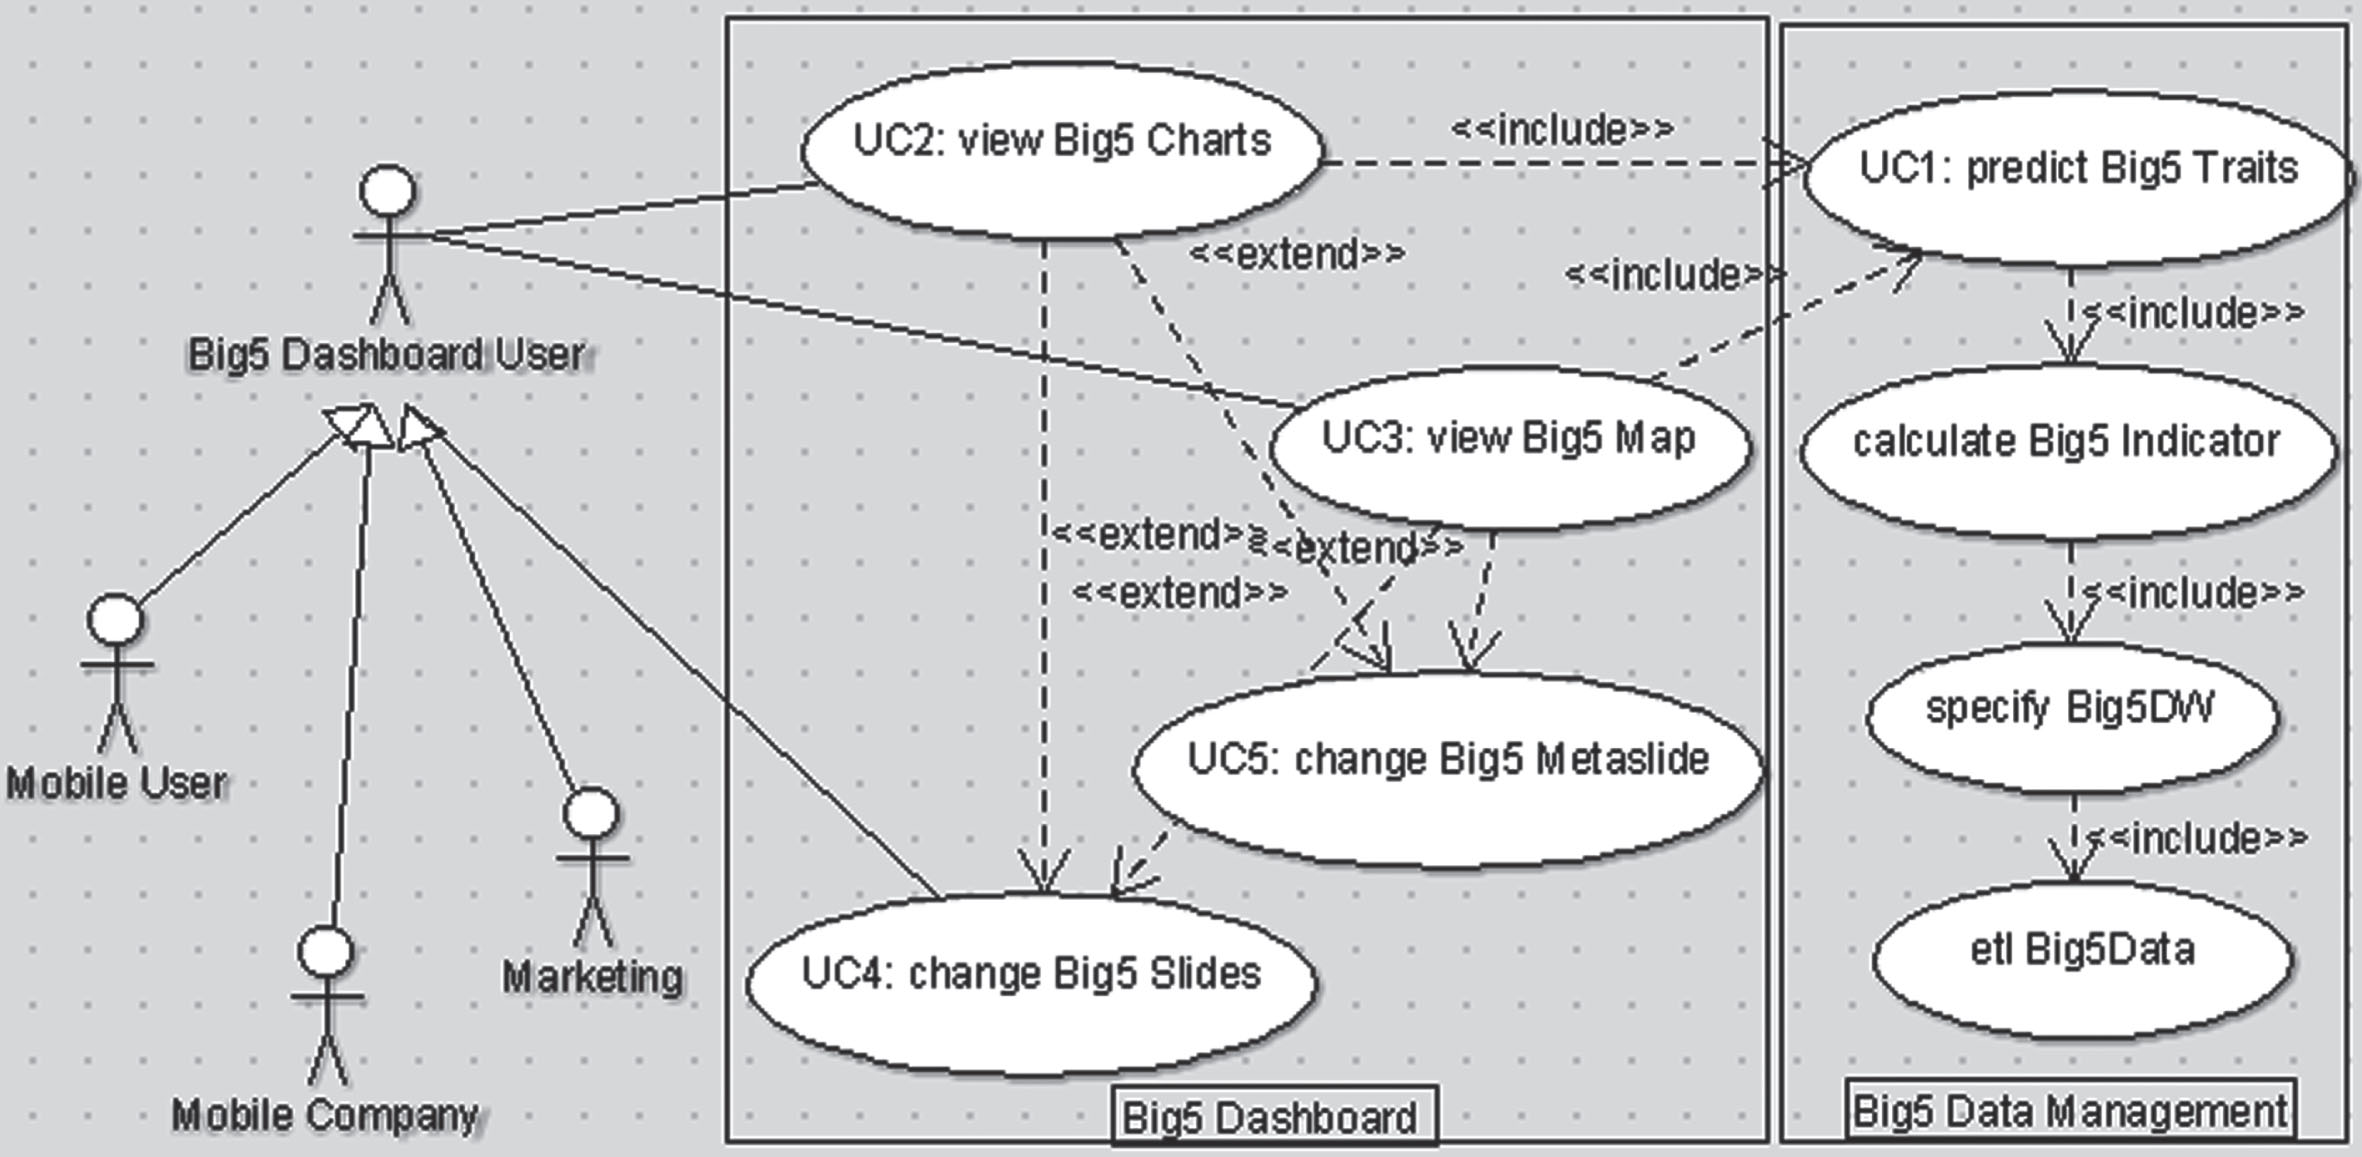
Big5 prediction map scenario.
In a typical Big5 data visualization scenario, dashboard user starts by defining some scenario objects, i.e. Big5 Charts, Big5 Map, and then associates these components with Big5 indicators widgets to build the interactive dashboard.
Asigning a value for a slide, we can bind a subset of its related indicators to set a data visualization scenario value based on the predict function defined in 3.4.
The Big5 dashboard design have to need to manage various types of interactions, including users setting a new value to the set of chosen values by changing slides. Along these lines, interaction semantics includes a predictable perspective on the Big5 indicators and enable the user to cross to different scenarios in a right and complete way.
Big5 dashboard Use cases
According to [16], Mobile user, Mobile Phone Provider, and Marketing Agents three main actors, which can be abstracted as Big Dashboard User.
As shown in Fig. 3, three basic use cases are UC1: predict Big5 Traits, UC2: view Big5 Charts, and UC3: view Big5 Map.
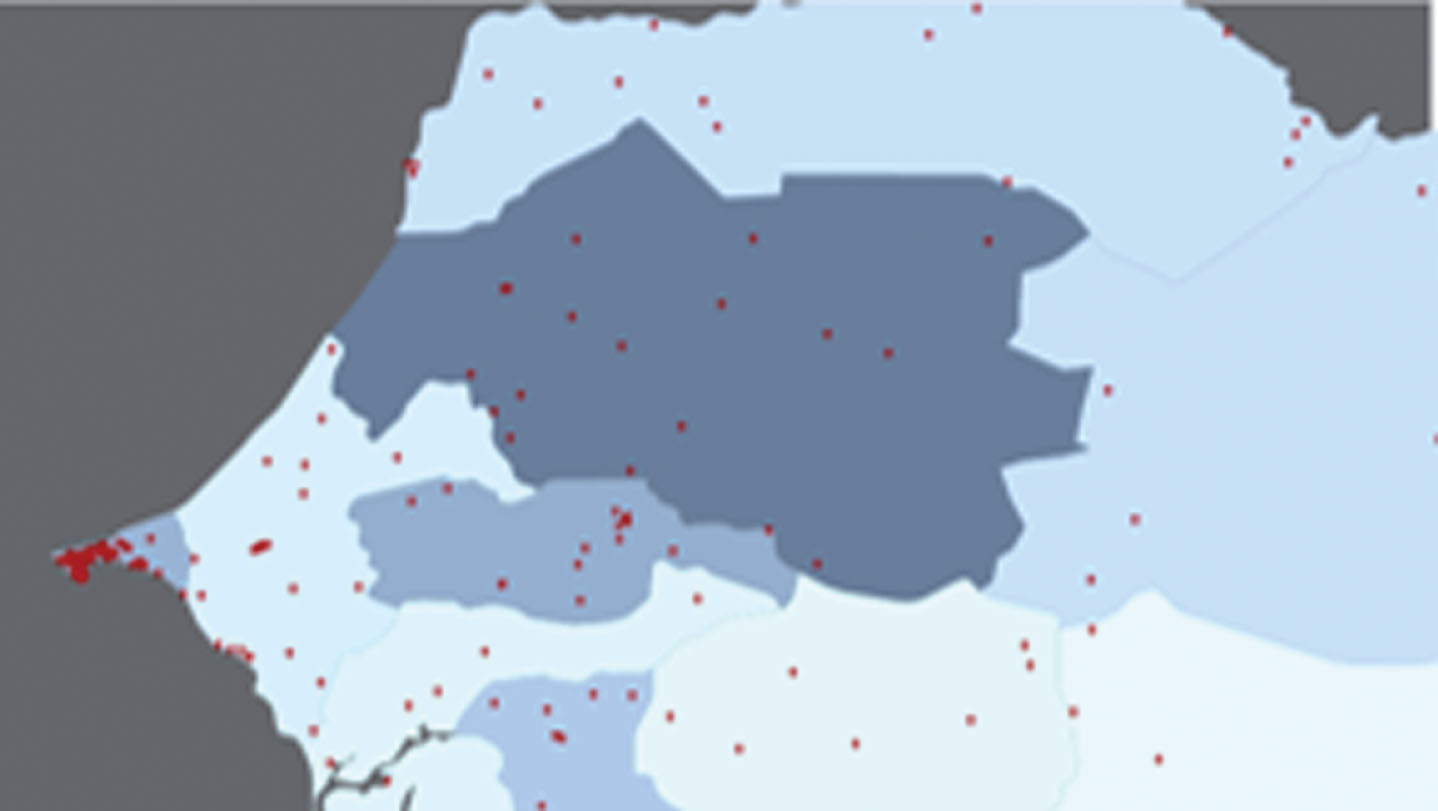
Big5 dashboard use case diagram.
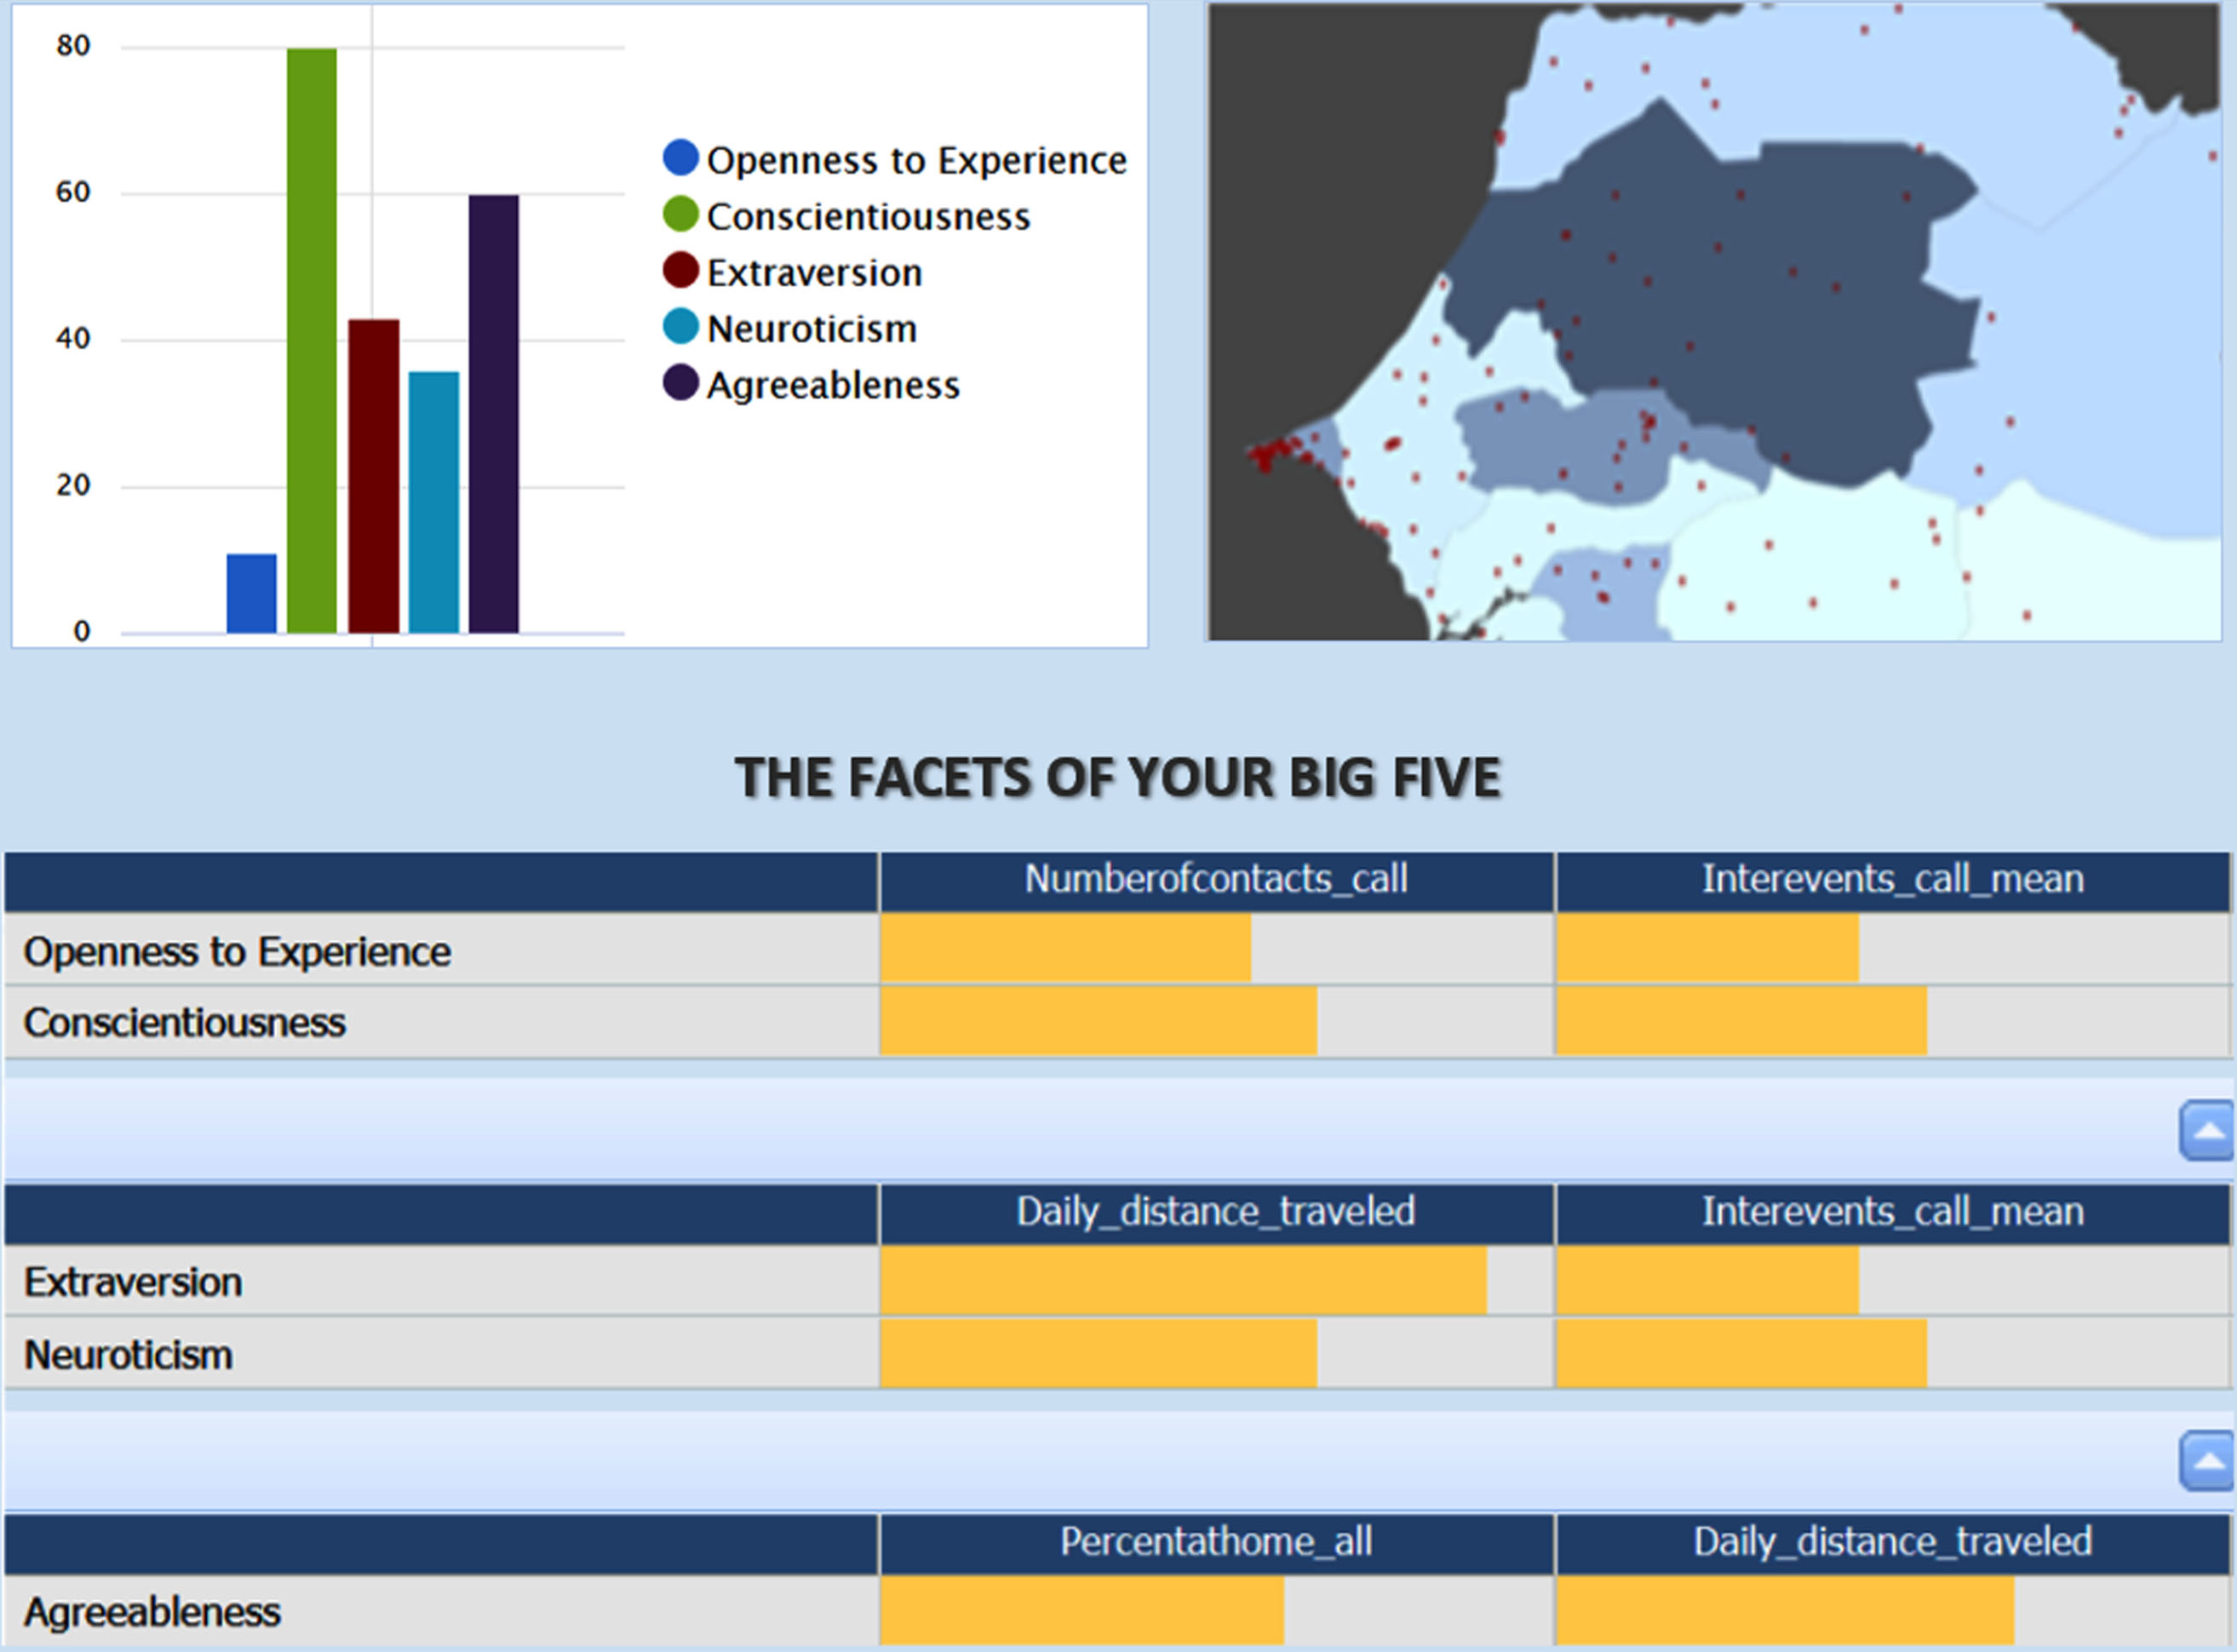
Big5 dashboard having UC2: view Big5 Chart,UC3: view Big5 Map and UC4: changing Big5 Slides or UC5: changing Big5.
In this context, a use case can be deployed by revoking other related ones. For example, the main use case is the UC1: predict Big5 Traits, which anticipates Big5 traits by the indicators specified by the calculate Big5 Indicator. Moreover, the calculate Big5 Indicator use case has been implemented based on data cube data obtained from the Big5DW data warehouse, which is defined by the specify Big5DW. However, the big Orange mobile log data has been extracted, transformed and loaded into the Big5DW data waerhouse by mean of the etl Big5Data use case.
As presented in sub-section 4.1, the typical data visualisation scenario, namely Big5 prediction map has been modelled and developed by using the UC3: view Big5 Map, which also calls the UC1: predict Big5 Traits. In this context, number of outgoing calls, duration of calls and entropy of calls indicators are calculated by user_ids and arrondissement_ids.
Furthermore, Big5 Dashboard user(s) can have opporturnities to target implementation rate of interevent by using UC4: changing Big5 Slides or BC5: changing Big5 Metaslide.
In this paper, we have presented the Big5 dashboard, which is proposed to explore hierarchical structure of personality traits in an interactive manner by mean of measure slides and their predict functions linked to a package of user-defined data visualization scenarios. In this context, a set of indicators and their associations to Big 5 traits have been retrieved and calculated based on the Orange Senegal mobile phone logs [3].
Future work of our approach could then be able to support users in building interactive dashboards in cost efficient and elastic manner that spans all aspects of smart dashboard widget building lifecycle, i.e. data visualization scenarios, indicator computation and their related measure slides.
Footnotes
Acknowledgments
Thanks to Orange Sonatel Senegal and the D4D team for providing the mobile phone data. Support from the Duy Tan University, Vietnam isacknowledged.