
Abstract
As a communication tool, social networks have become an important part of people’s daily lives. The proliferation of data in the big data era has spurred waves of research. Twitter is one of the most popular sites among all social network platforms. Twitter API allows researchers to easily study user behaviour and influence. In this paper, we use data obtained through the Twitter API to study the influence maximization problem based on the relationship graph of the social network and information dissemination model. In the current independent cascade propagation model, the influence weights between nodes are based largely on the fixed-value assumption and the randomized probability of acceptance; however, this does not conform to real life. The influence weight between users is closely related to the strength of relationships, content of communication, and so on. Focusing on user relation-ships, we introduce an improved weighted cascade mode combined with a heuristic algorithm to find an approximate solution to the problem of influence maximization. Example analysis indicates that the improved weighted cascade model can obtain a more significant and influential node set compared to conventional methods.
Introduction
A social network [1] is a service that directly facilitates real-life relationships between people on the Internet and thus expands other services online. According to Gartner, social networks are defined as a social structure [2]. The nodes that comprise a social structure can be personal and organizational. Social network user data, whether transferred between individuals, groups, or collectives, is emerging as one of the most mature forms of big data despite being a relatively new form of communication. Advances in science and technology make it possible to incorporate social network data for research and analysis [22–27].
With the rapid development of information technology, people’s lives are inseparable from social networks, and life and employment information are becoming digitized [3]. Digital information around individuals floods the entire network. In today’s mobile Internet era, also labelled an era of social networking, users (as the main participants in social networks) provide data with immeasurable potential scholarly value. In a matter of years, social networks have amassed a user base that the Internet previously amassed over decades. In 2016, Twitter’s third-quarter (Q3) earnings [4] indicated the number of active Twitter users in that quarter reached 317 million, an increase of 3% over the same period in the previous year.
In addition to Facebook, Twitter, LinkedIn, Google+, Instagram, and other global online social networking sites, domestic social network platforms, such as Sina Weibo, Renren, and WeChat, have also demonstrated promising growth. According to Sina Weibo’s Q3 2016 report [5], the monthly active subscriber base in September 2016 increased 34% to 297 million from the same period of the previous year. The average daily active users for September 2016 increased 32% to 132 million from a year earlier. Thus, social networks have infiltrated everyday life; it has become customary for people to share their feelings and to observe others’ reactions through social networking platforms.
The advent of social networks has also brought new social forms and advocacy activities from the Internet into the real world [6]. As a consequence, social networking is a popular research area. The core value of social networks lies in relationships between individuals. By studying the relationship between users and the information dissemination model on social networks, the real network can be quantitatively analysed to identify influential users and to support enterprises’ decision-making processes for market management. Moreover, social networks are not only used by individuals who are highly significant to businesses, national security, and social stability. By studying the influence of individual users, opinion leaders can control the development of public opinions or rumours while also disseminating new ideas. Similarly, public opinion can be predicted and controlled through user-released information that can be used for emotional analysis or topic evolution research. For example, Barack Obama used Twitter as a tool for political elections. False information released by a small number of Twitter users has caused mass waves of panic. Therefore, examining the behaviour of social network users [7], user relationships, and other social network facets to reveal internal laws is of great theoretical and practical value.
Social network data can be applied to all aspects of research, such as topic evolution, community discovery, and impact communication. Data are mainly generated by the behaviour of social network users, reflected in actions including browsing, forwarding, commenting, and collecting. Such behaviour offers potentially important implications for studies on social networks given that different users have different behaviours. Furthermore, the extensive user bases generated by seemingly endless social network sites offer rich behavioural data. Such data generated from user information, behaviour, and user relationships are worthwhile, as evidenced by the large body of research regarding user behaviour, user influence, user information dissemination, user portraits, and other topics. This paper focuses exclusively on the maximization of the influence of individual users and user groups based on user behaviour. The contributions of this paper are as follows: Taking Twitter as the research object, we study the basic theoretical concepts behind social networks and social network user behaviour. We gather social network user data to build a related data map via social network data visualization tools such as Gephi. Then, based on partial correlation data, we use simple mining to analyse relevant user behaviour and interest in specific topics. We study the related concepts and principles of the PageRank algorithm [8] and the associated calculation process [8] in the classic Google PageRank system. We find some deficiencies associated with the introduction of the conventional PageRank algorithm into social networks. This paper uses the activity-based PageRank (ABP) algorithm, which is based on the time distribution of user activity. By comparing the traditional PageRank algorithm, a modified PageRank algorithm with introduced overall user activity, and the ABP algorithm with introduced user activity based on time distribution, this paper studies the different effects of the ABP algorithm. We study the problem of maximizing user influence. The solution to this problem is based mainly on the information dissemination model, of which this paper studies the independent cascade model, the linear threshold model, the weighted cascade model, and the election model based on network structure. Because the traditional independent cascade model does not consider factors related to user behaviour, it is preferable to adopt an improved weighted cascade model. In terms of maximizing influence, this paper evaluates the difference between the greedy algorithm and heuristic algorithm and selects an approximate solution based on the improved weighted cascade model to solve the influence maximization problem.
The remainder of this paper is organised as follows: Section 2 outlines the study methodology, Section 3 presents the improved social network influence algorithm, and Section 4 details the influence maximization method and its experimental results. Section 5 discusses related work, and Section 6 concludes the paper.
Twitter data analysis methodology
The core elements of a social network are the network structure, users, user behaviour, and information dissemination. Twitter is a highly social, real-time micro-blogging service [3] that allows users to exchange brief, state-of-the-art content of 140 [9] characters on a tweet-based timeline. Twitter serves as the research platform for this article.
Twitter data collection
To examine social networking user behaviour and user influence, the first step is to obtain relevant data. The rich social data available on Twitter, the open beta data interface, and a complete and stable API make it an ideal medium for social networking site data-mining analysis. This article is based on the Linux platform, taking Twitter as the research object, to access relevant user data through the Twitter REST API and Streaming API. Streaming API has few restrictions, and its dataset is relatively large.
Accessing twitter API using OAuth (open authorization)
OAuth refers to open authorization. To use OAuth to authorize the Twitter API, one must create a Twitter account to obtain OAuth credentials through four certificates: consumer key, consumer secret, access token, and access token secret.
An individual’s credential information can be used to create an OAuth Authorization object that only represents itself. The OAuth2.0 authentication process [10] includes the following steps: The client initiates an authentication request to a user, namely a resource owner. The authorization request may be sent to the user either directly, as shown in Fig. 1, or indirectly through an authorization server. The user agrees with the authentication request and sends an authorization grant to the client. The client applies for an access token to the authentication server through the authorization grant and consumer key obtained in the previous step along with the consumer secret. The authorization server authenticates the client-supplied certificate and authorization grant and issues an access token to the client if the authentication is valid. Clients holding access tokens request resources from the resource servers. The resource server verifies the validity of access tokens and effectively responds to resources. After the last authentication, the object is authorized to be passed onto a class called Twitter that can submit queries to the Twitter API. The result of the Python run is as follows:
<twitter.api.Twitter object at 0x0000000002A3F B38>
Directional social relationships graph.
With this, the authorization to query the Twitter API can be successfully obtained through OAuth credentials.
After obtaining API authorization, we sent a request to Twitter to query the data needed for the experiment. For the purpose of this study, visits to Twitter are made through a proxy. This article combines Shadowsocks and runs a Python program to obtain the dataset by using proxychains with socks5 proxy in the terminal. The data returned by the OAuth 2.0 APIs is in JSON format and can be converted to Python objects. JSON is an ideal data exchange language; the Twitter API returns JSON-formatted data.
Twitter provides a given time interval as a means of balancing the server load; the time frame for a request of an application to access API resources is limited. Each individual API resource also gives specific restrictions, such as requests for popular topics. The API limits the program to sending only up to 15 requests every 15 minutes. The API also restricts the return of up to 5000 IDs at once for requests from friends or followers. Even though Twitter’s request limitations are sufficient for normal applications, to obtain the relational graph systematically, the program must control the number of requests over a fixed period of time while accounting for other HTTP errors, such as sudden network failure.
This above process requires a breadth-first search strategy from a seed user in which the Twitter API is requested to get four followers from this seed user and then get all the user’s followers through those four followers for a total of 1728 users. Finally, the followers are obtained from these 1722 users, for a total of 363,732 obtained users and 479,850 users obtained via unidirectional buddy concern.
Obtain user tweet data
User interest data is obtained through the GET followers/ids and GET friends/ids interfaces of the Twitter REST API. The Twitter REST API allows OAuth-certified developers to query user profiles, follower data, post new tweets, and more. The return JSON data format, in non-real-time, controls access to the amount of data somewhat more stringently. Streaming API is needed to obtain real-time tweets; it returns user information and tweets in real time according to search criteria without the harshness of the REST API and near truthfulness.
When accessing data, location parameters are used to stipulate geographic location according to different areas of different user behaviour. Some differences can be especially pronounced. However, location-based services are available only when users post tweets, and locations have values; for mainland users, they need to be proxied before they can be pushed to obtain a proxy location.
User data foundation analysis method
For the above data generated by user behaviour, this article only provides a simple analysis on the topological structure of the network structure formed by the user’s concern relations and tweets published. The main aim of this paper concerns related research and discussion of user influence and the influence propagation model based on user behaviour.
Social relations on characteristics analysis
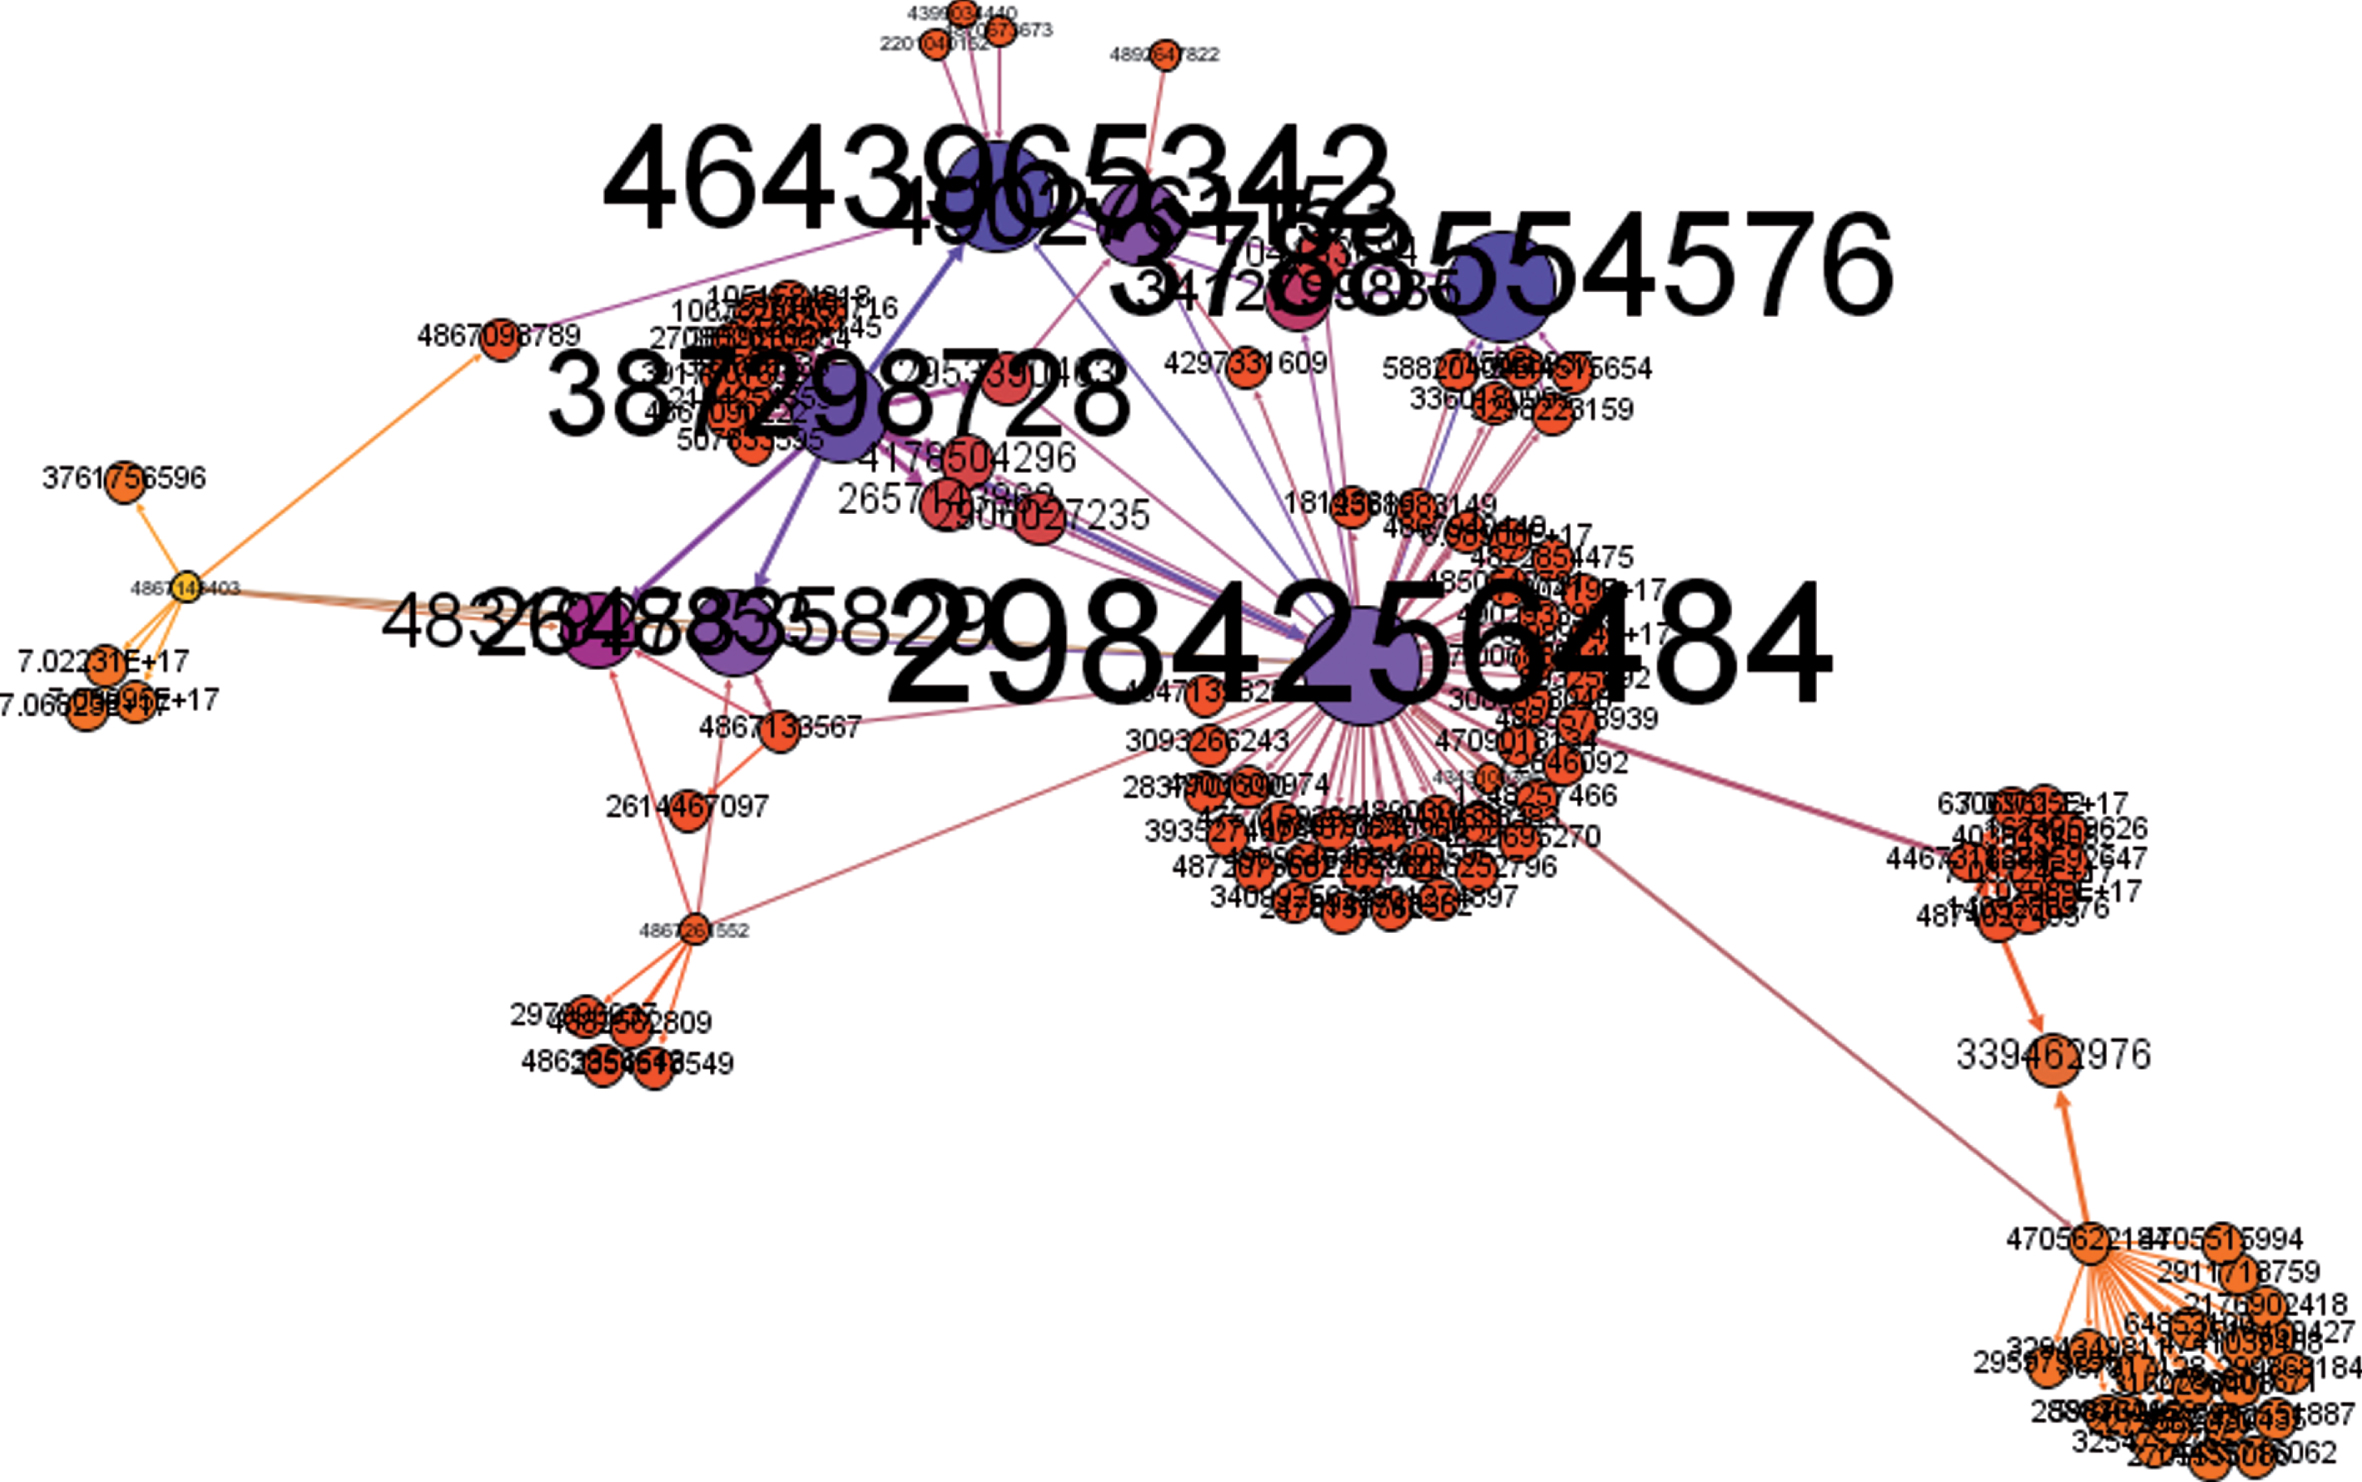
The asymmetric friend model of Twitter and the public status of most data provide highly favourable conditions to obtain users’ social graphs. As the name suggests, a social graph is a graph of data that represents social relationships. It includes social interactions such as follow / unfollow actions as well as user nodes and edges that represent concerns. Figure 2 illustrates a graph of social relations formed by 127 user nodes randomly drawn from user data and 163 attention relationships. The label shows the user ID number. Some parts of the map are dense while others are sparse, reflecting the user’s popularity.

Statistical diagram of language-related tweets.
Research about social networks is complex and interdisciplinary, involving mathematics, psychology, and social science. In this paper, we conduct a basic statistical characteristics analysis of the social graph in Fig. 1, including the network average degree, average path length, and average aggregation coefficient.
Tweets [11] represent an important part of social network analysis and provide essential metadata that users generate when they post informational behaviour. Tweets obtained through the API represent pieces of JSON data.
The deleted tweets are far from the 140-character length specified by Twitter because this JSON data contains the tweet content published by the user (i.e., the text field) along with the user information, user push text, and other tweets related to browsing. For example, if the user embeds a media file such as a video when posting a tweet, then the tweet will contain the media field; if the user publishes tweets @ other users, then the user_mentions field will appear. Additionally, Favorite_count indicates the number of times the tweet has been stored, retweet_count denotes the number of times the tweet has been forwarded, and followers_count and friends_count represent the user’s followers and friends, respectively.
Real-time tweet analysis programming language heat
This section analyses the popularity of programming languages, filtering several languages such as Python, JavaScript, C++, and Ruby to be taken as the analytics object. The dataset ranges from February 20, 2017 at 03 : 46 : 03 to February 21, 2017. During that time, 46216 real-time tweets were posted by users about Python, JavaScript, C++, and Ruby at 03 : 55 : 04.
Given the scope of this research, it is important to choose a suitable development language. The above four languages are randomly chosen and not representative, and users can obtain relevant data according to their individual needs. The 46216 tweets have been filtered through data filtering. Statistics on related tweet released by users in various languages are shown in Fig. 2.
Users posted over 10,000 tweets each related to Ruby, Python, and JavaScript; Ruby garnered 16391 related tweets. Fewer C++-related tweets were posted, suggesting that C++language enthusiasts may not always post to or update Twitter. The popularity of Ruby appears high based on the collected data.
Unsurprisingly, English ranks first; it is the most widely spoken language in most countries in the world. It is also the second most widely spoken language in the world, although the number of native English speakers is less than Chinese and Spanish. Relatively fewer tweets are in Japanese.
Based on the above data, Ruby and Python appear to be relatively popular topics worldwide, as related English-language tweets are most common followed by Japanese, indicating that Japanese may be relatively active Twitter users. A separate analysis of Chinese-language tweets about programming languages on Twitter reveals few mentions of Ruby; Python and JavaScript are more common. User preferences for programming languages are not necessarily the same across countries.
ABP algorithm for the analysis of user influence
With the release of Twitter API, Twitter has become a popular scholarly topic, especially in terms of user influence. PageRank is a widely-used algorithm to calculate user influence, but it depends on user relationships and lacks timeliness.
ABP algorithm
From the perspective of graph theory, social networks and web networks have similar topologies; however, their ecological environments are different. Using the PageRank algorithm to calculate social network user influence only considers ‘following’ relationships between users and neglects some factors related to the user’s own behaviour. Thus, the results do not reflect the user’s true influence. The influence of a user node in a social network is related to the number of fans and to post time, post frequency, and transmission frequency of tweets. In social networks, information is transmitted between users mainly through following and fan relationships. When a user posts a tweet, it is transmitted through fan relationships; therefore, the user’s influence can be defined as his/her ability to communicate information. If a user has thousands of fans but rarely tweets, or if he tends to update tweets late at night, his communication impact is likely to be lower than that of users who update frequently. To reflect user influence more realistically, this paper introduces a measurement of user activity based on the original PageRank algorithm and studies the improved ABP algorithm based on the time distribution of user activity:
Considering that the activity of a user on a social networking site exerts some influence on the ABP value, a new evaluation index, activity A, is introduced. Assuming that the user posts N tweets during a specific time T, user activity A is calculated as follows:
This formula allows for filtering out of ‘zombie’ users who do not tweet for a long time. A tweet posted during a time with high access traffic is more likely to be seen or forwarded. However, users have different behaviours and habits when accessing Twitter: some people may prefer to access Twitter when most others are sleeping. Tables 1 and 2 indicate that access traffic varies during different time periods.
Therefore, to reflect user activity more realistically, this paper divides user activity by hour and adds a corresponding weight W to denote different periods of activity. The activity of user is thus expressed as follows:
To verify that the improved ABP algorithm objectively describes the actual situation, this paper chooses user data from a micro-group in the dataset as the research object. Through the PageRank calculation method analysed in the previous section, we use the classical PageRank algorithm, an improved algorithm with overall user activity, and the ABP algorithm based on the time distribution of user activity to respectively calculate user influence. Then, we compare and analyse the calculation results of these three algorithms.
Selection of W i
In the ABP algorithm based on the traditional algorithm, the aging weight factor is introduced. To calculate user influence by the ABP algorithm, we first need to calculate the weight of tweets during each time period. However, the time at which the user visits the social networking site is not fixed but relatively random, so the distribution of the aging weight is not static. We can estimate the typical dis-tribution of aging weight by multiple experiments and obtaining data randomly.
We can use the time distribution of users’ Twitter access to estimate the weight of tweets during each time period. Although we can only obtain the time distribution of posted tweets, we believe the time distribution of tweets can be used to approximate the time distribution of users’ Twitter access. Then, the aging weight distribution can be estimated. Through the request parameter locations provided by the Twitter Streaming API, the dataset of tweets in a day at a location can be obtained in real time with the following time distribution:
Figure 3 shows a certain gap between users’ tweet traffic at different time periods, with the highest number of visits from 9 : 00 to 13 : 00. Users appear to be relatively active during this time window, and it is easier for a tweet posted at this time to be seen. The number of visits per day is lowest from 1 : 00 to 5 : 00, when users appear relatively inactive; hence, tweets posted at this time are less often seen. Of course, user behaviours in different countries or regions can vary, so we should attempt to control variable factors across user regions.
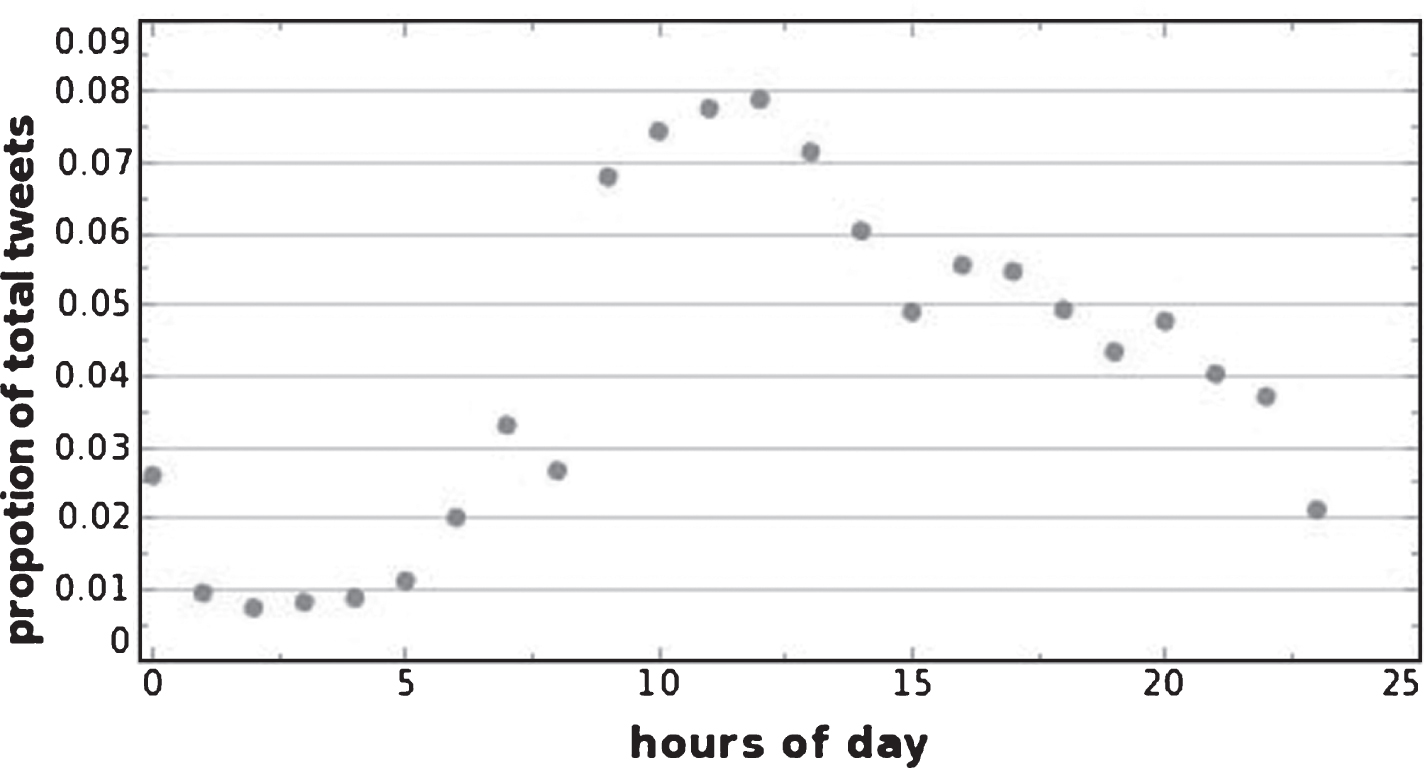
Time distribution of tweets in a day.
To better analyse users and algorithms, we first use Gephi to create a directed graph of social rela-tions for the above 10 analysed users; see Fig. 4.
The node size in Fig. 4 is only related to node degree and has nothing to do with influence. The edges between nodes represent the ‘following’ relationship between users, and the node labels are the screen_name attributes of users.
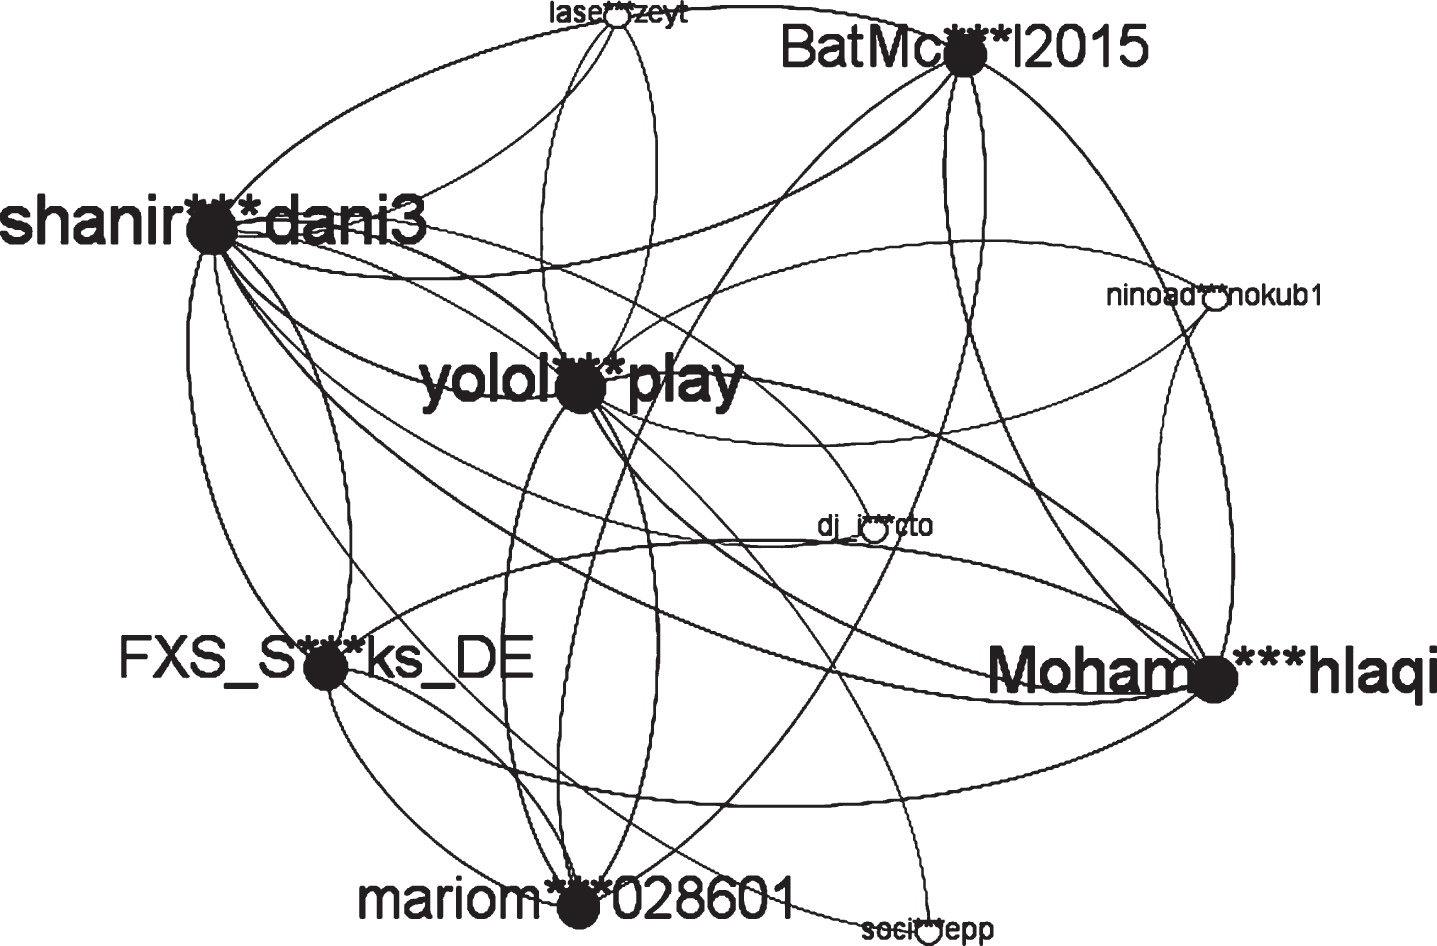
Directed graph of social relations for some users.
According to Fig. 4, we first analyse user influence based on the traditional PageRank algorithm. Tables 3–4 show that some users have the same influence because their circle of followers is the same. The traditional PageRank algorithm indicates that their PR values eventually tend to be equal. Here, we focus on users with a high PR value (i.e., opinion leaders), which are the users shanir *** dani3 and yolol *** play as shown in Table 4. As indicated in the social relation graph, the user shanir *** dani3 and user yolol *** play have a large node degree, reflecting more ‘following’ relationships. Experiments show that the results of the traditional PageRank algorithm to calculate user influence in social networks have a large correlation with ‘following’ relationships.
The two improved algorithms introduce the factor of user activity and provide a different ranking of user influence. As illustrated in Tables 6 and 7, the user yolol *** play is significantly more active than other users with a significantly higher influence value. However, the user shanir *** dani3, who has a similar PR value to yolol *** play under the traditional PageRank algorithm, has a much lower rank in the improved algorithm. Furthermore, the user mariom *** 028601 has not posted a tweet since the beginning of the research period, resulting in an activity of0 and the lowest user influence—but this user’s influence is not the lowest according to the traditional PageRank algorithm. The users FXS_S *** ks_DE and BatMc *** l2015 share the same fans and friends, so their PR values under the traditional algorithm are the same. But the user FXS_S *** ks_DE has higher activity, which leads to greater influence. Therefore, both improved algorithms can improve the ranking of the users and effectively eliminate zombie users.
Extensive research has verified that the improved PageRank algorithm based on user activity has enhanced user rankings. This paper mainly compares the improved algorithm based on overall user activity and the ABP algorithm based on the time distribution of user activity.
To illustrate the mechanism behind this ranking change, this paper obtained tweets posted by the user lase *** zeyt and user BatMc *** l2015 and compared the time distribution of tweets between these two users and all the users in a day, as shown in Fig. 5.
As Fig. 5 demonstrates, high access traffic generally occurs between 9 : 00 and 14 : 00, after which the number of users decreases gradually. The user lase *** zeyt posts more tweets between 9 : 00–13 : 00 and 17 : 00–19 : 00, which are windows that see a relatively large number of users. By contrast, the user BatMc *** l2015 typically posts tweets between 12 : 00–16 : 00 and 21 : 00–23 : 00, periods with a relatively small number of visitors. Given site traffic, tweets posted by user lase *** zeyt are more likely to be seen.
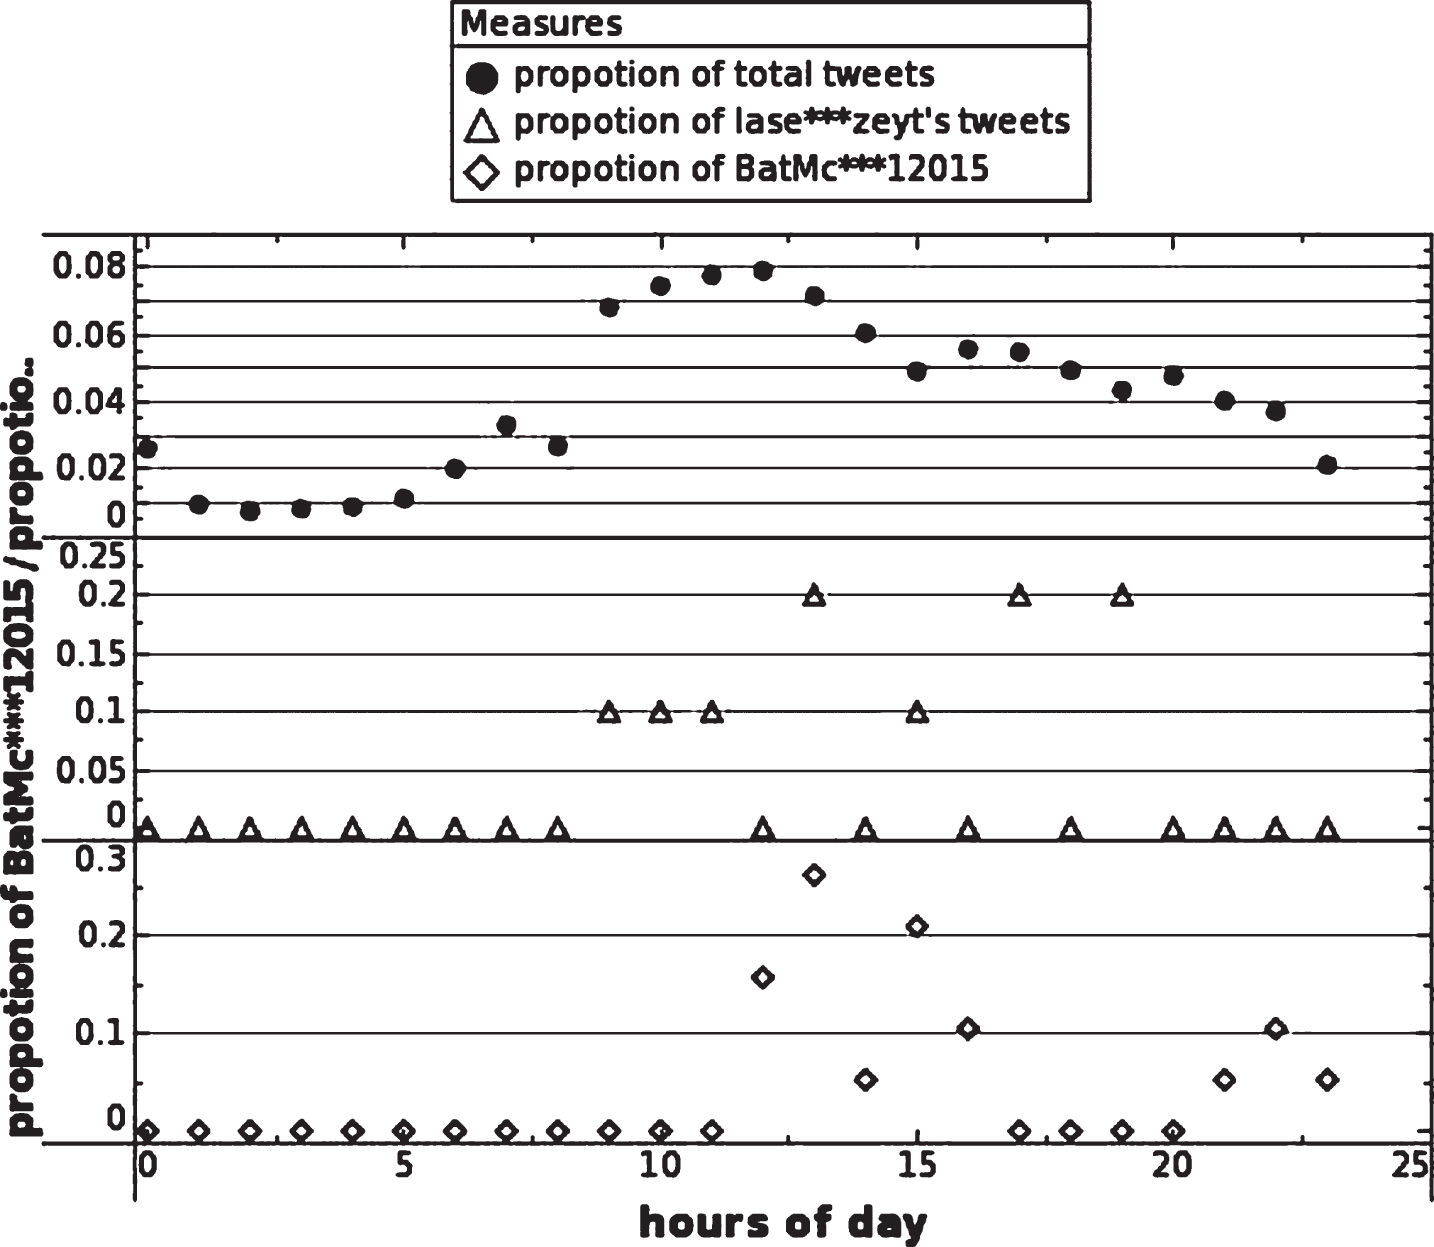
Time distribution of tweets.
The improved algorithm based on the overall activity ranks influence only according to the user activity during a specific period. The more tweets that are posted during a unit of time, the more influence is added, leading to greater user influence for the user BatMc *** l2015 compared to lase *** zeyt. Actually, lase *** zeyt usually posts tweets under high access traffic, and his tweets are more likely to be seen. The ABP algorithm decreases the ranking of user BatMc *** l2015. Experiments show the ABP algorithm to be more timely and persuasive, which can improve the ranking of active users and decrease that of inactive users.
This section outlines improvements to a special kind of independent cascade (IC) model, called a weighted cascade (WC) model. Because the weighted concatenation model is based on the propagation model of social network topology, the weight of the connection between the user nodes only satisfies a simple probability function, such as the reciprocal of the node entry degree. As a result, whether the friend relationship is close or not, the users are treated as equally influential. However, in practical networks, the contribution of different nodes to information dissemination varies: opinion leaders or similar authoritative users should have a greater influence probability than general users, which can further promote the spread of information. Therefore, this section introduces the individual influence of users and the frequency of inter-user relaying based on the user’s concern. Then, an improved WC model is designed before being analysed and compared through experiments.
Basic influence propagation model based on network structure
The influence propagation model is a basic theory to study influence maximization. It is based on the network structure and interaction among network nodes; this model defines the mechanisms of interaction among the nodes of a social network.
The social user’s concern in the network is directional and can be depicted as a directed graph in which information transmission satisfies the following rules: There are only two possible states for each node in the social graph: active and inactive. An active node can affect other nodes and can only attempt to affect adjacent inactive nodes. Each inactive node is affected only once. A node can only change from an inactive state to an active state; it cannot change from an active state to an inactive state. After an inactive node accepts a message and becomes an active node, that node may try to influence a neighbouring inactive node. A node in the active state remains active after trying to activate all the nodes in its adjacent non-active state, but it no longer has influence. The communication process is unidirectional and irreversible.
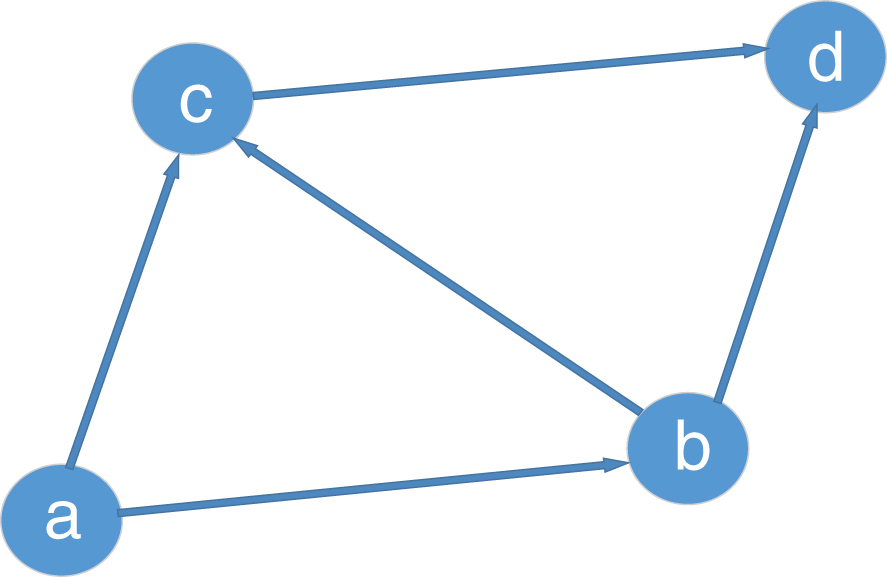
Suppose there is a concern diagram as shown in Fig. 6: node a is the initially active node, and nodes b, c, and d are the initially inactive nodes.
Assume that t is the initial time of propagation. Node a is active at this moment and can try to influence other non-active nodes adjacent to it, namely nodes b and c. If node b is not influenced and activated by node a, then node b is still inactive and node a can no longer attempt to affect node b. If node c is activated by node a, then node c transitions from an inactive state to an active state and can affect its neighbouring nodes. After node a attempts to affect all neighbouring nodes b and c, it no longer has influence ability. At time t + 1, node c can try to influence its neighbour node d again. If node d is activated by node c, then node d changes from an inactive state to an active state, and all nodes no longer have influence. After all the steps, nodes a, c, d in the relational network are in an active state, and node b is in an inactive state. If node d is not activated at time t + 1, no node in the network has influence ability at that moment. Finally, nodes a and c are in an active state, and nodes b and d are in an inactive state.
Influence communication relations diagram.
The move of one node from inactive to active is called activation. The process of a node going from inactive to active is called propagation of influence. In a social network, when all nodes are no longer influential, the spread process will end; this process is irreversible.
The IC model was first proposed by Jacob Goldenberg [12] who pointed out that the independent cascade model is a probabilistic model. The basic assumptions of the model are as follows: There are only two states of nodes in the network: active or inactive. The active state refers to a node that accepts information passed by some other node; otherwise, the node is inactive. The state only considers changes in one direction, from an inactive state to an active state. The process by which the node u tries to activate its adjacent node v belongs to a p
uv
probability probabilistic event, and the probability that node v in an inactive state is activated by the node u entering an active state is independent of the probability of any adjacent active node trying to activate node v. Node u only has one chance to try to activate its adjacent node v, whether it succeeds or not, and node u will always be active at a later time but will no longer have influence. This kind of node is called a non-influential active node.
These assumptions are consistent with the rules of online communication of information on the directed graph of social networks and can be applied to the study of online social networks. The IC model of the information dissemination process can be described thusly: Assume an initial set of active nodes S. At moment t, the probability p
uv
of newly activated nodes u will affect their adjacent nodes v. The greater the probability p
uv
, the more likely it is to succeed. If there are many nodes in the new node that are adjacent to node v, then these nodes will try to activate nodes independently in any order. If node v is activated, then at time t + 1, node v becomes active and will affect its adjacent non-active nodes; otherwise, the state of node v will not change at time t + 1. The above process is repeated until all nodes in the network are no longer influential, which marks the end of the communication process.
Assume that the influence probability shown in Fig. 7 is added based on the social network diagram in Fig. 6.
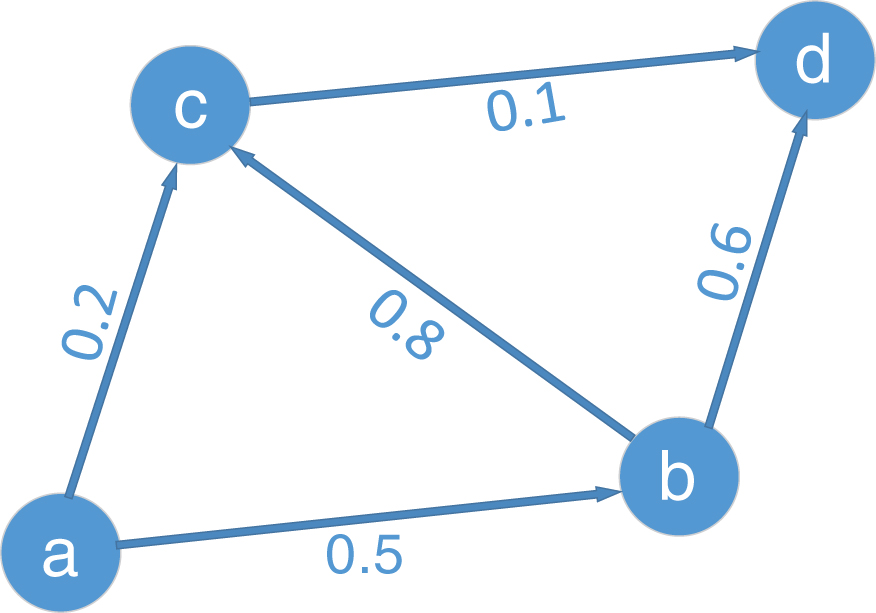
Independent cascade model relationship diagram.
It is also assumed that the propagation process starts at time t, and the initial node a is active. At time t, node a deactivates nodes b and c with an influence probability of 0.5 and an impact probability of 0.2, respectively. Assume that at time t, node b is activated and node c is not. Then, at time t + 1, node b will deactivate nodes c and d with an influence probability of 0.8 and 0.6, respectively. If the activation is successful, then the process of affecting the propagation ends. At this time, nodes a, b, c, and d are in an active state.
The WC model [39] is a special independent cascade model based on network structure. In the WC model, the probability that node u successfully activates its neighbour node v is the reciprocal of the penetration rate of node v (i.e., the reciprocal of the node v’s in-degree,
Influence maximization algorithm introduction
The rapid development of social networks is accompanied by swiftly expanding network size; the number of nodes in a network is large, relations among nodes are complex, and its behaviour-related data are vast. As a result, research on social networks is computationally intensive and time-consuming, and the requirements of the algorithm are becoming increasingly challenging. The running time and algorithmic accuracy are important to consider in solving the problem of maximizing influence. At present, the main research algorithms are the greedy algorithm and heuristic algorithm. For the purpose of solving the influence maximization problem, this section mainly introduces the GeneralGreedy algorithm [13] and degree-heuristic algorithm [14].
Degree-heuristic algorithm
Due to the high computational complexity and long running time of the greedy algorithm, Kempe et al. [14] proposed a heuristic algorithm known as the degree-heuristic algorithm, which has a short design time and brief running time due to a simple design.
“Heuristics [21] refer to a technique that finds a solution to a problem in a short period of time based on limited knowledge (or ‘incomplete information’)”. The degree-heuristic algorithm draws on the sociology of nodes by measuring the influence of node ideas. Assuming that the initial set of active nodes is S, the degree-heuristic algorithm selects each node v with the highest degree in the set V S of relational graphs G(V,E)and joins the set of active nodes S. That is, the algorithm selects k nodes with the largest degree as the initial active node set.
The degree-heuristic algorithm greatly shortens the running time through a simple algorithm design but reduces the influence range of its relative greedy algorithm accordingly.
Research on the maximization of social network influence based on improved WC propagation model
Improved WC model
As mentioned in the previous section, the influence weight of the traditional weighted concatenation model on nodes is based on the assumption of a fixed value; that is, the probability of all adjacent active nodes of a certain node affecting them is the reciprocal of their degrees of inference, and the node acceptance rate of information is a random probability, which facilitates a solution for the research problems of modelling and maximization. However, the valuation assumption that affects weight is only based on the entry parameters of the network topology. It is impractical to apply it to social networks because it neglects the role of factors outside the network structure. The weight of influence between users in social networks is related to their activities on the social network in addition to their concerns with users. Each user has his/her own preferences, interest circle, and concerns about the content. Users in social networks reflect different influences. Users with high activity or more focus on users have relatively large influence, and other users are generally concerned with the content they release. Therefore, this section focuses on the definition of the traditional WC model and social network user behaviour. We introduce influence parameters to calculate the probability of the impact between users and the behavioural likelihood of forwarding information to calculate the probability of acceptance between users so as to improve the traditional WC model.
To calculate personal influence, this section will use the PageRank algorithm introduced previously. Based on the PageRank algorithm (introduced in the related work), we define the node u’s probability of impact P
uv
on node v as follows:
(i is v’s adjacent active nodes)
where PR (u) is the influence of node u, and the influence weight of node u on node v is the proportion of the influence value of node u on the impact value of all adjoining active nodes on node v. In this way, the more influential users have a relatively greater probability of successfully impacting adjacent nodes in the non-active state.
In the traditional WC model, the node acceptance rate of information is a random probability. However, in real social networks, users have girlfriends, buddies idols, and followers who do not know the likes or dislikes in their own social networks. Therefore, although the information with which users are concerned is somewhat random, users are more likely to follow messages that align with their own preferences. For example, the topics about which users are usually more concerned, or other users’ posts related to their own tweets, are more interesting or likely to be forwarded. Therefore, defining the node’s acceptance rate of information directly with random probability reduces the reliability. We can take all the adjacent nodes of a node. If one node of a user’s tweets is forwarded with a subsequently larger amount of forwarding, it can be assumed that this node attracts relatively more attention to this adjacent node; thus, the node will more likely accept this adjacent node’s released tweets and other information. Therefore, through tweet-forwarding behaviour, the user acceptance rate of information is described. The information acceptance rate from node v to node u can be defined as
(i is u’s adjacent active node)
where Re(v,u) denotes the tweet number of node v forwarding from node u, and W uv indicates the information acceptance rate of node u to the node v, the value of which is the ratio of the number of tweets that node u forwards node v to the number of the forwarded tokens of all the adjacent nodes of node u. If node u is never forwarded, its information acceptance rate is set at zero.
From the prior analysis, the GeneralGreedy algorithm is highly accurate but has trouble meeting the computing requirements of influence in the big data era due to substantial calculations and a long running time. The degree-heuristic algorithm has low complexity and greatly decreased running time but reduced accuracy. However, the difference between the running time of the two algorithms is far greater than the difference in accuracy between them, as evidenced by the following analysis.
Figures 8 and 9 show the dataset for 200 rounds of simulation with the GeneralGreedy algorithm and degree-heuristic algorithm based on the WC model on 10878 user nodes and 39994 concern datasets, respectively.
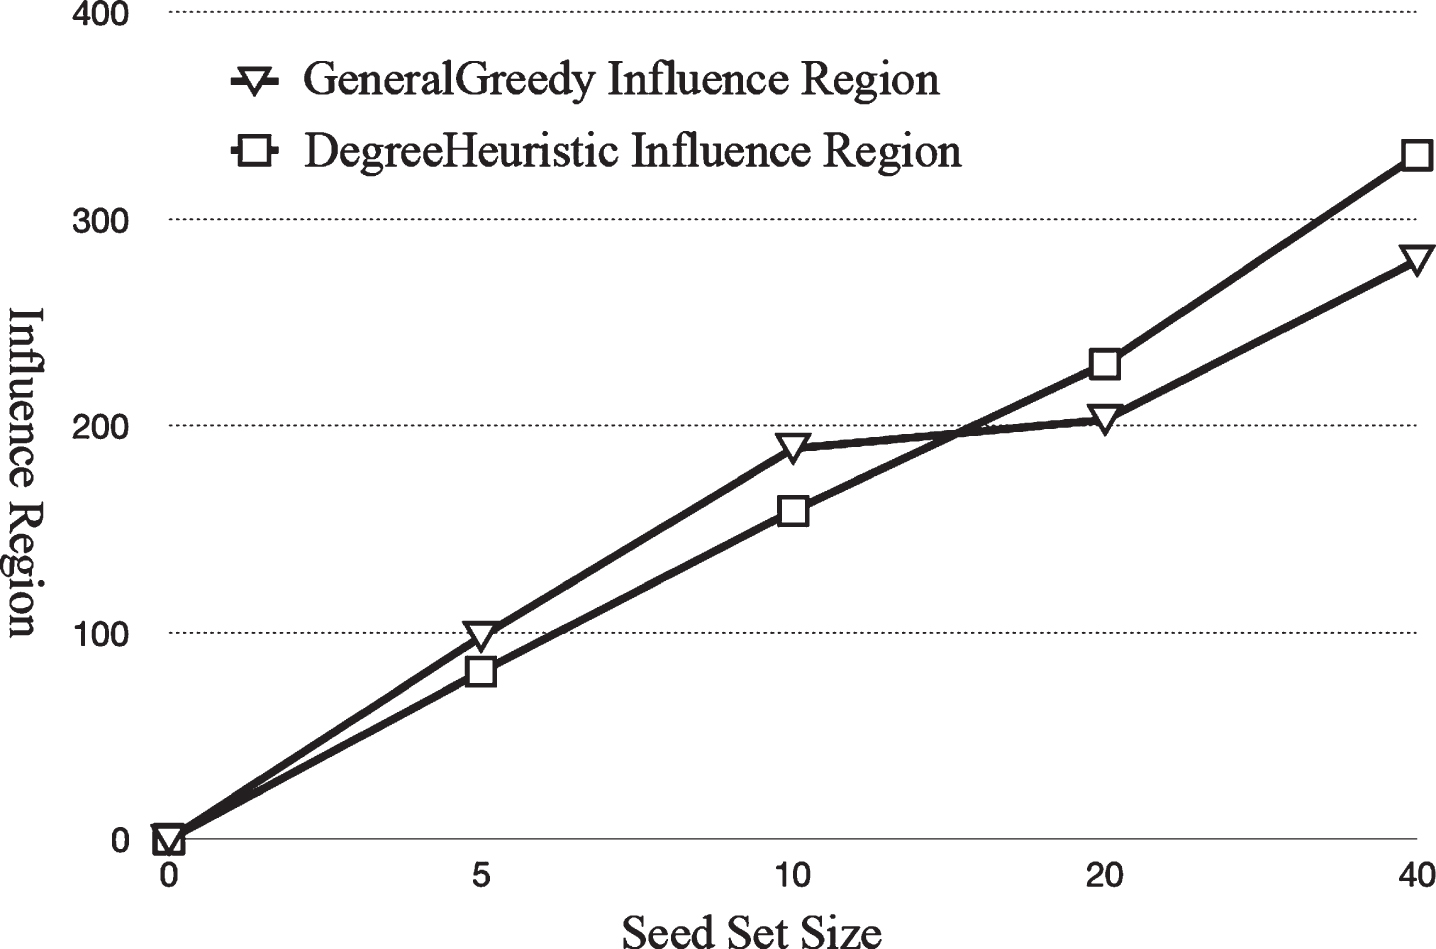
GeneralGreedy and degree-heuristic influence region (n = 10878, m = 39994).
Because the running time of the greedy algorithm may be too long, the general method is to use 20000 simulated rounds. In the experiment, we use 200 simulated rounds to save time without affecting the experimental results. As can be seen from Fig. 8, the algorithm accuracy of the improved degree-heuristic algorithm is comparable to the GeneralGreedy algorithm with this dataset.
As shown in Fig. 9, the running time of the GeneralGreedy algorithm proposed by Wei Chen and others is quite different from that of the degree-heuristic algorithm proposed by Kempe et al. The difference between the two algorithms may be thousands of times or even tens of thousands of times apart. The comparison of the influence region in Fig. 13 demonstrates that the arithmetic accuracy of the heuristic-degree algorithm is similar to that of the GeneralGreedy algorithm.
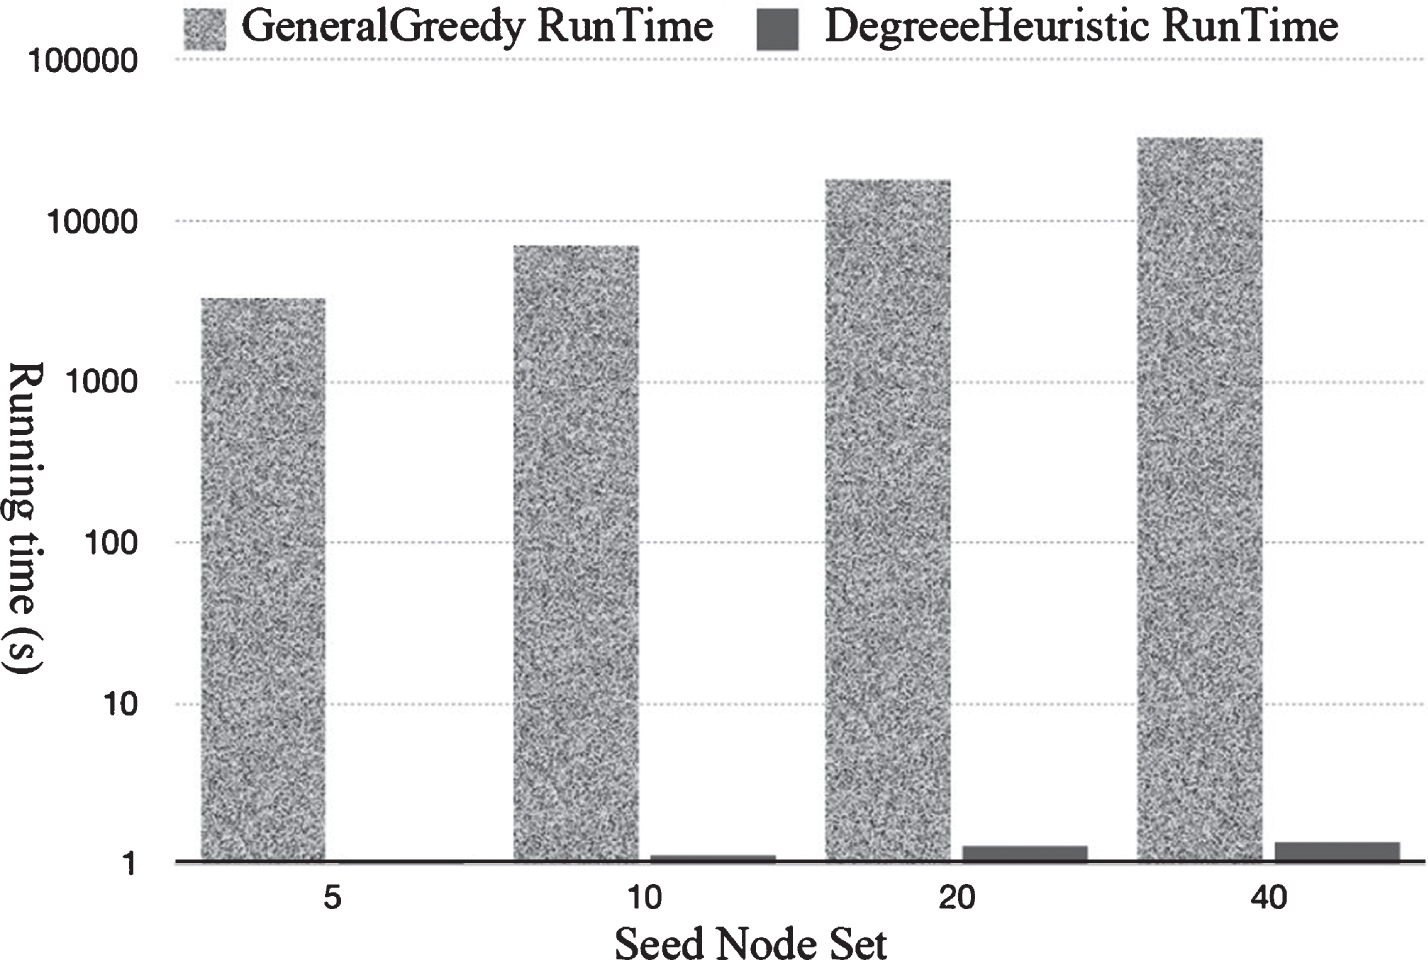
GeneralGreedy and degree-heuristic running time (n = 10878, m = 39994).
Wei Chen et al. analysed and compared various greedy algorithms and heuristic algorithms, noting that a disadvantage of greedy algorithms in terms of running time is far greater than the advantage of heuristic algorithms in algorithmic accuracy. To reduce the run-time of greedy algorithms, it is better to use a heuristic algorithm, which runs one million times faster. The accuracy of the improved degree-heuristics algorithm is substantial, whereas the running time of the GeneralGreedy algorithm is extremely large. Therefore, to save computational time costs, we use the degree-heuristic algorithm proposed by David Kempe et al. to conduct an experimental analysis on the above-mentioned weighted concatenation model.
PageRank algorithm
The PageRank algorithm is a classic Google page ranking algorithm proposed by Larry Page and Sergey Brin in 1998 [8]. PageRank operates by counting the number and quality of links to a page to determine a rough estimate of how important the website is. The underlying assumption is that more important websites will likely receive more links from other websites.
If a page I is referenced by the page M, N, and L, then page I is assumed to be important (obtaining an increment of the PR value) from the perspective of M, N, and L. If a page J is only referenced by page W, but the importance of page W is much higher than that of page M, N, and L, then the PR value of J may be higher than I even though page J is referenced by fewer pages. Consequently, the ranking of webpages depends on the number and quality of links. The following is the formula of the PageRank algorithm:
The above formula introduces the concept of a stochastic model [15], assuming that Internet users randomly browse a number of pages. The parameter d represents the probability that, at any moment, a user browses the current page v and continues to browse linked pages. It is defined as the damping factor with a default value of 0.85. Correspondingly, 1 – d represents the probability that the user does not click any link on the current browsed page and jumps randomly to a new page. In most cases, this formula satisfies the property of the Markov chain [16], which means the PR value tends to remain stable after n iterations. However, if a browsed page has no link out, then the user randomly jumps to a new page. These pages with no link out, like a black hole, gradually decrease the probability that the user will continue to browse pages. To avoid a situation where the PR value cannot converge to a stable value because of these types of hanging pages, the damping factor is introduced.
The social network influence [17] maximization problem is to find a set of k active nodes of an integer number, based on a particular propagation model, to maximize the information spread in the network (i.e., the largest influence area). Pedro Domingos and Matt Richardson [18] proposed the single pass algorithm and greedy search algorithm to find an approximate solution to the influence maximization problem. David Kemple et al. [14] first defined the problem of maximizing influence, namely finding K nodes that can maximize the influence propagation based on a given propagation model. Then, they proposed a basic greedy algorithm to find an approximate solution. Wei Chen et al. [19] proposed a heuristic algorithm based on the degree-heuristic algorithm for IC propagation models and demonstrated that the accuracy of the algorithm was greatly improved compared to the degree-heuristic algorithm. Jacob Goldenberg and others first proposed the IC model when applied to marketing models as a probabilistic model [12, 20]. After that, many researchers made improvements to the problem.
To solve the maximizing influence problem, it is necessary to rely on social communication models along with information dissemination models. The basic concept is described as follows: based on a given impact propagation model, find k initial active nodes to maximize the influence of the final social network.
Conclusion
This paper presents a study on user influence and its maximization according to user behaviour, based on users’ tweets and other activities as indicated by the Twitter REST API and Streaming API access to users’ concerns, user-published real-time tweets, and other data. We analysed the basic statistical characteristics of the social network map formed by the users’ concerns to obtain popular topics and popular programming languages through an evaluation of user-posted, real-time tweets. Based on user-released tweets, we analysed user tweets based on time distribution. User activity was then studied based on the released time distribution of tweets, and we used the PageRank algorithm to calculate the individual influence of users and correspondingly assess the impact of social network users’ influence. From the influence propagation model, we studied the improved WC model based on the PageRank algorithm. Based on the degree-heuristic algorithm, the weight-based cascade model and traditional WC model were respectively used to solve the influence maximization problem.
Footnotes
Acknowledgments
This research was supported by Postgraduate Research & Practice Innovation Program of Jiangsu Province(KYLX16_0769), Research Projects of Education and Teaching Reform of Nanhang Jincheng College in 2019 (2019-Y-28).