
Abstract
The frequent false alarms in Forward Collision Warning systems not only disturb the normal operation of drivers, but also reduce the user acceptance of the warning systems. However, drivers with disparate driving characteristics possess different safety cognition of car-following braking behavior; systems with stationary warning thresholds inevitably lead to higher false positive and false negative rates for aggressive and conservative drivers, respectively. In this study, we proposed an adaptive algorithm that learns the characteristics of individual drivers during car-following braking processes, and determined the optimal threshold online to adapt to different drivers. Signal detection theory was employed and the results of the accuracy, false negative rate, and false positive rate were used to capture drivers’ characteristics of car-following braking behavior. The optimal warning thresholds were continuously selected online during the learning stage based on changes in the drivers’ characteristics. The developed algorithm by conducting actual vehicle tests with two participants were evaluated. The offline statistical analysis results of the participants’ car-following braking characteristics were compared with the online results of the warning threshold adjustments from the adaptive algorithm. The comparison results indicated that the adaptive algorithm could effectively capture the drivers’ car-following braking characteristics and determine an appropriate warning threshold.
Introduction
Forward Collision Warning (FCW) systems have increasingly been applied in longitudinal driving assistance systems of intelligent vehicles to reduce the possibility of rear-end collisions by transmitting warning signals to drivers [1–3]. Due to the intimate relationship between FCW systems and drivers, there are two main requirements for system performance: On the one hand, the systems must work steadily and reliably to transmit a warning signal when there is a potential rear-end collision; on the other hand, the dangerous decision-making characteristics of FCW systems should conform to the individual’s driving characteristics to ensure the acceptance of the system, and the warning signals cannot interfere with the normal driving of the drivers [4]. However, a universal warning threshold used in an FCW system developed for the ordinary driver would not adapt to different driving characteristics. In actual driving, there are distinct variations in safety cognition and driving characteristics among different drivers. Even the same driver may possess disparate driving characteristics under different traffic environments [5]. These individual differences and fluctuations in driving characteristics have resulted in enormous challenges in the design of FCW systems. Therefore, determining how to make the systems adapt to different drivers under the premise of ensuring safety has become a key technological goal for improving the acceptance of the FCW systems[6].
Over the years, multifarious methodologies have been exploited in an effort to improve the self-adaptive ability of FCW algorithms. Machine learning and mathematical optimization are the two most common self-learning methods for the establishment of adaptive FCW models. The purpose of the machine learning models is to constitute the mapping relationship between different driving characteristics and personal warning thresholds based on the analysis of naturalistic driving data [7, 8]. The artificial neural network (ANN) model, fuzzy model, discriminant model, and hidden Markov model are commonly employed to establish adaptive learning models [9–12, 38–41]. Hirose et al. [13] employed the braking moment, relative distance between the host vehicle and preceding vehicle, driver reaction time, and time headway (THW) to categorize drivers into three driving styles: conservative, moderate, and aggressive; each driving style corresponded to a personalized warning model by structuring an ANN model, and the fuzzy algorithm was used to match the proposed model to different drivers. Xiong et al. [14] analyzed the time to collision, time headway, and the final relative distance under emergency braking to evaluate driving safety; and a fuzzy logic was used to constitute different FCW algorithms to adapt to drivers with different driving styles. Mathematical optimization methods are employed to identify the personalized parameters of the proposed FCW models based on different driving characteristics. Least mean squares (LMS), least squares (LS), and recursive least squares (RLS) are commonly used to establish an adaptive learning model [15]. Yoshida et al. [16] proposed a computational model of the expected acceleration of different drivers. The differences in driving characteristics can be reflected by the values of two parameters in the proposed model, but the parameter identification process needs to be completed offline. A self-learning model for different driving characteristics was established by Zhang et al [17]. The LS method was employed for the online identification of the driver’s model parameters, and a neural network was used to automatically match the parameters to different drivers.
FCW models are an essential component for exploiting adaptive warning algorithms, and empirical research has been pursued to develop the most appropriate warning indicators and warning criteria that conform to an individual’s cognition of driving safety [18, 19]. At present, there are two common FCW models, which include warning algorithms based on safety time and safety distance. Time to Collision (TTC) and Time Headway (THW) are the major warning indicators in FCW models. Yoshida et al. [20] defined the probability of rear-end collision according to different TTC values. Polychronopoulos et al. [21] established a virtual force model for FCW systems by using TTC and THW indicators. According to different driving characteristics, an adjustable warning threshold based on TTC values was proposed by Wang et al [22]. Li et al. [23] determined different TTC thresholds based on different speed ranges of the subject vehicle. The safety distance model determined the minimum safety boundary to ensure longitudinal safety. Martinez et al. [24] defined different risk levels for rear-end collision according to the relative distance between the subject vehicle and the preceding vehicle. Vogel et al. [25] established a risk assessment model for rear-end collision by using the THW indicator.
Due to the complexity and instability of machine learning models, they are not widely employed in practical FCW systems [26]. Although numerous self-learning algorithms of driving characteristics for FCW systems have been developed and verified in driving simulators, studies that have focused on performance evaluation in an actual driving environment are sparse. To address the deficiencies of past studies, the present work investigates the effect of discrepant warning thresholds according to driving characteristics on the user acceptability of FCW systems, while explicitly taking the subjective risk cognition characteristics of drivers into account. To this end, an FCW model that could adapt to individual characteristics based on signal detection theory (SDT) was established. The inverse of TTC (TTCi) and THW were determined as the FCW indictors. In order to verify the effectiveness of the proposed algorithm, an embedded system platform and a test vehicle platform were exploited to complete an actual vehicle test. By learning the characteristics of the braking process, the proposed adaptive algorithm was able to capture the driving characteristics and determine optimal warning thresholds for different drivers.
Adaptive algorithm design
FCW criterion establishment
The determination of warning indictors is the premise of the development of the warning criterion. During the process of car-following, THW and TTC are important indicators for characterizing the hazard level between the subject vehicle and the preceding vehicle in FCW models. Empirical research has employed the two indicators to establish FCW criteria. The definitions of THW and TTC can be expressed as:
A smaller TTC value indicates a higher risk level. However, in the actual calculation of the TTC value, the TTC value will be large when the relative speed is very small, even if the relative distance is very close. In this work, we employed the inverse of TTC (TTCi) to replace the TTC indicator. The definition of TTCi is given by:
Twin-stage rear-end collision warning has been generally accepted and developed in the exploitation of FCW systems. The progressive warning mode can not only reduce the interference to drivers, but can also improve system acceptability. The present work employed the THW and TTCi indicators to establish a twin-stage rear-end warning strategy. The primary warning threshold is employed to remind drivers that there is a possibility of rear-end collision. The secondary warning threshold is employed to inform drivers that a rear-end collision is inevitable unless the driver immediately brakes. The detailed FCW criterion is presented in Table 1. The system initiates the primary warning when either of the values of the two indicators reaches the preset warning threshold, and the secondary warning is activated when both indicators reach the threshold.
The hierarchical FCW criterion
Over the years, numerous empirical studies have investigated the performance of different warning thresholds for FCW systems. For the TTC indicator, 3 s and 5 s are currently determined as the warning thresholds in FCW systems [27–29]. Mobileye’s driving assistance products determine the TTC warning threshold as 2.7 s, and the thresholds of the twin-stage warning strategy based on the THW indicator are determined as 2.5 s and 0.6 s, respectively [30]. In addition, the criteria for THW warning thresholds in other countries are presented in Table 2. Based on empirical research, in this work, we preliminary determined the TTCi and THW warning thresholds as 0.2 s-1 and 2.5 s, respectively.
The criteria for THW warning thresholds in other countries
Signal detection theory has been widely used in psychological research to assess the influence of subjective intention on laboratory findings [31, 32]. Psychologists deem human cognition as comprehensive information processing [33]. During experimentation, information that needs to be perceived is indicated as the signal, and the random factors related to the information represent the noise. The process of information recognition by participants is regarded as a process of signal detection and noise elimination. The SDT method can not only evaluate the reorganization ability of subjects, but also reflects the ability of subjects to discriminate between signal and noise [34, 35]. In practice, SDT judgment is a process of statistical decision. As presented in Table 3, there are four possible outcomes of signal detection and noise elimination, namely hit, false positive, false negative, and correct rejection. Hit and correct rejection are defined as outcomes in which the signal or noise is correctly recognized by the subject. A false positive indicates that noise is wrongly judged as a signal by the subject, and a false negative indicates that a signal is improperly identified as noise by the subject.
SDT judgment matrix
SDT judgment matrix
In order to realize the self-adaptation of the warning criterion to different driving characteristics, in this study, the braking behaviour and non-braking behaviour originating from drivers are respectively regarded as the objective signal and the noise. The subjective signal and noise derived from the FCW criterion represent warning and no warning, respectively. The FCW judgment matrix based on the SDT judgment matrix is displayed in Table 4. Like the SDT judgment matrix, a false positive indicates that the driver does not implement a braking operation, but the system emits a warning. A false negative indicates that the driver implements a braking operation, but the system produces no warning. The other two outcomes indicate that the system warning criterion conforms to the safety cognition of the driver.
The forward collision warning judgment matrix based on the SDT judgment matrix
In order to realize the self-adaptation of the warning criterion to different driving characteristics, in this study, the braking behaviour and non-braking behaviour originating from drivers are respectively regarded as the objective signal and the noise. The subjective signal and noise derived from the FCW criterion represent warning and no warning, respectively. The FCW judgment matrix based on the SDT judgment matrix is displayed in Table 4. Like the SDT judgment matrix, a false positive indicates that the driver does not implement a braking operation, but the system emits a warning. A false negative indicates that the driver implements a braking operation, but the system produces no warning. The other two outcomes indicate that the system warning criterion conforms to the safety cognition of the driver.
The accuracy P
a
, the false positive rate P
p
, and the false negative rate P
n
of the FCW system are defined as:
The false positive rate P p and the false negative rate P n are closely related to the individual’s driving characteristics. The higher the false positive rate, the greater the proportion of incidents which occurred when the driver did not implement a braking operation with a system warning, which indicates that the warning threshold in the FCW system is more conservative than the driver’s safety cognition. Similarly, the higher the false negative rate, the greater the proportion of incidents which occurred when the driver implemented a braking operation with no system warning, which indicates that the driver possesses a conservative driving characteristic, and the warning threshold should be raised. In addition, the accuracy P a describes the matching degree between the warning threshold and the individual driving characteristics.
In order to adapt to different drivers, the warning judgment from the FCW system should match the driving characteristics as much as possible. Therefore, the warning threshold needs to be self-optimizing in real-time based on the individual’s driving characteristics. The flow chart of the self-learning algorithm of the driver’s driving characteristics is depicted in Fig. 1. The self-learning process can be regarded as a continuous threshold amendment process. During the learning stage, the two relative indicators, THW and TTCi, were recorded and the driving characteristics were captured based on the SDT method. Each car-following behaviour containing a braking operation and a non-braking operation was supplemented to the proposed dataset, and the values of P a , P p , and P n were respectively calculated according to Equations (4)–(6) after each operation. The optimal warning threshold was determined based on the analysis of the values of P a , P p , and P n . The determined warning threshold was then employed to judge the manifestation of the next behaviour sample according to Table 3. The detailed steps are explained below.
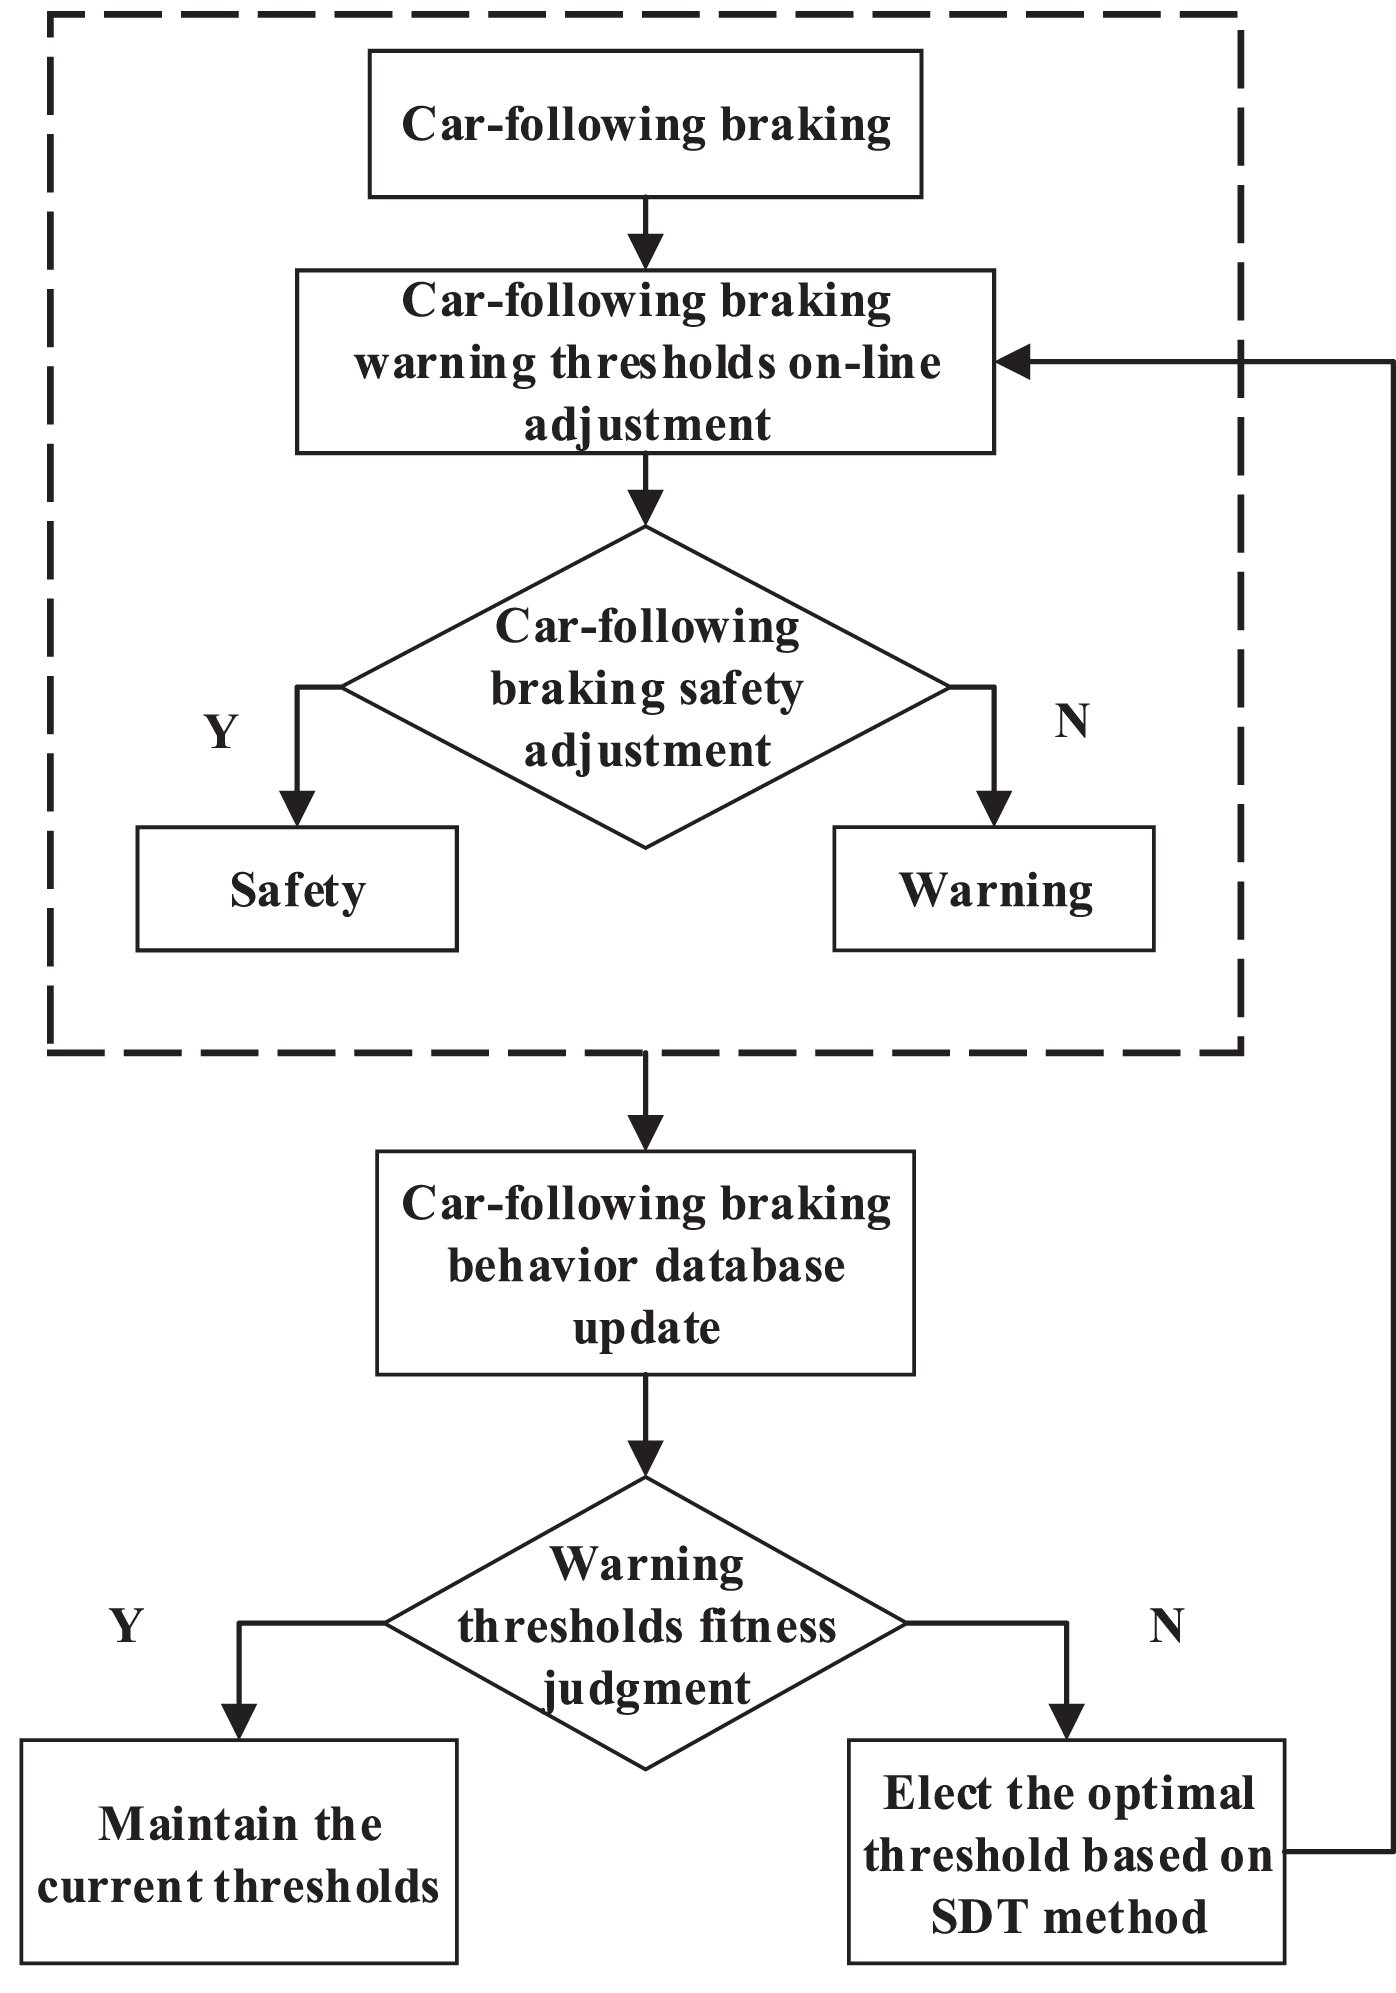
Flow chart of the self-learning algorithm of the driver’s car-following braking characteristics.
Construction and update of the driving characteristics database. The database was employed to provide the information required for the self-learning algorithm, and the relative parameters recorded by the system included the THW value, the TTCi value, the speed of the subject vehicle, the braking deceleration, the driving behaviour (braking operation or non-braking operation), and the FCW warning signals. The original database pre-stored 500 data points derived from naturalistic driving experiments in our previous study. The accuracy P a corresponding to the primary warning thresholds discussed in subsection 2.1 reached 75% for the original database. During the learning stage, each new driving behaviour data point was supplemented to the original dataset for the calculation of P a , P p , and P n . After each calculation, the original data point that had the largest error with regard to the optimal threshold was overwritten by the new data that belonged to the individual. When the accuracy first reached 85%, the previous data would not be substituted by the recent data.
Calculation of the optimal value of warning threshold based on TTCi indicator. Based on the SDT method, the adjustment range of the TTCi threshold was determined as [-0.6 s-1, 0.5 s-1] and the selection step of the TTCi threshold was selected as 0.05 s-1. The values of P a , P p , and P n were calculated for different TTC thresholds according to Equations (4)–(6), respectively. The threshold with the highest accuracy and relatively low false negative and false positive rates was selected as the optimal warning threshold.
Calculation of the optimal value of warning threshold based on THW indicator. Based on the SDT method, we determined the adjustment range of the THW threshold as [0.5 s, 5 s] and the selection step of the THW threshold as 0.05 s. The values of P a , P p , and P n were calculated for different TTC thresholds according to Equations (4)–(6), respectively. The threshold with the highest accuracy and relatively low false negative and false positive rates was selected as the optimal warning threshold.
Currently, the exploitation and verification of self-learning algorithms of driving characteristics for FCW systems are basically implemented using a driving simulator, whereas verification results derived from actual vehicle tests are sparse. However, there is a distinct difference between an individual’s driving characteristics in a driving simulator and under practical driving conditions. In addition, the difference in the hardware also affects the verification results of the adaptive algorithm. Therefore, in this study, a data acquisition system and an embedded system in an actual vehicle was established to collect the parameters and execute the self-learning algorithm during the vehicle experiments.
Participants and test route
Two experienced drivers were recruited to participate in the experiments. The two male drivers were of similar age (33 and 35 years old) and possessed similar driving experience (6 and 7 years). The participants were physically healthy, and neither had been involved in a severe traffic accident in the past five years. Before the experiments, the participants were provided an opportunity to perform some trips to become familiar with the test vehicle. In order to obtain as many lane changes as possible, a fully closed, two-way, 4-lane expressway in Xi’an, Shaanxi, China was selected to perform the experiments. Due to the heavy traffic and the limited number of lanes, more car-following and braking behaviours were collected than in experiments conducted on a 6-lane expressway. The participants completed 60 tests in total, with an average duration of an hour and a half in the city expressway. We notified the participants that the driving data would only be used to evaluate our algorithm, and would not be used for any other purpose.
Test platform
To accomplish our research objective of a verification test, a data recording system and an embedded system in an ordinary vehicle were developed. The integrated platform and the instrumentation are depicted in Fig. 2. The data collection system included a millimeter-wave radar, video monitoring system, GPS, Mobileye system, controller area network (CAN) bus, inertia gyroscopes system, and industrial computer. The data collection system calculated and stored all the parameters while providing the required parameters for the adaptive algorithm (i.e., the TTCi and THW values). The millimeter-wave radar was used to obtain the relative speed and distance between the subject vehicle and the preceding vehicle. The video monitoring system was used to record the car-following and braking behaviours. The GPS device provided the geographical position and speed of the subject vehicle. The Mobileye system provided the THW value and TTCi value. The CAN bus served as the data transmission channel. The industrial computer was used to store the data obtained from the instruments. The embedded system provided a platform for the execution of the self-learning algorithm; the system was implemented as a C application. The sampling frequency of the data collection system and embedded system was 20 Hz.
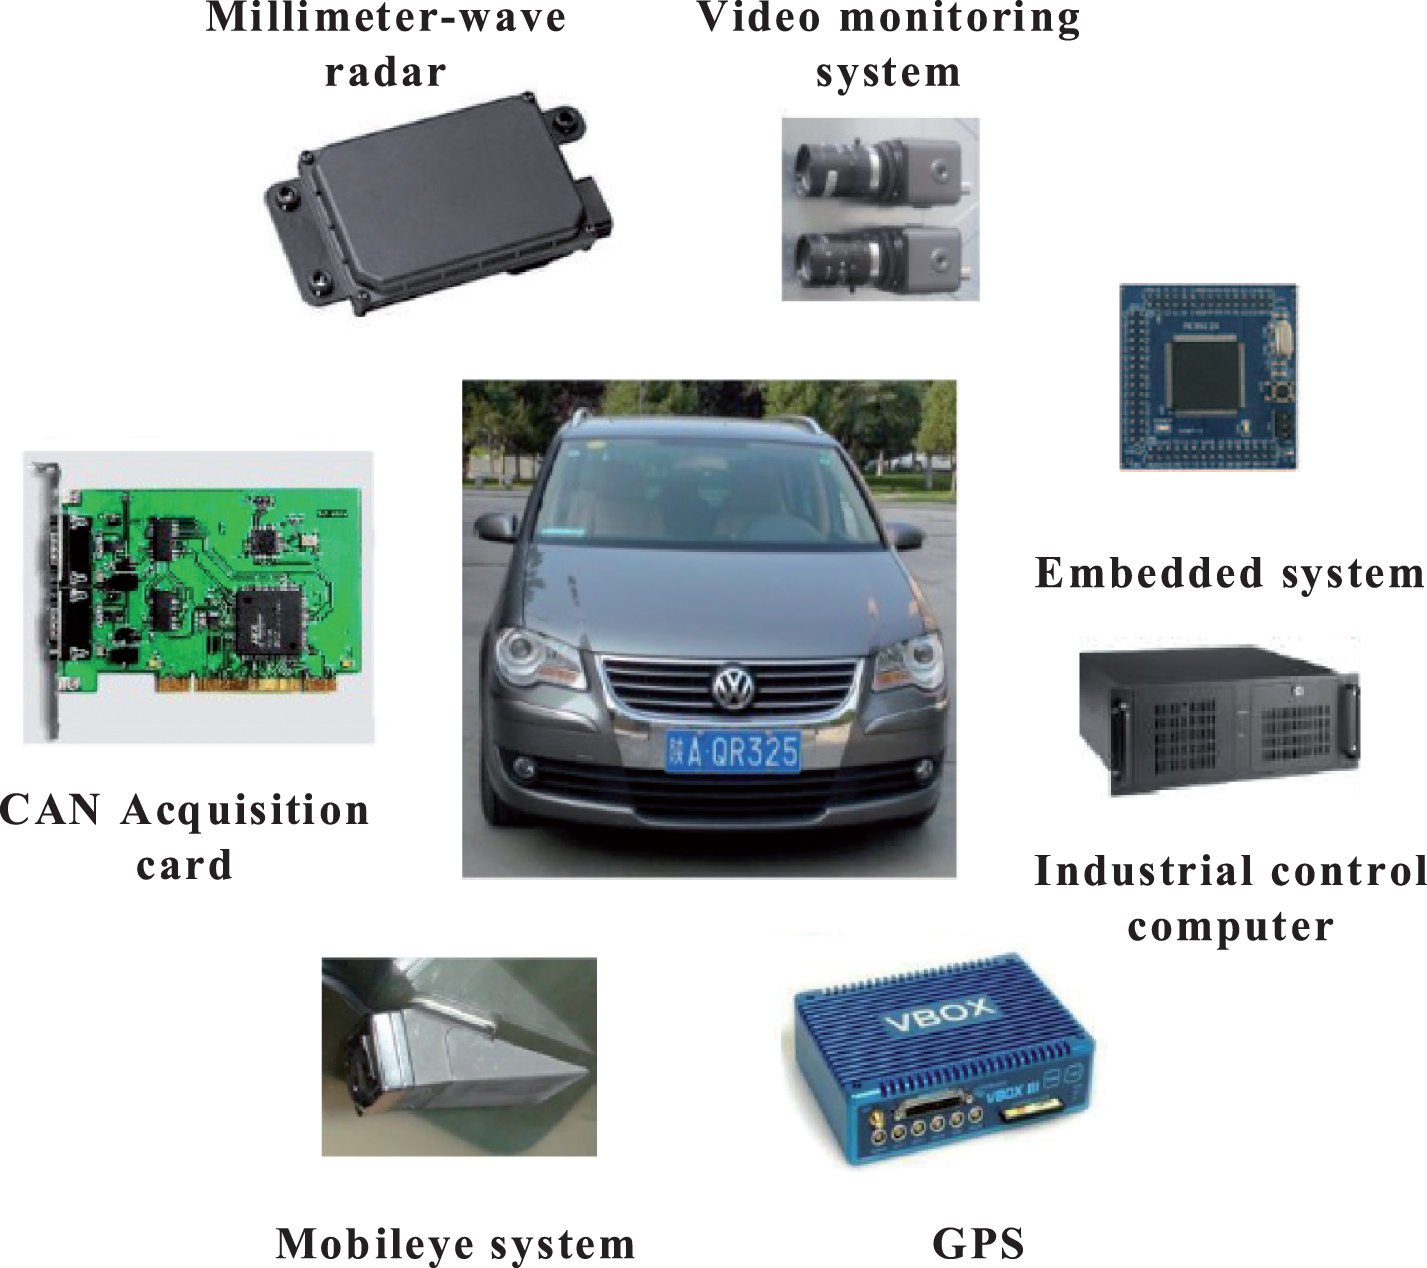
Components of the test platform.
The participants were informed of the destinations at the beginning of each experiment. No other instructions and restrictions were imposed on the participants. They could navigate the test vehicle as they saw fit while obeying traffic laws and ensuring driving safety. The relative parameters of the subject vehicle and target vehicle were continuously stored by the data collection system. A discrete Kalman filter [36, 37] was used to filter the discrete data collected by the sensors. To ensure that the individual’s driving characteristics were captured accurately, we needed to define the car-following braking process in advance. The detailed descriptions are provided below.
The stable car-following process should be sustained for at least 10 s. The distance and relative speed between the subject vehicle and the preceding vehicle were basically stable. The driver had no intention of lane changing.
The complete car-following braking process should include the accelerator pedal aperture holding, accelerator pedal releasing, and brake pedal pressing.
Braking behaviours caused by curves, slopes, traffic lights, and traffic jams were not within the data collection scope.
In addition, the car-following braking behaviour with a system warning was defined as the condition in which the TTC or THW value at the braking moment was consistent with the threshold value in the FCW system; the braking behaviour without a system warning was defined as the condition in which the TTC or THW value at the braking moment was greater than the system-stated warning threshold. Similarly, the non-braking behaviour with a system warning was defined as the condition in which the warning threshold had been reached, but the driver had either not applied the brake or only released the accelerator pedal.
Results and discussions
To ensure that the proposed self-learning algorithm could accurately capture the individual’s driving characteristics, after the actual vehicle experiments, we statistically analyzed the average TTCi and THW values of the participants who had completed car-following braking behaviours. We then compared the offline statistical results with the optimal thresholds derived from the proposed adaptive algorithm based on the SDT method. The results of the comparison indicated that the adaptive warning algorithm was capable of capturing the individual’s driving characteristics and could develop an appropriate warning threshold for different drivers.
Offline statistical analysis
After the actual vehicle experiments, we conducted an offline statistical analysis of the characteristic parameters of the car-following braking behaviour according to the videos derived from the video monitoring system. For participant 1 (P1) and participant 2 (P2), the system collected 1249 and 1541 groups of effective car-following braking behaviour, respectively. The distributions of all parameters at the braking moments for the two participants are presented in Tables 5 and 6, respectively. The statistical data of the THW at the braking moment for P1 was larger than the corresponding parameters of P2, and the absolute statistical data of the TTCi for P1 was less than the corresponding parameters of P2, which indicated that P1 had a safer braking strategy and was more conservative than P2 . The distribution diagrams of the THW and TTCi values for the two participants are depicted in Figs. 3 and 4, respectively, and the statistics of the two drivers presented the same changing tendency.
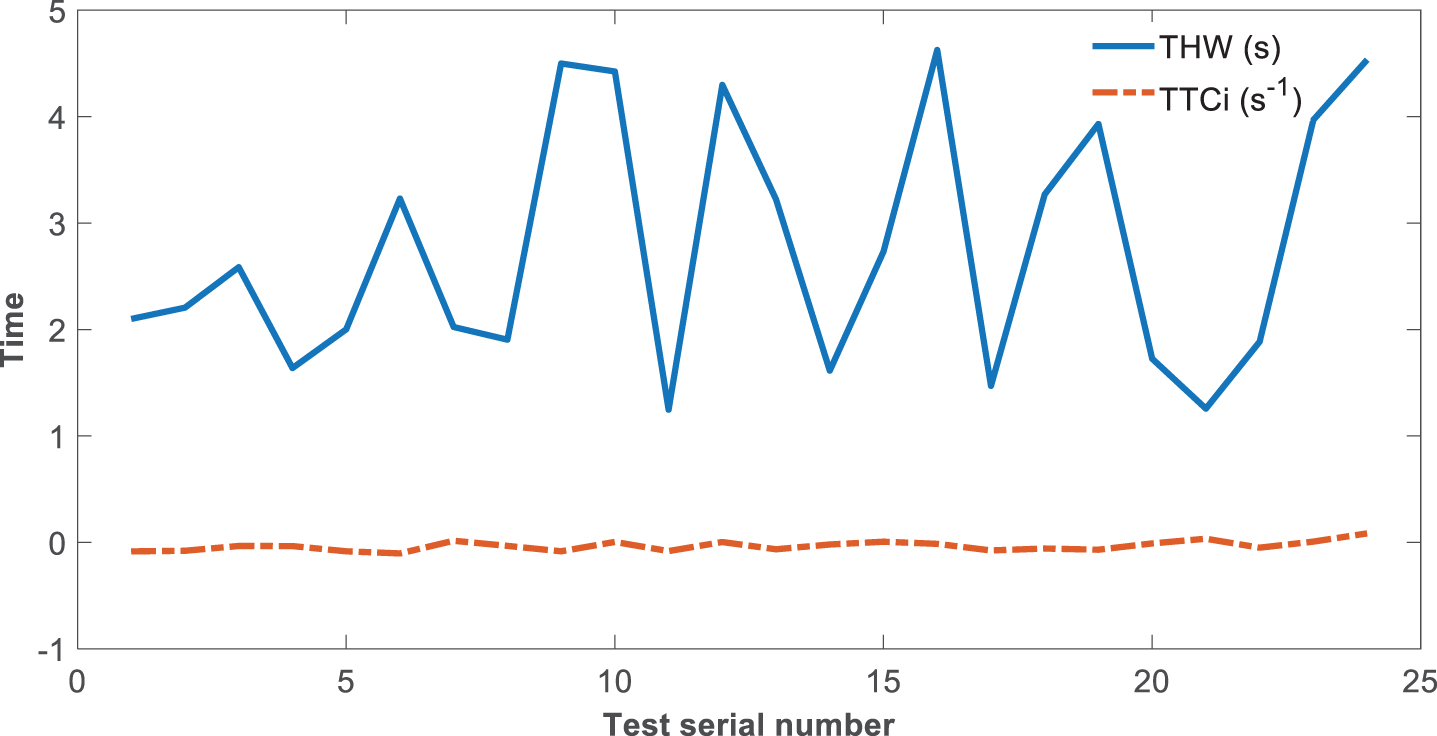
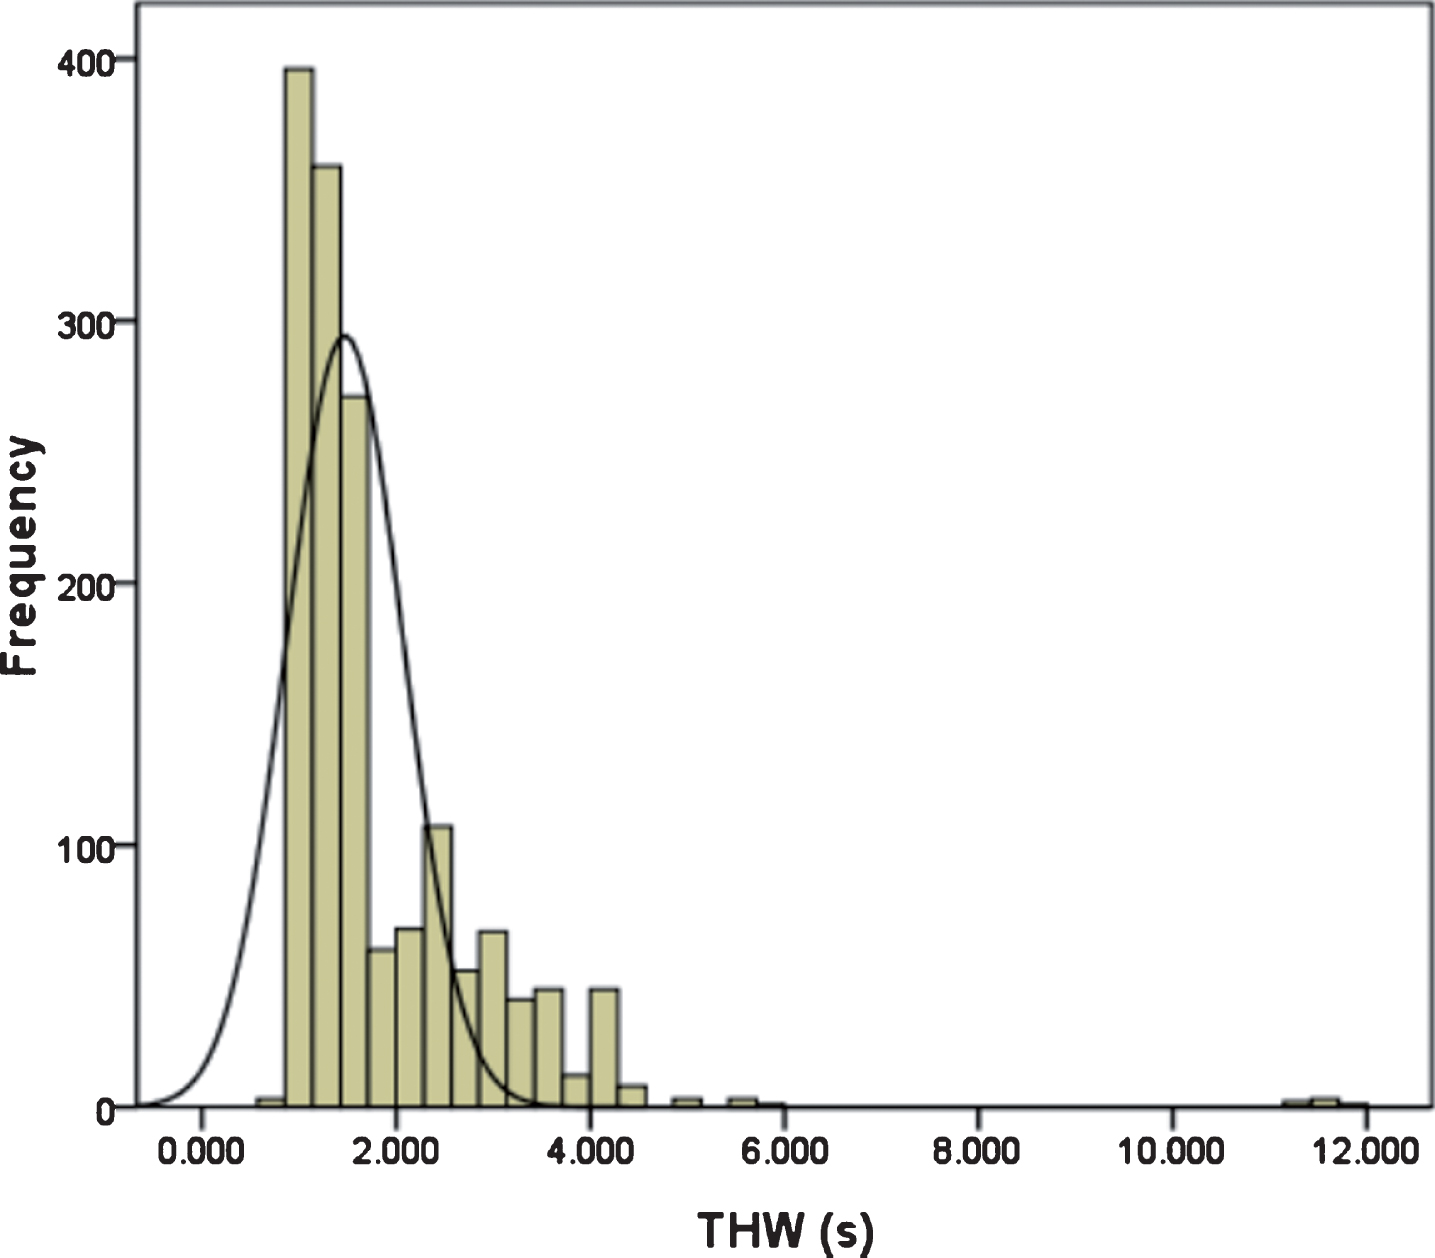
The THW and TTCi values distribution diagram for P1.
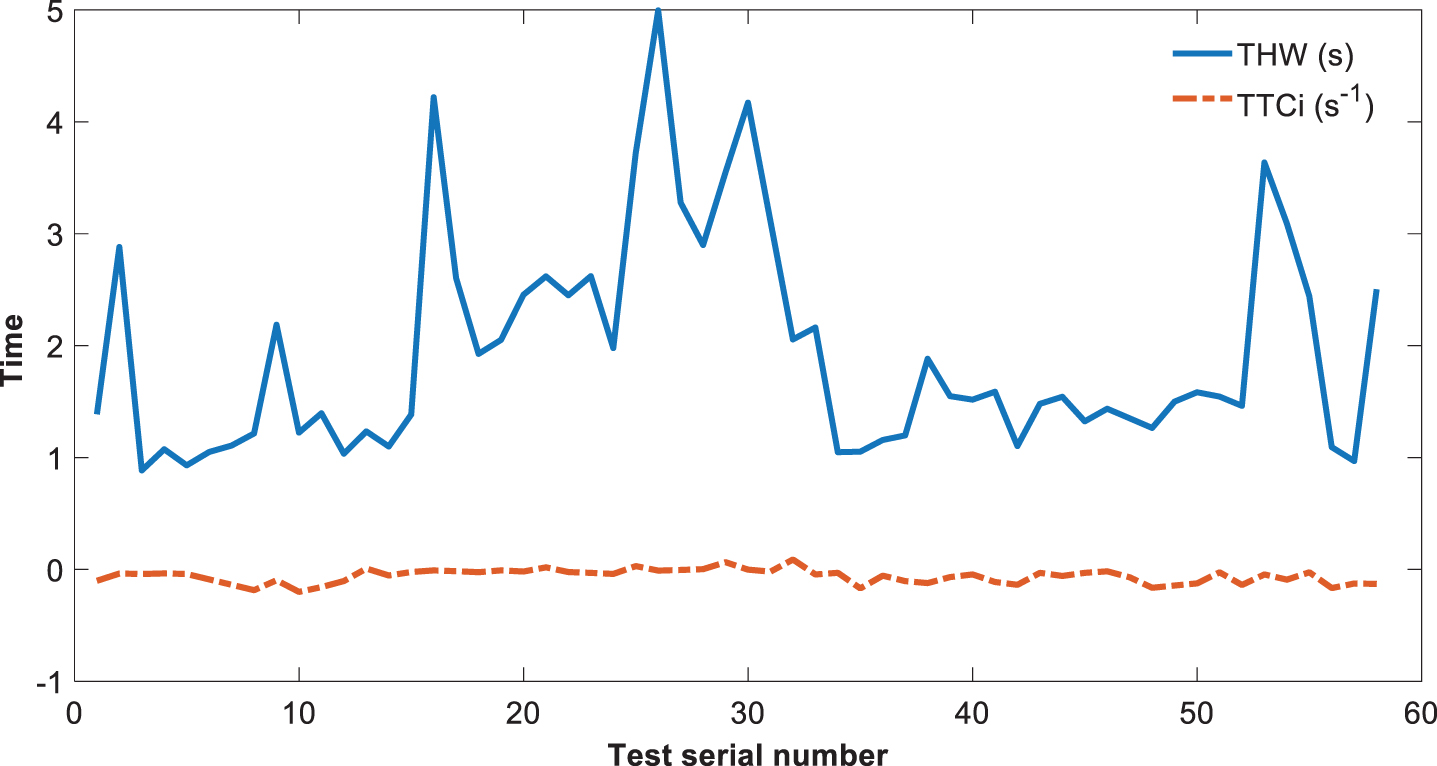
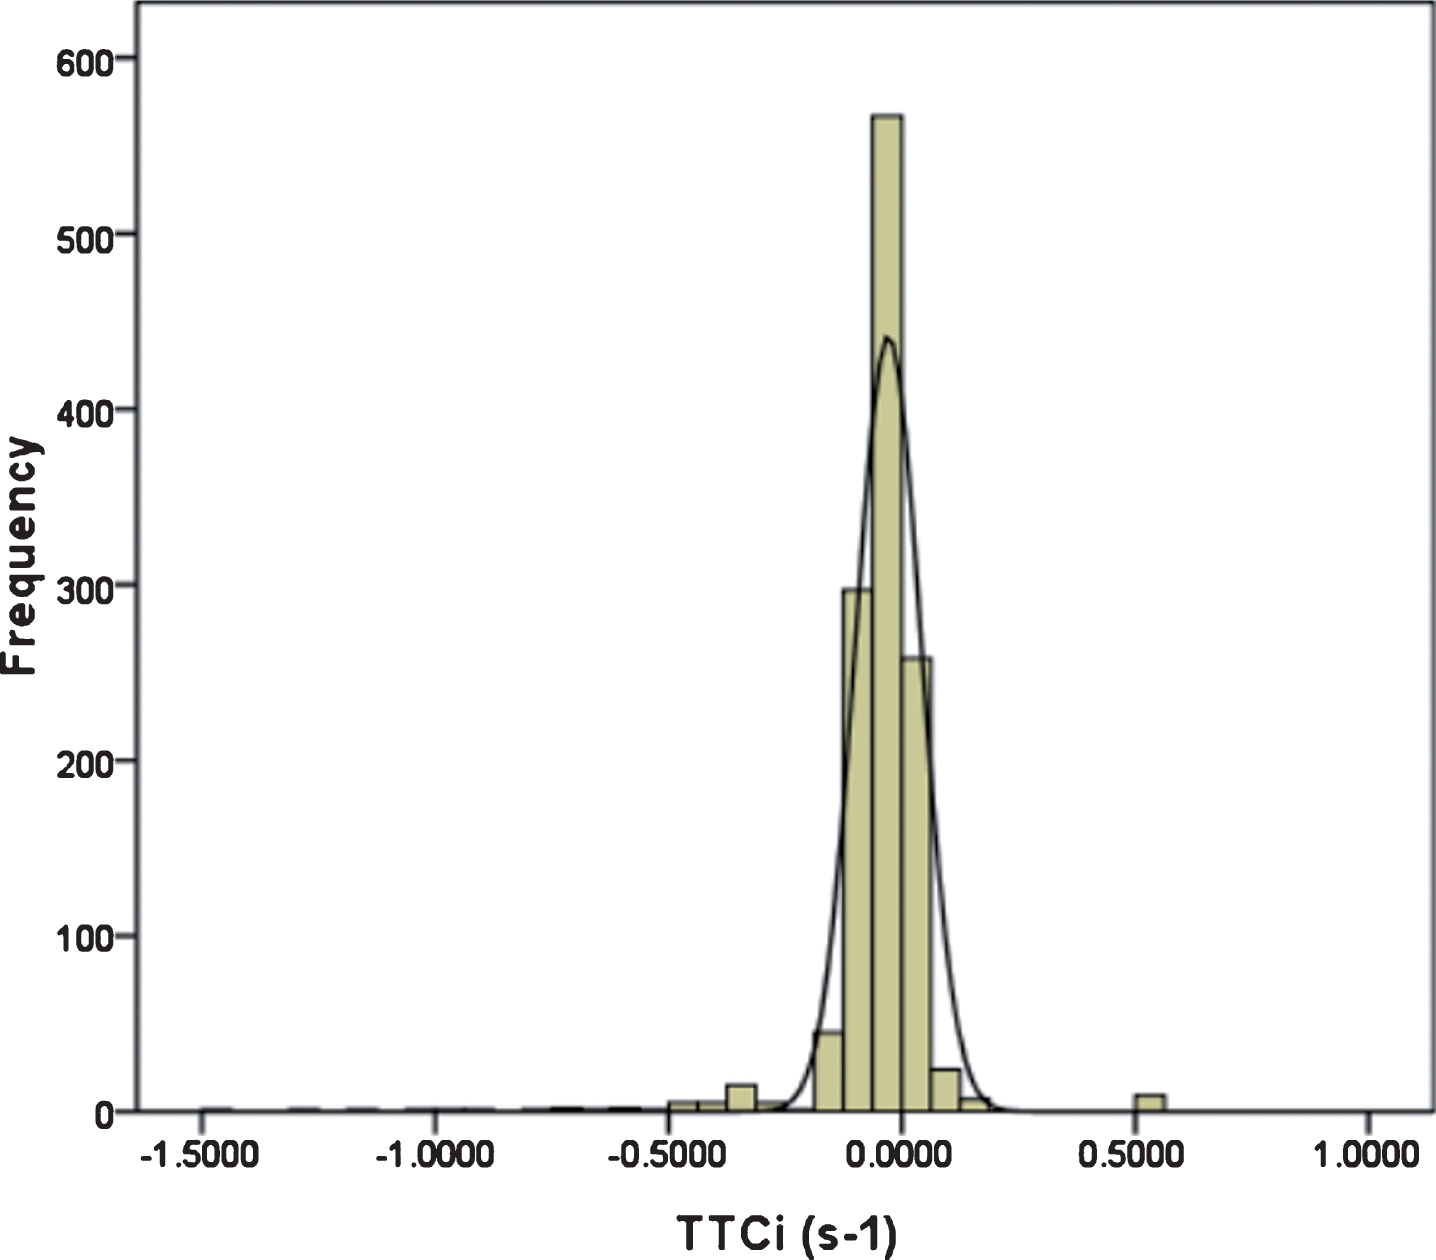
The THW and TTCi values distribution diagram for P2.
The parameters at the braking moment for P1
The parameters at braking moment for P2
The TTCi values fluctuated slightly around zero, while the THW values tended to fluctuate around a fixed value. Because the THW value is related to the subject vehicle speed, the fluctuation degree was obviously higher than the TTCi value. The frequency distribution histograms of the THW and TTCi values for the two participants are shown in Figs. . For P1, the THW values mostly fluctuated around 3.02 s, while the TTCi values mostly fluctuated around -0.047 s-1. For P2, the THW values mostly fluctuated around 1.82 s, while the TTCi values mostly fluctuated around -0.07 s-1. The percentile statistics of the THW and TTCi values for the two participants are presented in Fig. 9. Through the comprehensive statistical analysis of the two indicators, we concluded that the THW values for P1 constantly fluctuated in the range of [2.92 s, 3.36 s], while the TTCi values slightly fluctuated in the range of [–0.044 s-1, 0.03 s-1]. For P2, the THW values constantly fluctuated in the range of [1.44 s, 1.82 s], while the TTCi values slightly fluctuated in the range of [-0.074 s-1, 0.058 s-1].

The frequency distribution histogram of the THW for P1.
The frequency distribution histogram of the THW for P2.
The frequency distribution histogram of the TTCi for P1.
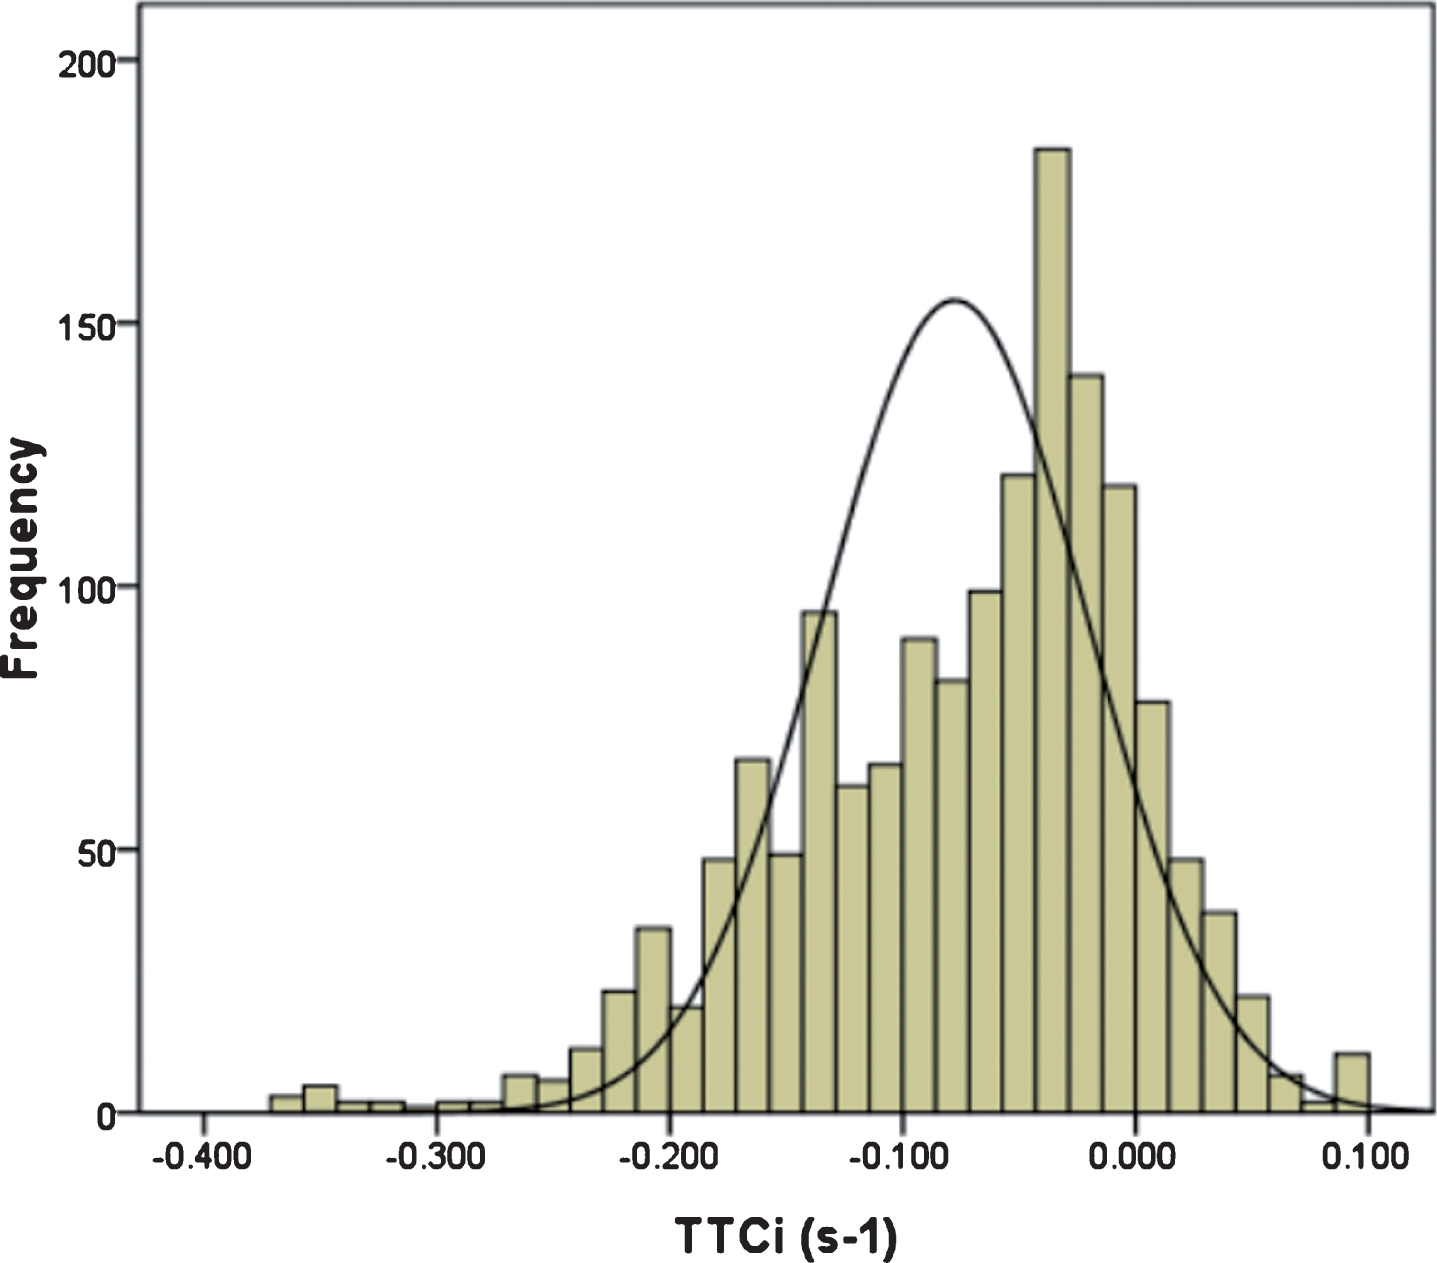
The frequency distribution histogram of the TTCi for P2.
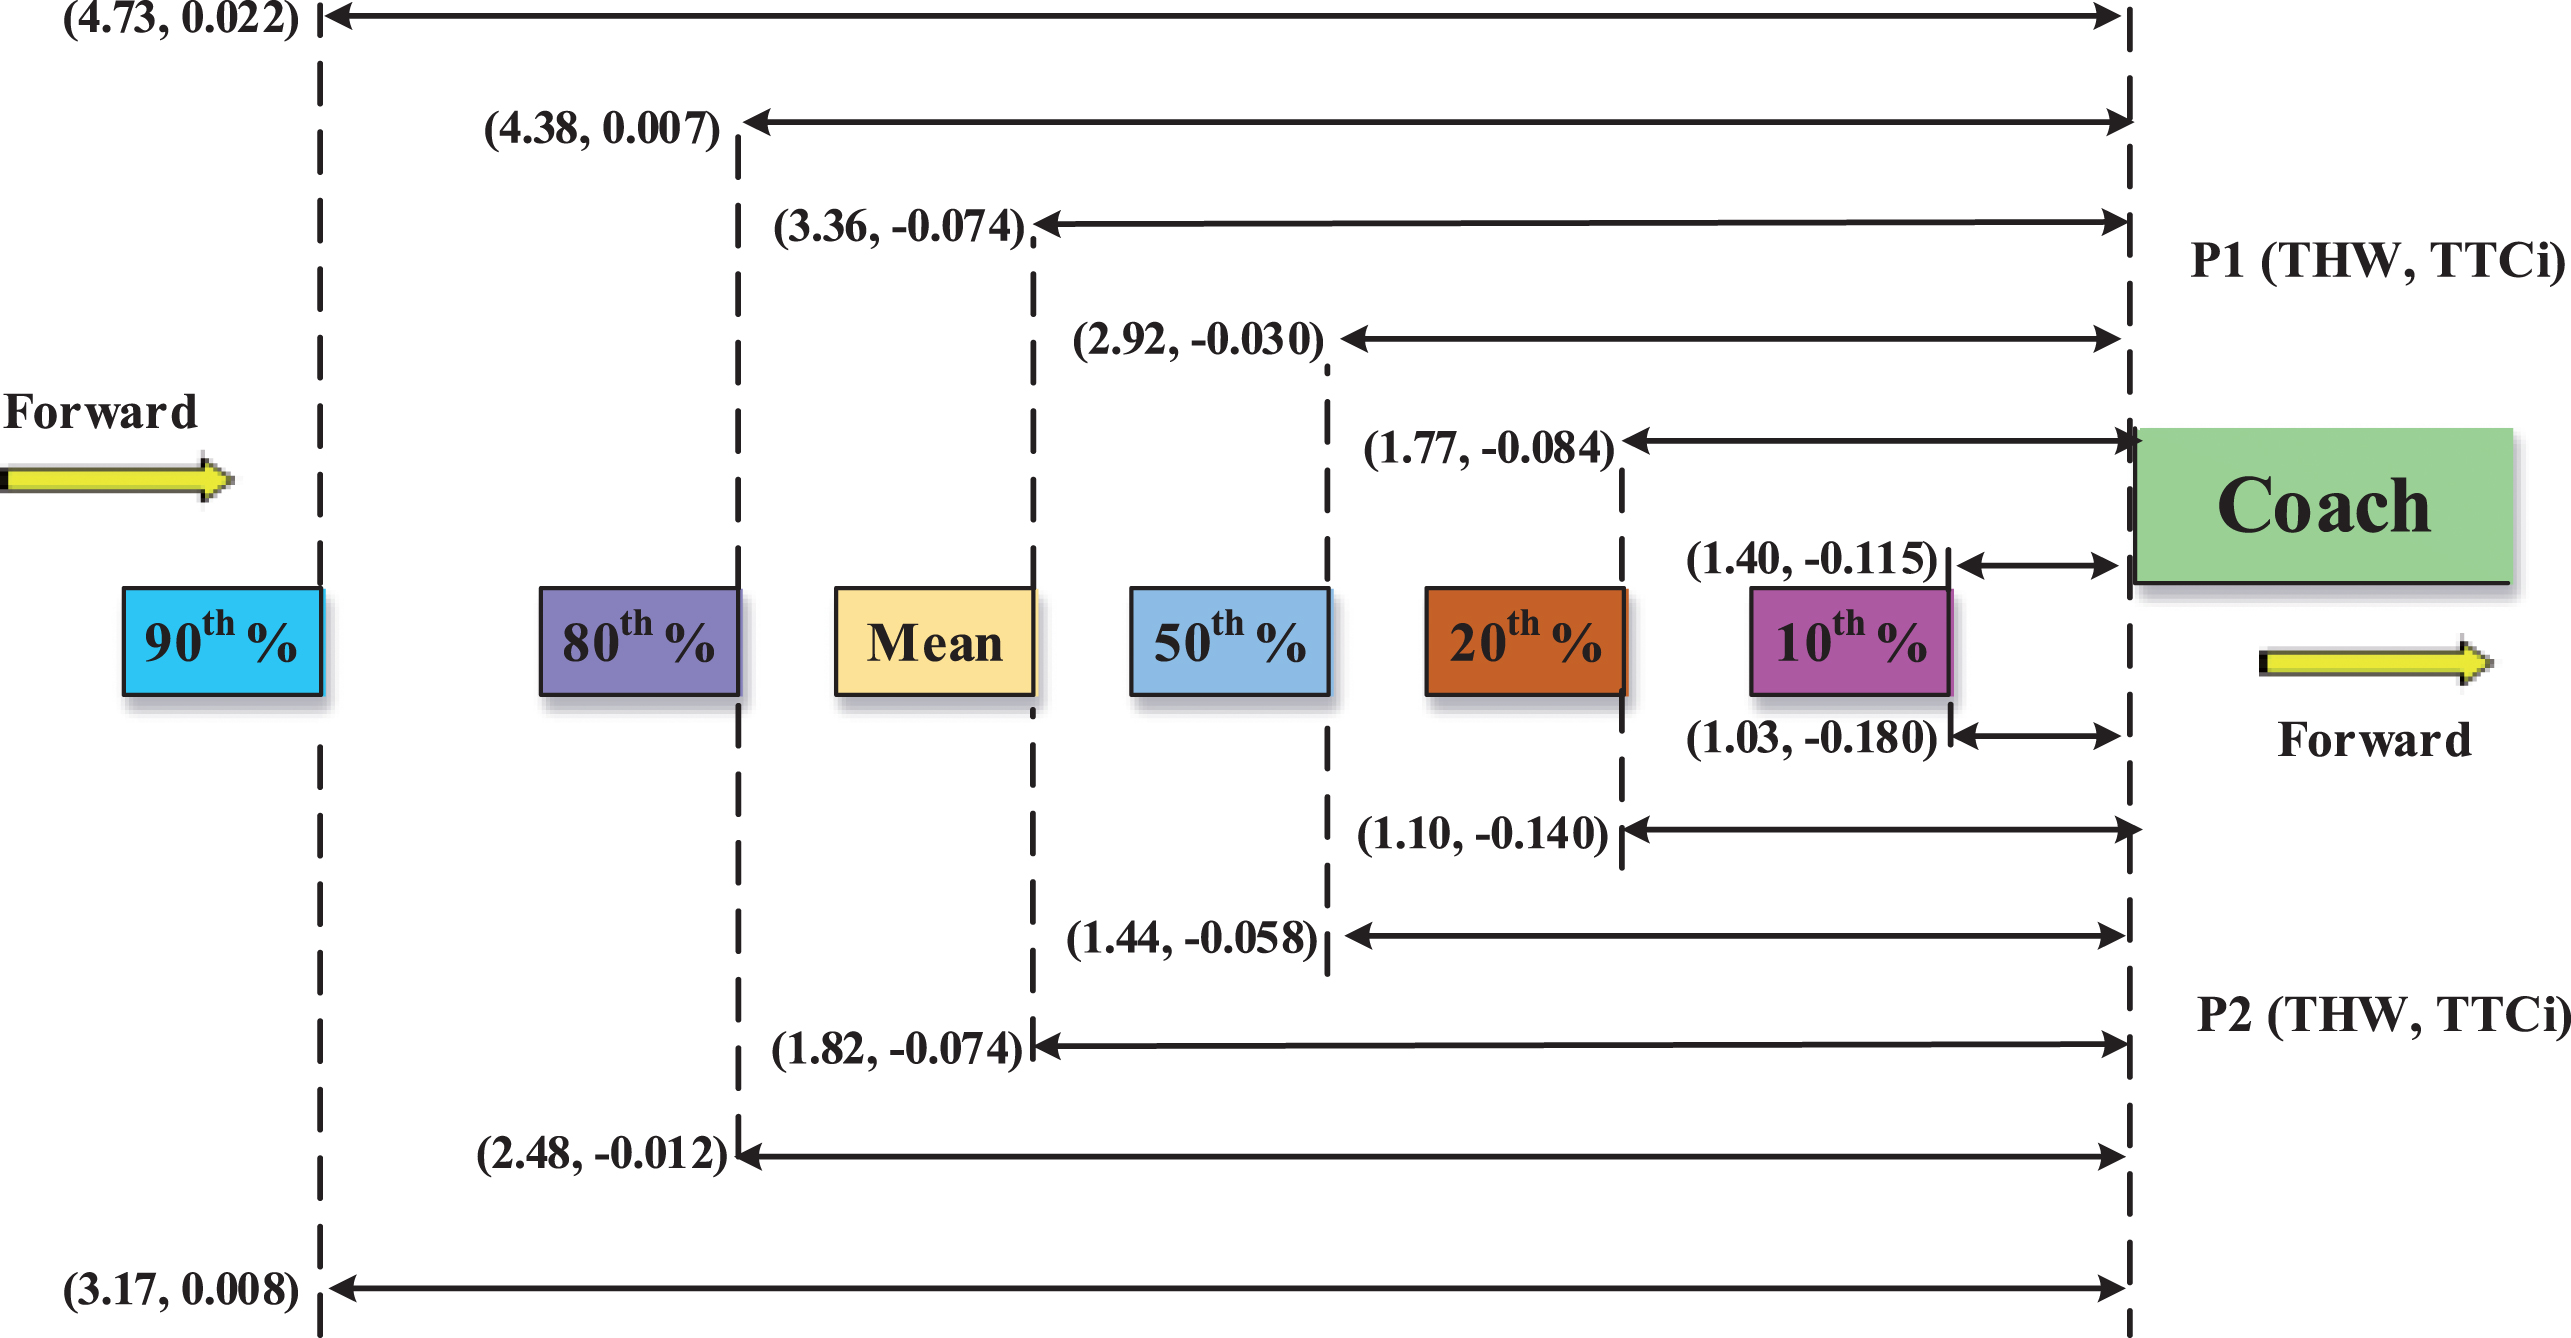
The percentile statistics of the THW and TTCi values for the two participants.
During the learning stage, the adaptive algorithm learned the drivers’ characteristics and selected an appropriate warning threshold based on the results of P a , P p , and P n . For P1, the values of the warning thresholds after the learning stage were determined as THW = 2.9 s and TTCi = –0.05 s-1. For P2, the optimal warning thresholds were determined as THW = 1.75 s and TTCi = –0.1 s-1. The selected optimal values for the two participants based on the SDT method were located within the fluctuation range of the two indicators derived from the offline statistical analysis results, and the online warning threshold results were very close to the average of the two indicators (shown in Tables 5 and 6), respectively. Similarly, the warning thresholds originating from the proposed self-learning algorithm also lead to the conclusion that P1 possessed a safer braking strategy and was more conservative than P2. The comparison results indicated that the car-following braking characteristics were consistent with the warning thresholds derived from the proposed algorithm, which demonstrated that the proposed algorithm could effectively capture the individual’s driving characteristics to develop an appropriate warning threshold for different drivers.
At the end of the learning stage, the numbers of car-following braking samples for P1 and P2 were 1630 and 2189, respectively. Updates to the sample database presented in Table 4 are shown in Tables 7 and 8, which respectively provide the car-following braking manifestation detection results of the two participants after the learning stage.
The number of car-following braking manifestations for P1
The number of car-following braking manifestations for P1
The number of car-following braking manifestations for P2
The values of P a , P p , and P n with different THW and TTCi thresholds for the two participants were calculated at the moment of termination of the learning stage, and the results are depicted in Figs. . For P1, the value of P p continuously decreased with the increase in the THW threshold value, whereas the value of P n consecutively increased. The value slowly increased as the THW threshold value increased from 0.5 to 2.5 s, and then continuously decreased after the threshold reached 2.9 s. The highest value of P a reached 86.3% at a THW threshold of 2.9 s, and the corresponding values of P p and P n were 9.2%, and 29.0%, respectively. For P2, the trends of P a , P p , and P n were similar to the results of P1, as shown in Fig. 11. The highest value of P a was 86.0% with a THW threshold of 1.75 s, and the corresponding values of P p and P n were 7.1% and 27.1%, respectively. The trends of P a , P p , and P n of the TTCi thresholds were similar to the results of the THW thresholds. For the two participants, the highest values of P a were 78.6% and 75.4% with TTCi thresholds of -0.05 s-1 and -0.1 s-1, respectively. The corresponding values of P p and P n were 11.4%, and 25.9% for P1, and 8.6% and 31.4% for P2, respectively.
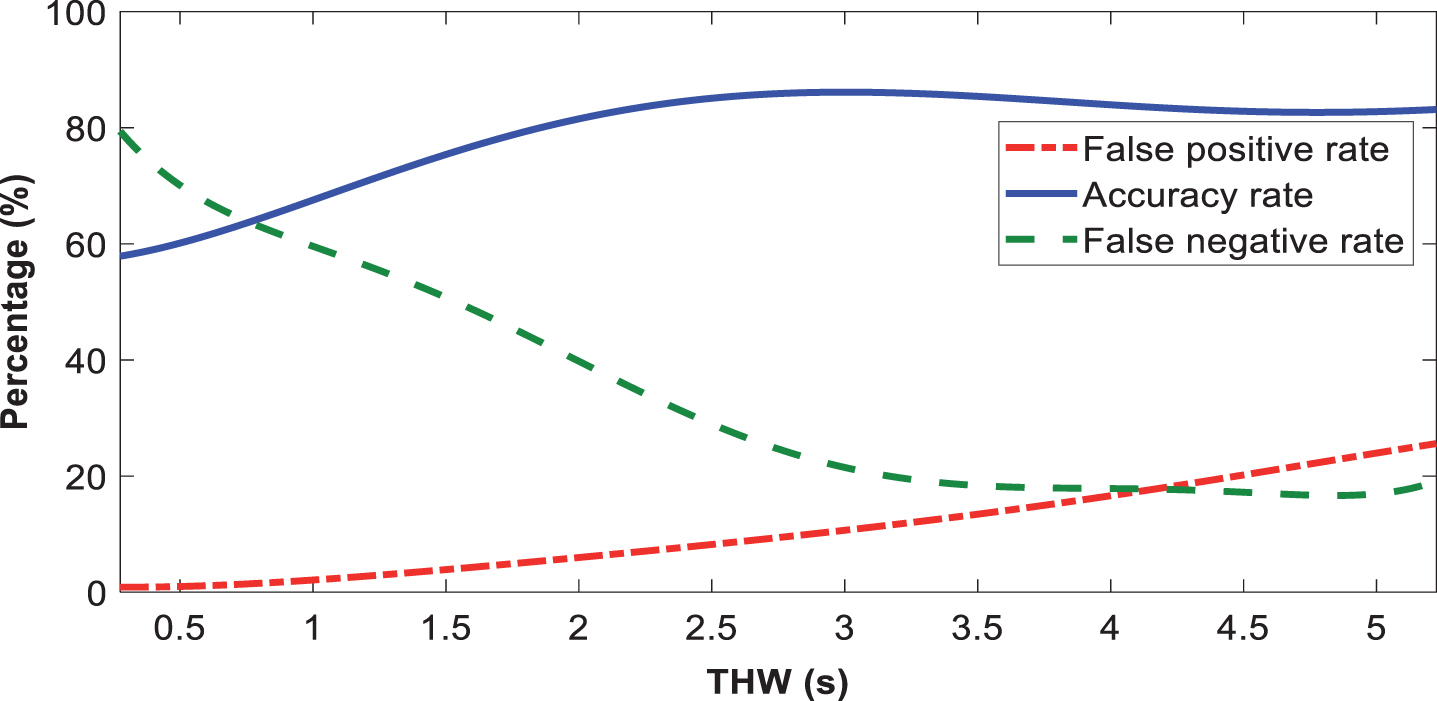
The values of P a , P p , and P n with different THW thresholds for P1.
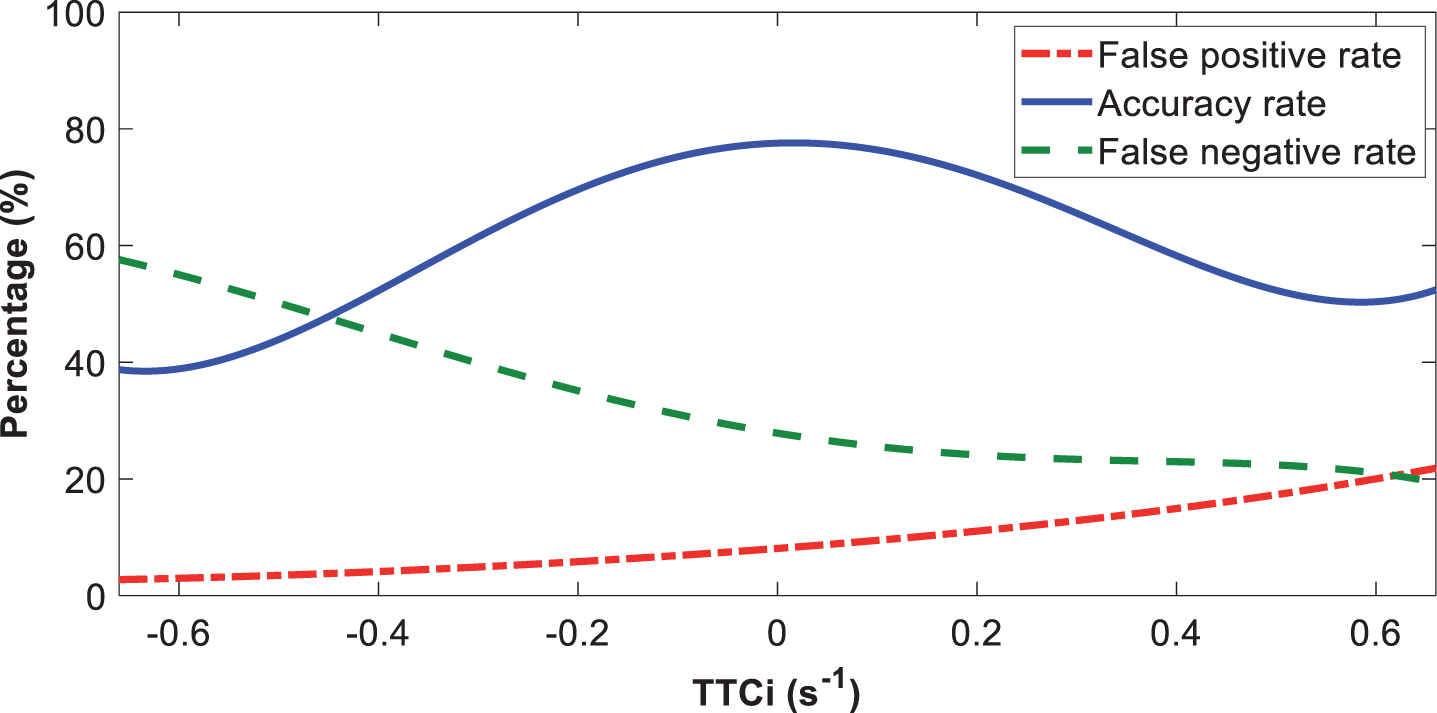
The values of P a , P p , and P n with different TTCi thresholds for P1.
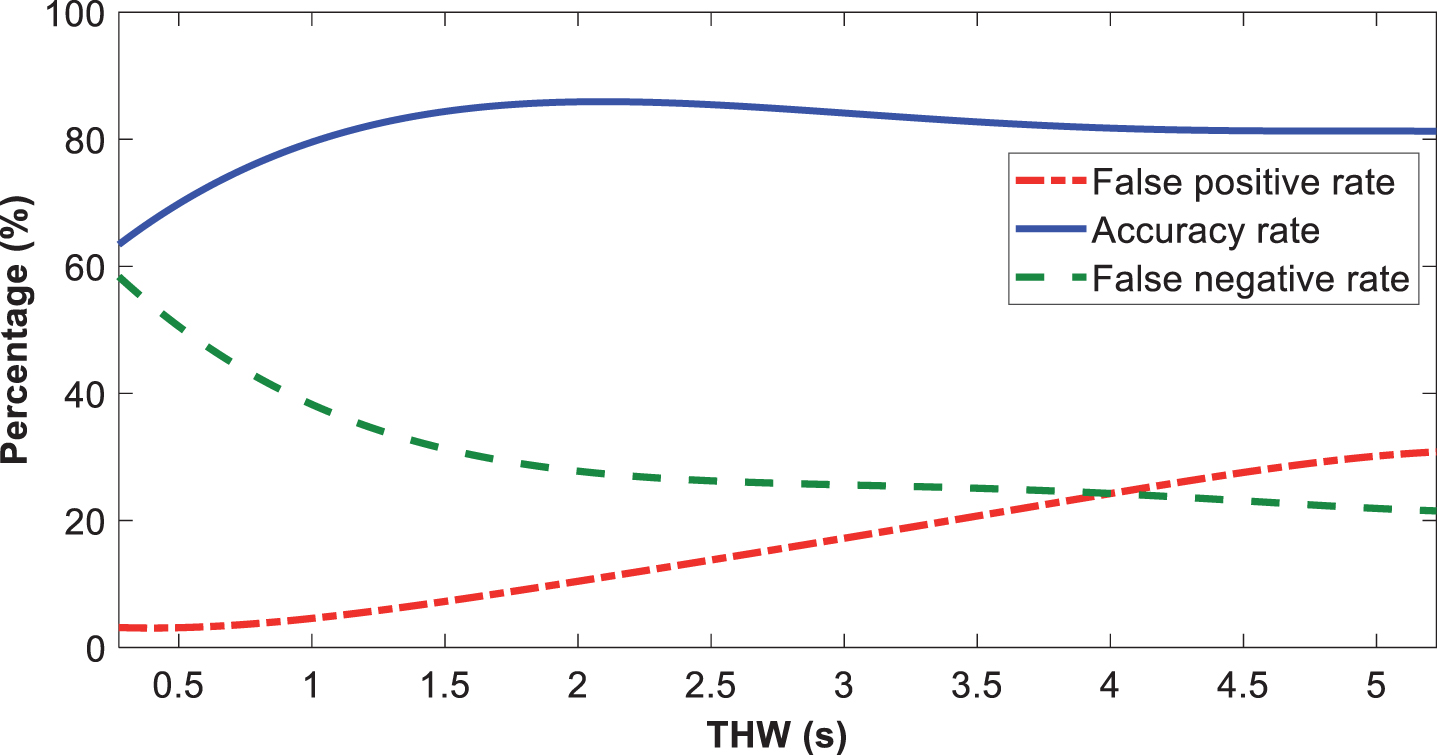
The values of P a , P p , and P n with different THW thresholds for P2.
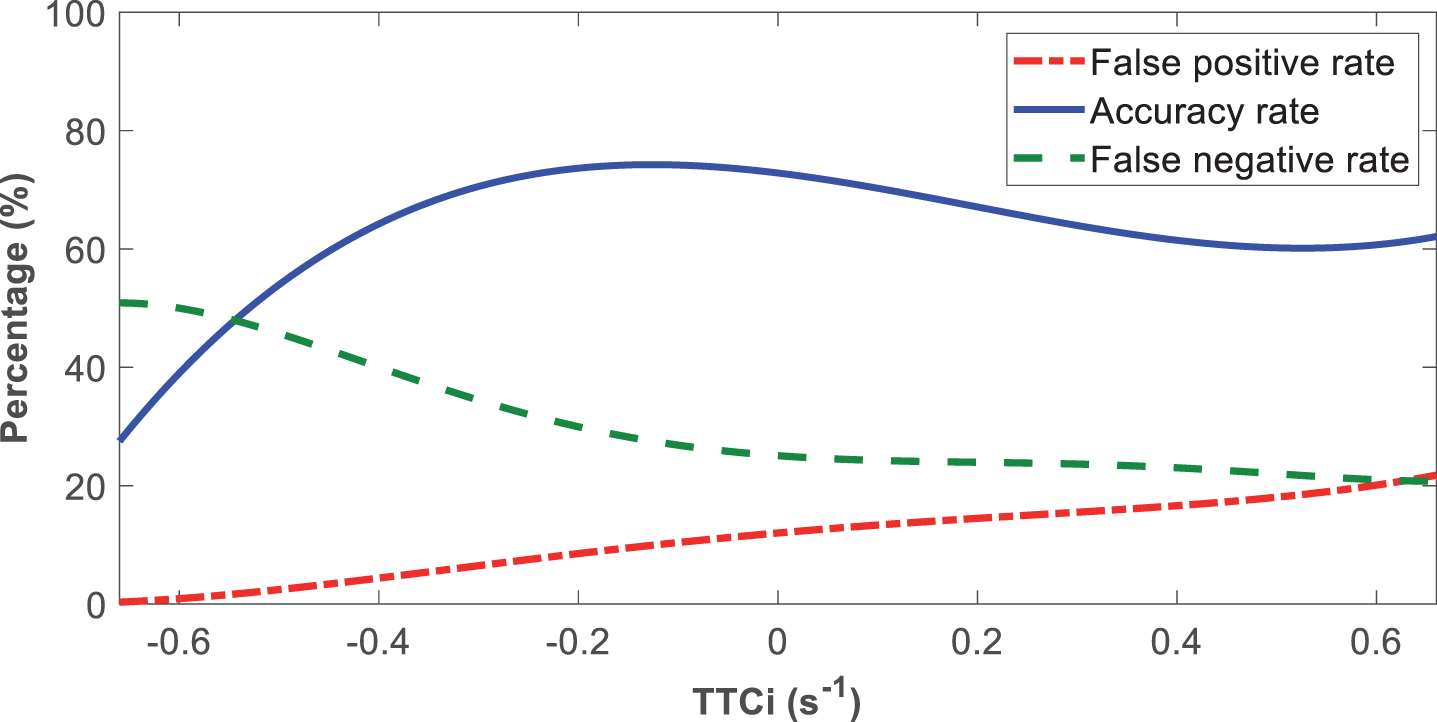
The values of P a , P p , and P n with different TTCi thresholds for P2.
The self-learning algorithm for determining individual driving characteristics will improve the acceptance of intelligent systems and enhance the safety of intelligent vehicles. In this study, an adaptive algorithm for determining the FCW thresholds based on drivers’ car-following braking characteristics was established, and real vehicle tests with two participants were performed to verify the efficiency and accuracy of the proposed algorithm. Based on the analysis of existing warning criteria, the THW and TTCi were used as the warning indicators, and the initial warning thresholds according to the experiential research were selected for the adaptive algorithm. In order to promptly and accurately capture the drivers’ car-following braking characteristics, the SDT method was employed to determine the optimal warning threshold and implement an online adjustment of the warning threshold according to the results of the accuracy, false negative rate, and false positive rate. The offline results of the car-following braking characteristics were consistent with the warning thresholds derived from the proposed algorithm, which demonstrated the validity of the adaptive algorithm for learning the drivers’ car-following characteristics.
Footnotes
Acknowledgments
Authors are thankful to the Editor-in-Chief, the Associate Editor and the anonymous reviewers for all of their valuable comments which helped them a lot in improving the paper significantly. First author gratefully acknowledges the financial support received in the form of National Key R&D Program of China (Grant: 2018YFB1600500).