
Abstract
Based on HSV gamut space, a visualization system of muscle activity is proposed to study the mapping relationship between hand motion and active areas of upper arm muscle. There is a significant threshold change in the starting and ending points of the active segment in the original EMG signal, and the part that exceeds the threshold TH is the active segment date. Set the window width K and fixed increment Kt of time window to remove redundant data. The sEMG intensity information of each sampling electrode is obtained by calculating MAV in each window, and the simulation experiment is conducted in HSV gamut space. Through the human-computer interaction experiment of the visual system, it is proved that this system can visually display the relationship between different channels in the spatial domain, thus intuitively identify the activity intensity of different muscles in hand motion.
Introduction
The application field of robot has expanded from industrial production to medical rehabilitation, service, military and other fields, and human-computer interaction has gradually become the focus of future development [1]. Rehabilitation equipment and intelligent artificial limbs can make life more convenient for the disabled. In the field of its operation, it is very important to analyze the trajectory of hand movement and study the distribution of force [2]. There are already many human hand structures and independently controlled fingers, but the connection between sEMG and active muscle regions is not considered. The surface electromyography signals that activate the muscle regions visualize the relationship between different myoelectric channels and the activity of different muscles. In the case, the muscle region analysis can be realized during the gesture movement, and the accuracy and practicability of the motion control of the human hand structure can be improved.
Activated muscle area refers to the muscle region that is activated by the nervous system and involved in the corresponding movements during human motion [3]. The sEMG is used to judge the activated muscle region and muscle activity, because sEMG is a kind of bioelectrical signal produced in the process of human muscle activity. It is a comprehensive result of conduction and superposition of different Motor Unit Action Potential (MUAP) in muscle fibers and cell tissues [4, 5].
In this paper, 16-channel myoelectric sleeve is used for active area detection. 16 electrodes are evenly distributed on the muscle surface. One or two electrodes on each muscle surface ensure the accuracy of visualization of activated muscle area. It is expected to solve the following problems. Firstly, the display interface is constructed by combining the activated muscle region partition map [28], and then the muscle strength information of each sampling electrode is obtained by processing sEMG. Secondly, the processed data are expressed in color, and the muscle activity can be distinguished by different colors. Thirdly, the visual interface is used to observe whether the active areas of different gestures have changed and whether the intensity of muscle activity has changed under the action of different forces of the same gesture.
Section 2 elaborates the research status at home and abroad. Section 3 introduces the pretreatment process of removing the redundant information of the original sEMG and obtaining effective action signals. Section 4 describes the establishment of the visualization system. Section 5 shows the relationship between different sEMG channels in spatial domain through human-computer interaction experiments and the paper is concluded in section 6.
Related works
On account of lots of muscles in the forearm, the degree of muscle activity varies with different gestures. In 1995, Maier et al. began to explore which muscle or muscle combinations are more suitable for estimating finger strength more accurately [6]. Choia et al. used artificial neural network (ANN) to collect sEMG from six muscles (ED, APL, FDS, APB, AP) and estimate the force [7]. When evaluating the relationship between a finger’s reaction force and an electromyogram, there is a difference between electromyogram and finger force because the external force does not reach the muscle load [8].
There are five main muscles that control wrist movement. They are Extensor Carpi Radialis Brevis (ECRB), Extensor Carpi Radialis (ECR), Extensor Carpi Ulnaris (ECU), and Flexors Carpi Radialis (FCR) and Flexor Carpi Ulnaris (FCU). The ECRB, ECRL and ECU are responsible for stretching the wrist, while the FCR and FCU are responsible for the bending of the wrist. At the same time, four of the muscles are also responsible for wrist abduction (ECRB, ECRL) and adduction (ECU, FCU). There is a special muscle in the upper arm of the human body, Palmaris Longus (PL), which functions to control the curvature of the palm in the wrist. It is one of the most varied muscles in the human body, according to the statistical population of 10%. People don’t have this muscle. The two hand movements of the palm upturn and the palm flip down are determined by the Pronator Quadratus (PQ) and the Pronator Teres (PT) muscles. The PQ and PT functions are to rotate the arm inward, such as turning the hand. When the palm is facing down, and assisting the biceps rotating the forearm laterally. In addition to forearm rotation and wrist movement, the function of the other muscles is to control five fingers. Flexor Digitorum profundus (FDP), Extensor digitorum index (EDI) and Extensor index (EI) control the flexion and extension of the index finger. Similarly, the flexion and extension of the middle and ring finger is also performed by the flexor digitorum profundus (FDP), the flexor digitorum superficialis (FDS) and the extensor digitorum (ED). Flexor Digitorum Profundus (FDP), Extensor Digitorum (ED), Flexor Digitorum Superficialis (FDS), and Extensor Index (EI) control the flexion and extension of the index finger, middle finger and ring finger. There are two special extensors, Extensor Digitorum Minimus (EDM) and Flexor Digitorum Brevis (FDB) of the little finger in the palm of the hand for the straightening and bending of the little finger. In addition, the Brachioradialis controls the bending and extension of the forearm [11].
The establishment of a visualization system plays a crucial role in the judgment of muscle activity intensity. Surface EMG is usually visible in amplitude mode, which can show the change of sEMG amplitude in time-domain space [9, 10]. Although sEMG in signal amplitude mode highlights the change of signals in time domain, it cannot reflect the spatial relationship between different sEMG channels [12]. However, in a multi-channel sEMG system, especially when the electrodes are uniformly distributed, the spatial relationship of sEMG in different channels plays a crucial role [13]. In recent years, the visualization of EMG has been widely used in spatial areas to observe the changes of sEMG in a manner consistent with the distribution of electrodes [14]. In addition, the visualization of sEMG directly links sEMG with muscle function [15–19]. The visualization of sEMG intuitively shows the relationship between different EMG channels in the spatial domain, so as to identify the activity intensity of different muscles in hand motion [20]. Therefore, through the prior knowledge of the relationship between muscle and electrodes, the visual image of sEMG is used to identify the more active muscles in the process of hand motion [21, 22].
The visualization of sEMG view can show which electrodes have experienced strong sEMG activities in different detection positions. These results can be visually reflected in the graph, and used to determine whether each subject has produced muscle activation pattern when completing different action tasks [23]. SOM analysis offers a reverse engineering method for complex neuromuscular systems, which can describe postural synergies [24]. Gumpy can be used for sEMG biosignal analysis, visualization, real-time streaming and decoding, and it is widely used in off-line examples [25]. The visualization of sEMG can also assist the extraction of EMG features [26]. The visualization of sEMG view under the same hand motion has many similar features with the feature pattern used for hand motion recognition [27].
Forearm muscles can be divided into different functional groups to control different hand joints. The forearm muscles primarily control wrist movements, finger movements, and forearm rotation. The implementation of most of the hand functions is done through the above basic actions [28].
In order to improve the robust of the visualization system, 10 muscles in the forearm muscle were selected as the research object, they are FDP, FCU, FDS, FCR, BRA, ECR, ED, ECU, PL and EDM. The EMG signals of the corresponding muscles are amplified, de-noised and extracted. [29].
Surface EMG preprocessing
Since the sEMG acquisition instrument acquired from the original signal has a good ability to reduce noise and amplify the signal, the signal preprocessing mainly focuses on the detection of active segment and data segmentation [29].
Detection of active segments of sEMG
The date of multi-channel sEMG collected continuously contain muscle contraction signals in the course of action execution, which are generally called active segments, and also include signal segments without muscle contraction,which are generally called inactive segments [30, 31]. For subsequent feature extraction and classification, inactive data are redundant and need to be removed, otherwise it will directly affect the effect of subsequent feature extraction and classification. Active segment detection need to accurately detect the start and end points of action signals. The existing active segment detection algorithms are ubiquitous with high computational cost and the need of the prior knowledge of EMG, which are not conducive to the application of real-time EMG control [30]. Based on the requirement of real-time control algorithm in the later stage, this paper adopts a fast and efficient method of active segment detection, and uses threshold comparison method to discriminate active segment. As shown in Fig. 1, the active and inactive segments can be distinguished by the change of waveform contour of sEMG. There will be obvious threshold changes at the start and the end of the active segment. Therefore, the action state of sEMG can be judged quickly by combining threshold judgement [32].
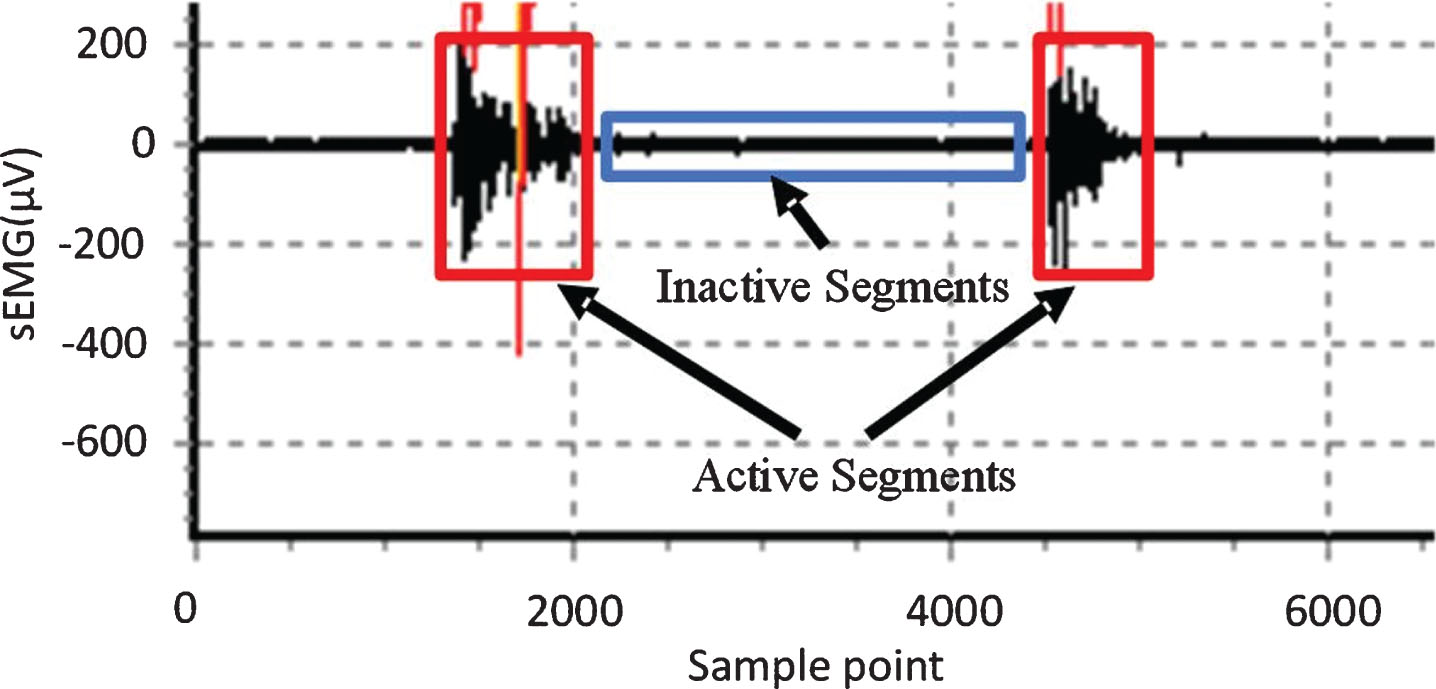
Classification of active and inactive segments of sEMG.
The moving average method with the fastest operation is used to detect the starting and ending points of the moving segments [33, 34]. This method mainly uses the moving average method to deal with the instantaneous signal changes with large fluctuations, then compares it with the selected threshold, finally judges whether it is the signal active segment according to the results of comparison.Compared with other active segment extraction algorithms, the main advantage of this algorithm is that it helps to eliminate the influence of short-term fluctuations on the overall trend of the signal. The formula of this method is shown in Equation (1).
N is the number of sampling points, c is the number of channels, EMG
c
(n) is the value of N sampling points in channel c,
Threshold is mainly based on the actual situation of sEMG, and compares the effect of active segment division through multiple tests. Finally, the threshold TH is set to 15% of the instantaneous energy peak of each sEMG channel. When S (n) exceeds the threshold TH, signal acquisition is carried out on the exceeded part to obtain the active segment data of the data, as shown in Fig. 2.
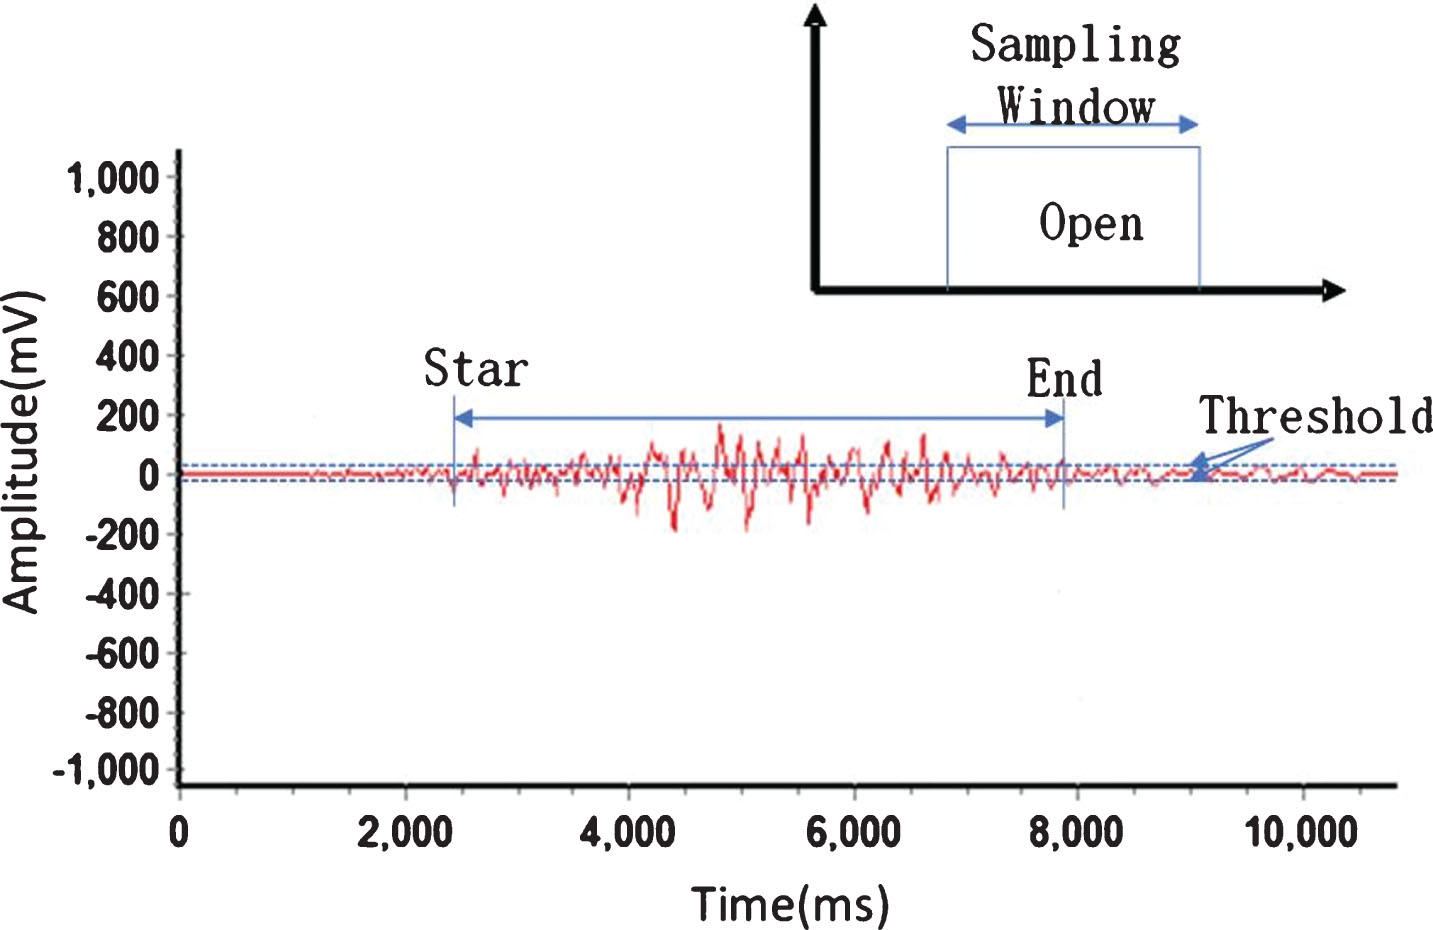
A schematic diagram of date acquisition for sEMG active segment.
In order to extract the characteristic information contained in sEMG and analyze the relationship between the signal and the action [50]. It is necessary to segment the continuous original date after obtaining the amplified and filter original sEMG, that is, data segmentation [35]. There are two commonly used data segmentation methods: overlapping segmentation and non-overlapping segmentation [36]. As shown in Fig. 3, in the non-overlapping segmentation method, there is no overlap between two adjacent windows, and the original data is divided into continuous data segments by a fixed time-length data window of K. The total number of data segments after segmentation is the total length of data divided by the width of the data window. The selection of data window width K is the main factor in non-overlapping segmentation method.
Non-overlapping partition window.
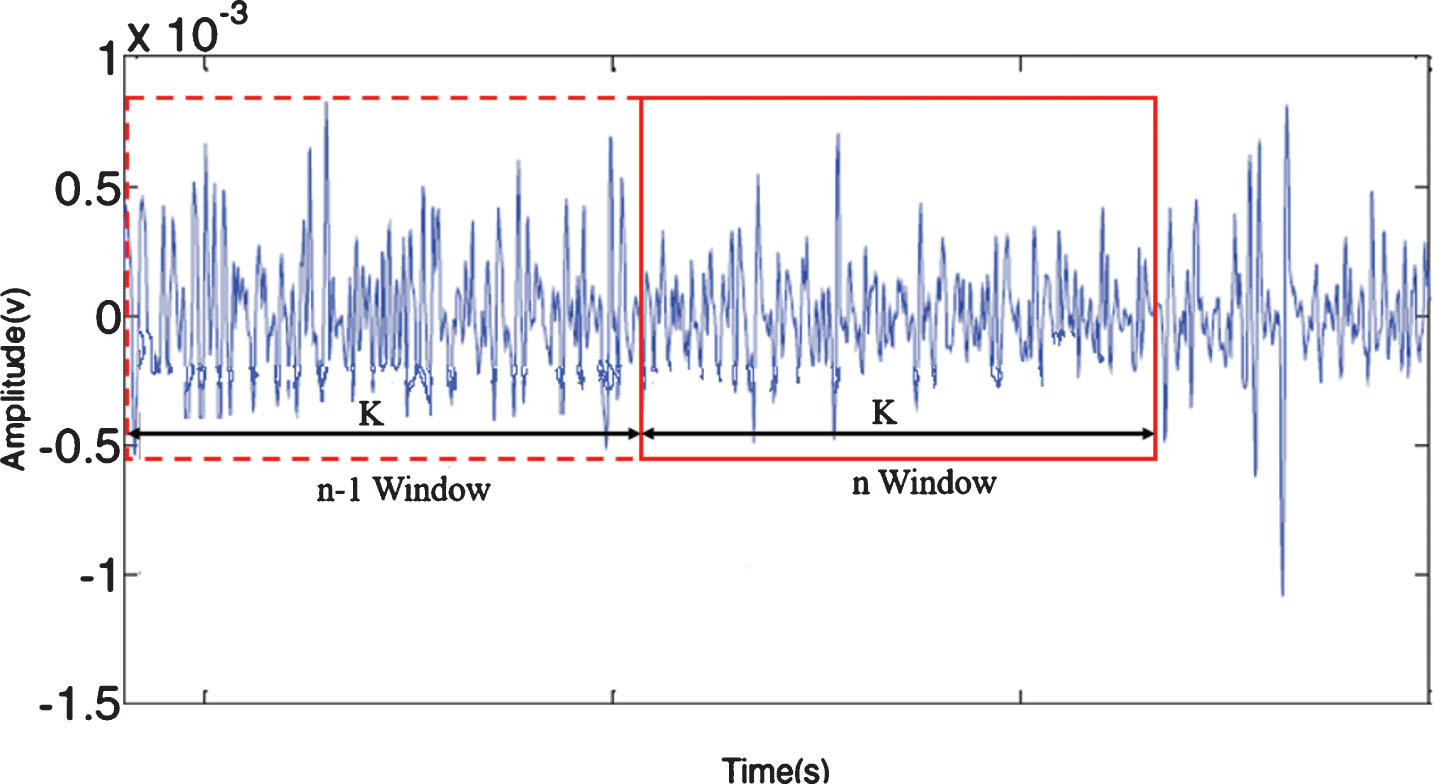
As shown in Fig. 4, in the overlapping segmentation method, there is a part of data overlapped between adjacent data segments segmented by data window. In the process of data segmentation, the new segmentation window will slide a fixed increment Kt smaller than window width K over the time scale, so for the original data of the same length, overlapping segmentation will get more data segments than non-overlapping segmentation with the same window width [37]. The overlapping segmentation can well reflect the characteristics and trends of the original continuous signal flow. More importantly, it can provide more training samples for the subsequent classifier design. This method has good practical application value in data compression, algorithm processing and pattern classification. In view of the above characteristics, this paper chooses to use overlapping segmentation method to segment the sEMG data. In the online application of action pattern recognition, owing to the limitation of back-end data processing capacity, the sliding increment Kt of window in overlapping segmentation method must be greater than the actual data processing algorithm time. Therefore, window width K and sliding increment Kt are both important objects to be studied in the overlapping segmentation method.

Overlapping segment window.
The window width K represents the amount of data contained in a single sample after segmentation of active segment data, whose size directly affects the delay of signal processing [38]. If the K setting is too large, it is easy to submerge the feature signal in the changing trend of the whole data segment, resulting in the loss of details of muscle movement changes. In addition, the overlong window width will increase the delay of control output, while the control lag of rehabilitation training equipment, sEMG control prosthesis and intelligent interactive equipment will seriously reduce the using effect and user experience. In order to avoid obvious operation delay, the control period of sEMG system should be less than 300 ms. If the window width is too small, the feature extraction algorithm, classification algorithm and computer performance are highly demanded, which is not conducive to the establishment of the whole recognition system. Figure 5 is the statistical result of the influence of window length on recognition rate. At present, there is no reliable mathematical tool to optimize the selection of K value and Kt value. Considering the sampling frequency of the original signal is 1000Hz, sampling period is 1ms, the basic requirement of W value K <150, and the computing ability of the computer and the real-time requirement of the system in the later period, K value is set to 100ms. In order to ensure the accuracy of muscle activity visualization, the Kt value is set to 50ms.
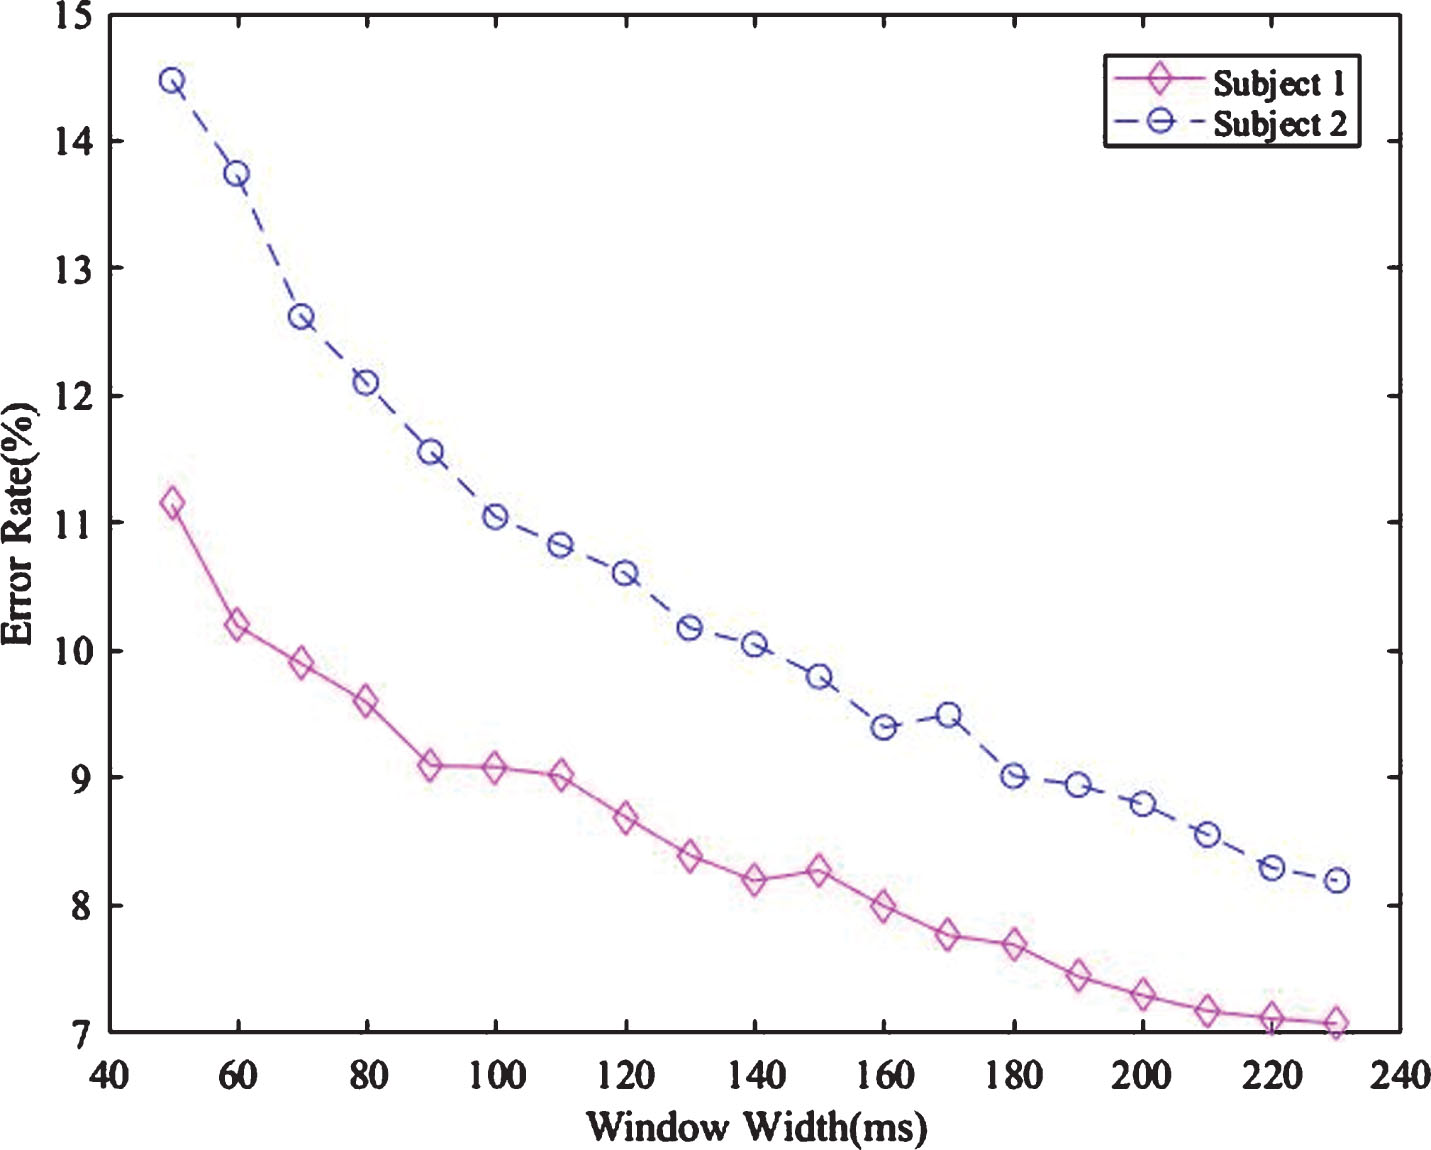
The relationship between data window width and recognition error rate.
Based on the open source Google body human body 3D model data, this paper reconstructs the forearm surface muscles of the human body, and separates the upper arm surface muscles along the ulnar position and expands to the two-dimensional plane while maintaining the relative position. According to the reference position of the myoelectric cuff in the experiment, the two-dimensional development of the upper arm surface muscle along the ulna and the relationship between the 16 electrodes collecting the electromyographic signal and the upper arm muscle are shown in Fig. 6. According to the arrangement of the electrodes, the upper arm muscles of the human body are divided into 8 different regions, named R1-R8, and the division is shown in Fig. 7.
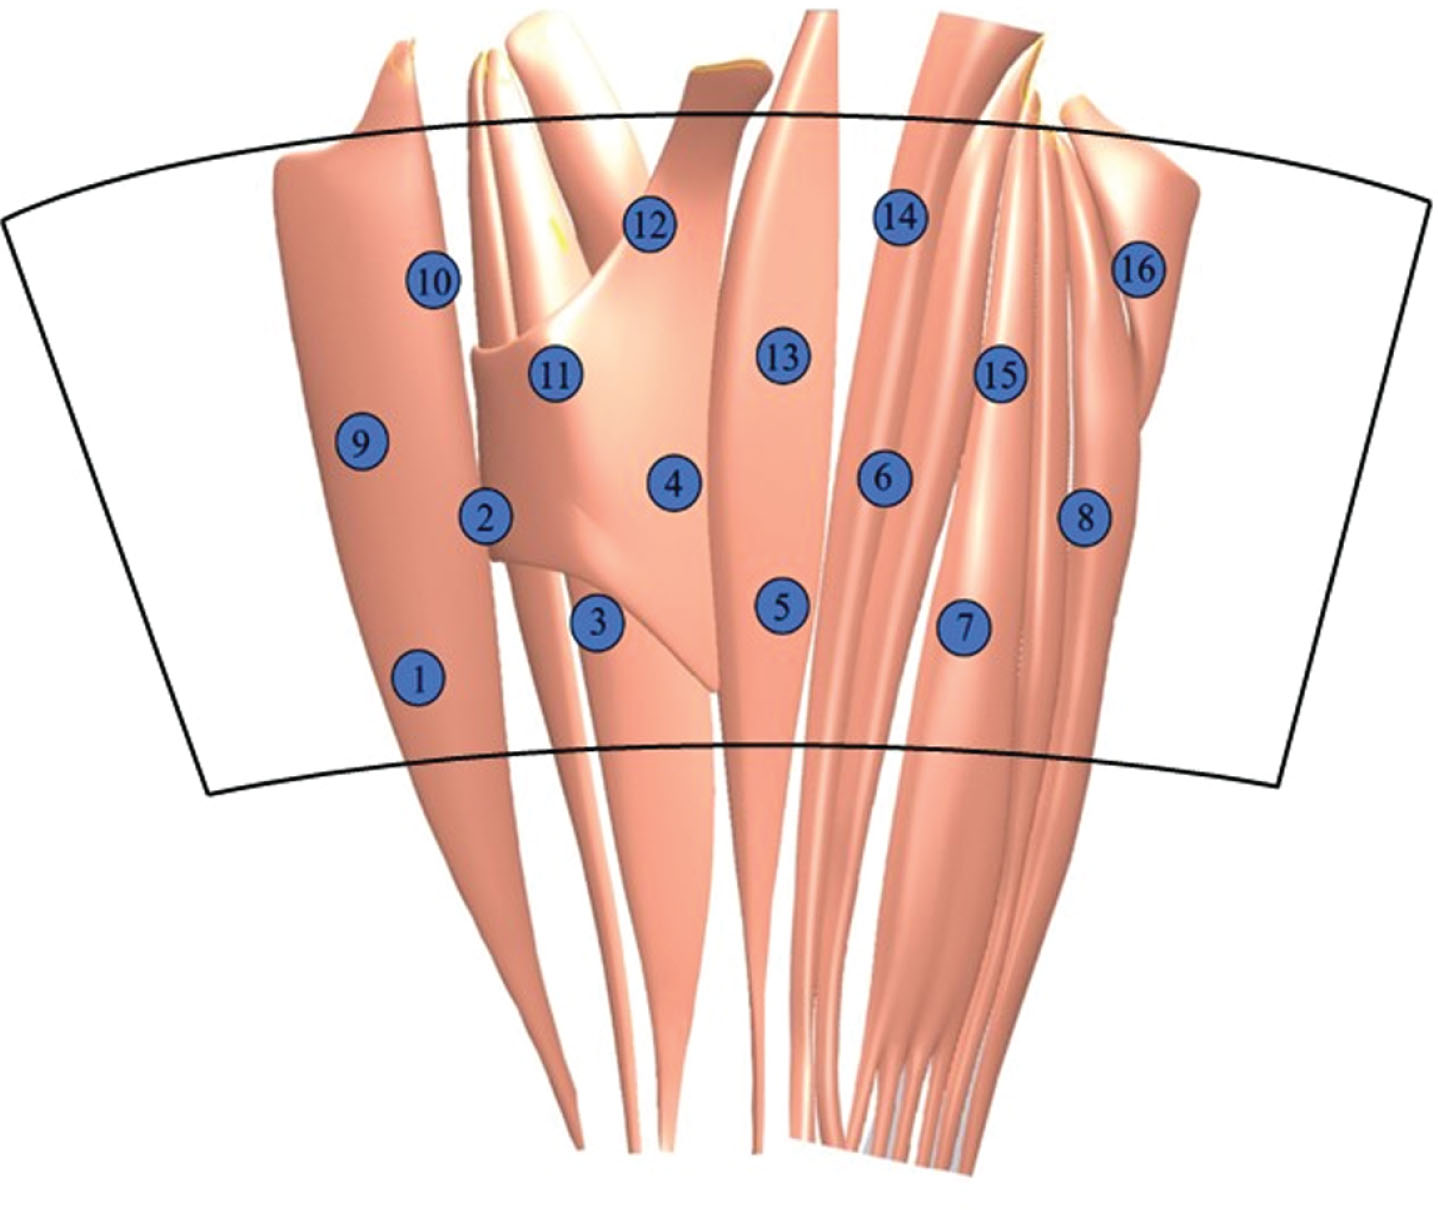
Two-dimensional development of the upper arm muscle of the human body.

R1-R8 muscle area division.
16-channel sEMG sleeve is used to detect the activated muscle area, which is the same as sEMG acquisition. Combined with the activated muscle area partition map, the display interface is constructed. The interface is natural, intuitive and easy to understand, and the real-time detection of activated muscle area based on sEMG is realized. Firstly, the real-time signal data matrix of each electrode of sEMG sleeve is input into the model, and then the Mean Absolute Value (MAV) of the original signal is calculated [39–42]. The absolute average formula is shown in Equation (2).
Where N represents the signal length; x n is the EMG signal of a window.
The absolute average matrix of sEMG obtained by calculation contains real-time sEMG intensity information of each sampling electrode. According to the 16-channel sEMG sleeve wearing criteria and the distribution of human forearm surface muscles in the collection experiment, the relative position relationship between sEMG and forearm muscles is obtained, as shown in Table 1.
Muscle matching at electrode location
The above work has completed the quantitative data of the activation degree of each muscle, which needs to be visualized. The method of data visualization in this paper is to use HSV (Hue, Saturation, Value) gamut space to express the color of data [43–46]. It is a color space created by A. R. Smith in 1978 according to the visual characteristics of color, also known as Hexcone Model. Its color expression mainly includes three main parameters: 1) Hue, measured by angle, ranges from 0° to 360° starting with red and counting counterclockwise, red is 0°, green is 120° and blue is 240°. Their complementary colors are: yellow 60°, blue 180°, magenta 300°. 2) Saturation, which indicates the degree of color close to spectral color. A color can be seen as the result of mixing some spectral color with white. The larger the proportion of spectral color is, the higher the degree of color approach spectral color, and the higher the color saturation is. Saturation is high, color would be dark and bright. The white light component of spectral color is 0, and the saturation is the highest. Usually the range of values is 0% –100%. The larger the value, the more saturated the color is. 3) Value, which indicates the degree of brightness of the color. For the light source color, the brightness value is related to the brightness of the luminous body. And to the object color, it is related to the transmittance or reflection ratio of the object. Usually the value ranges from 0% (black) to 100% (white). The schematic diagram of HSV color model is shown in Fig. 8, HSV color space is more similar to human color perception.
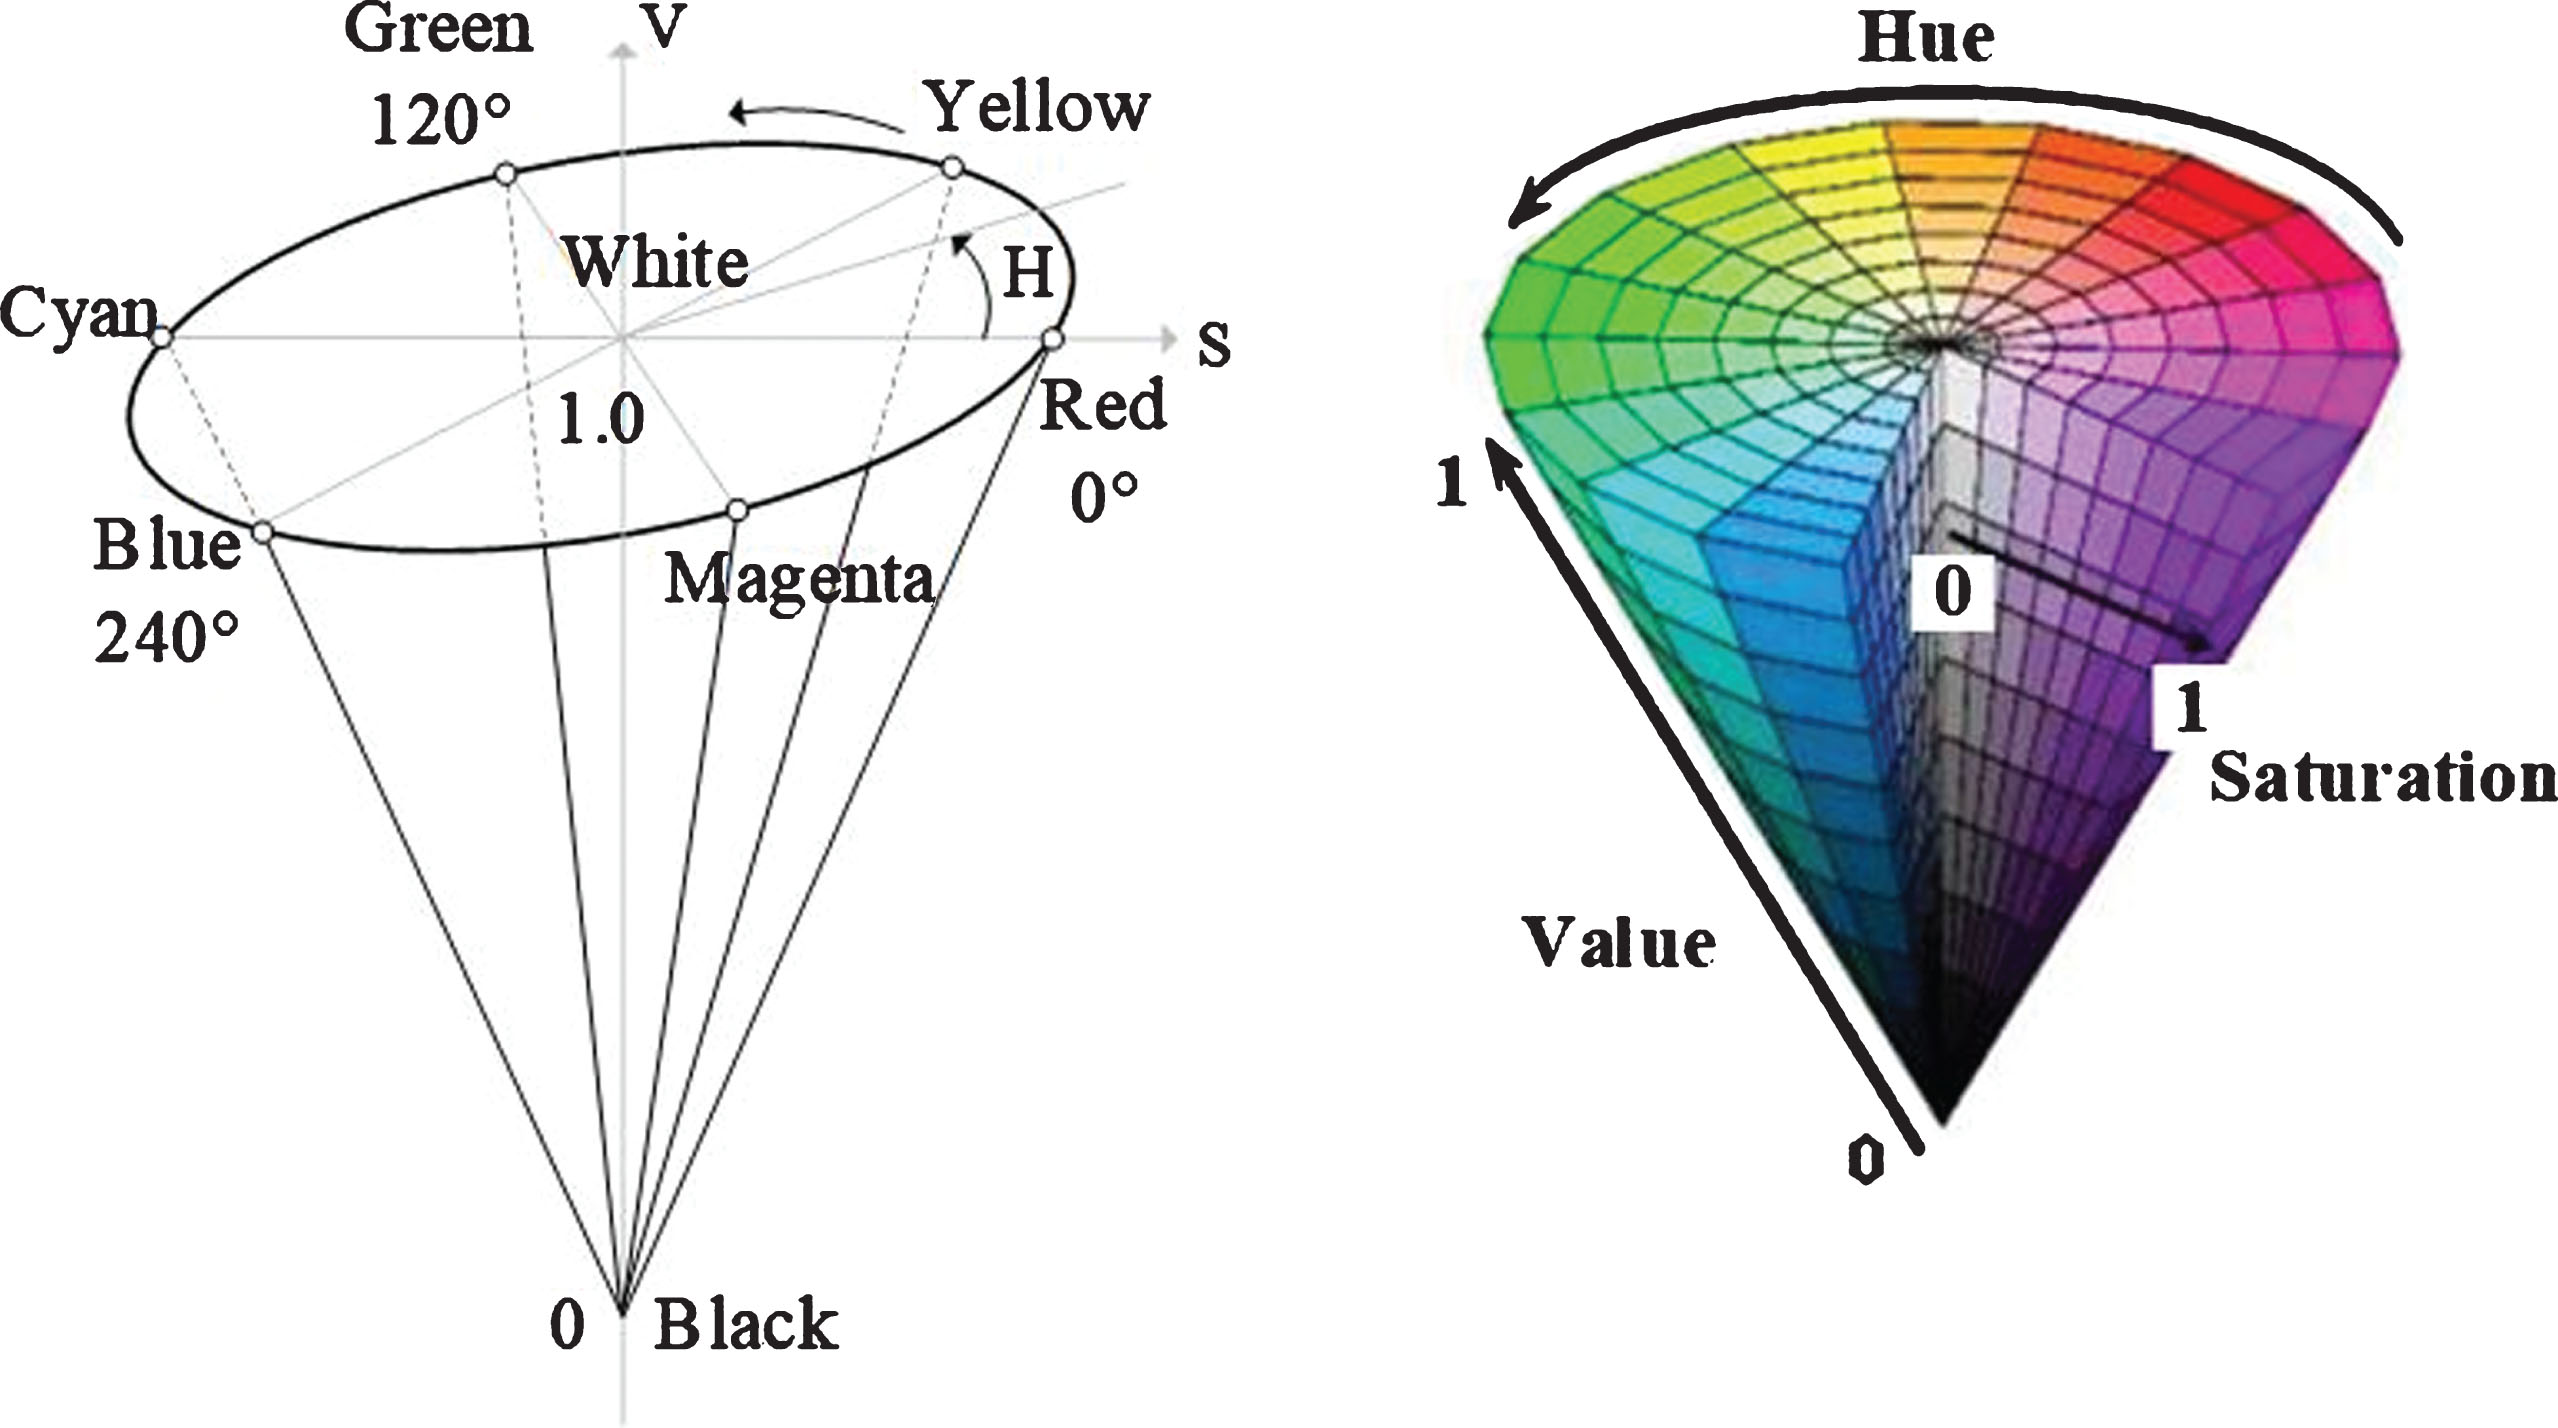
HSV color space model.
Compared with other color expression models, the biggest advantage of this model is that only H parameter is related to color, while the color of other gamut space is determined by multiple parameters [47–49]. Firstly, the muscle map of human forearm is obtained. Then, according to the muscle map [51, 52], the position of each muscle area on the surface is obtained, and a specific black-and-white Mask is obtained according to the position of each muscle (the area where the muscle is located is white and the other area is black) [53–55]. The white area in the Mask is identified by computer vision technology, and the position of each muscle in the muscle anatomy map is obtained by Mask. The upper arm muscle plan and the black-and-white Mask of each muscle area are shown in Fig. 9.
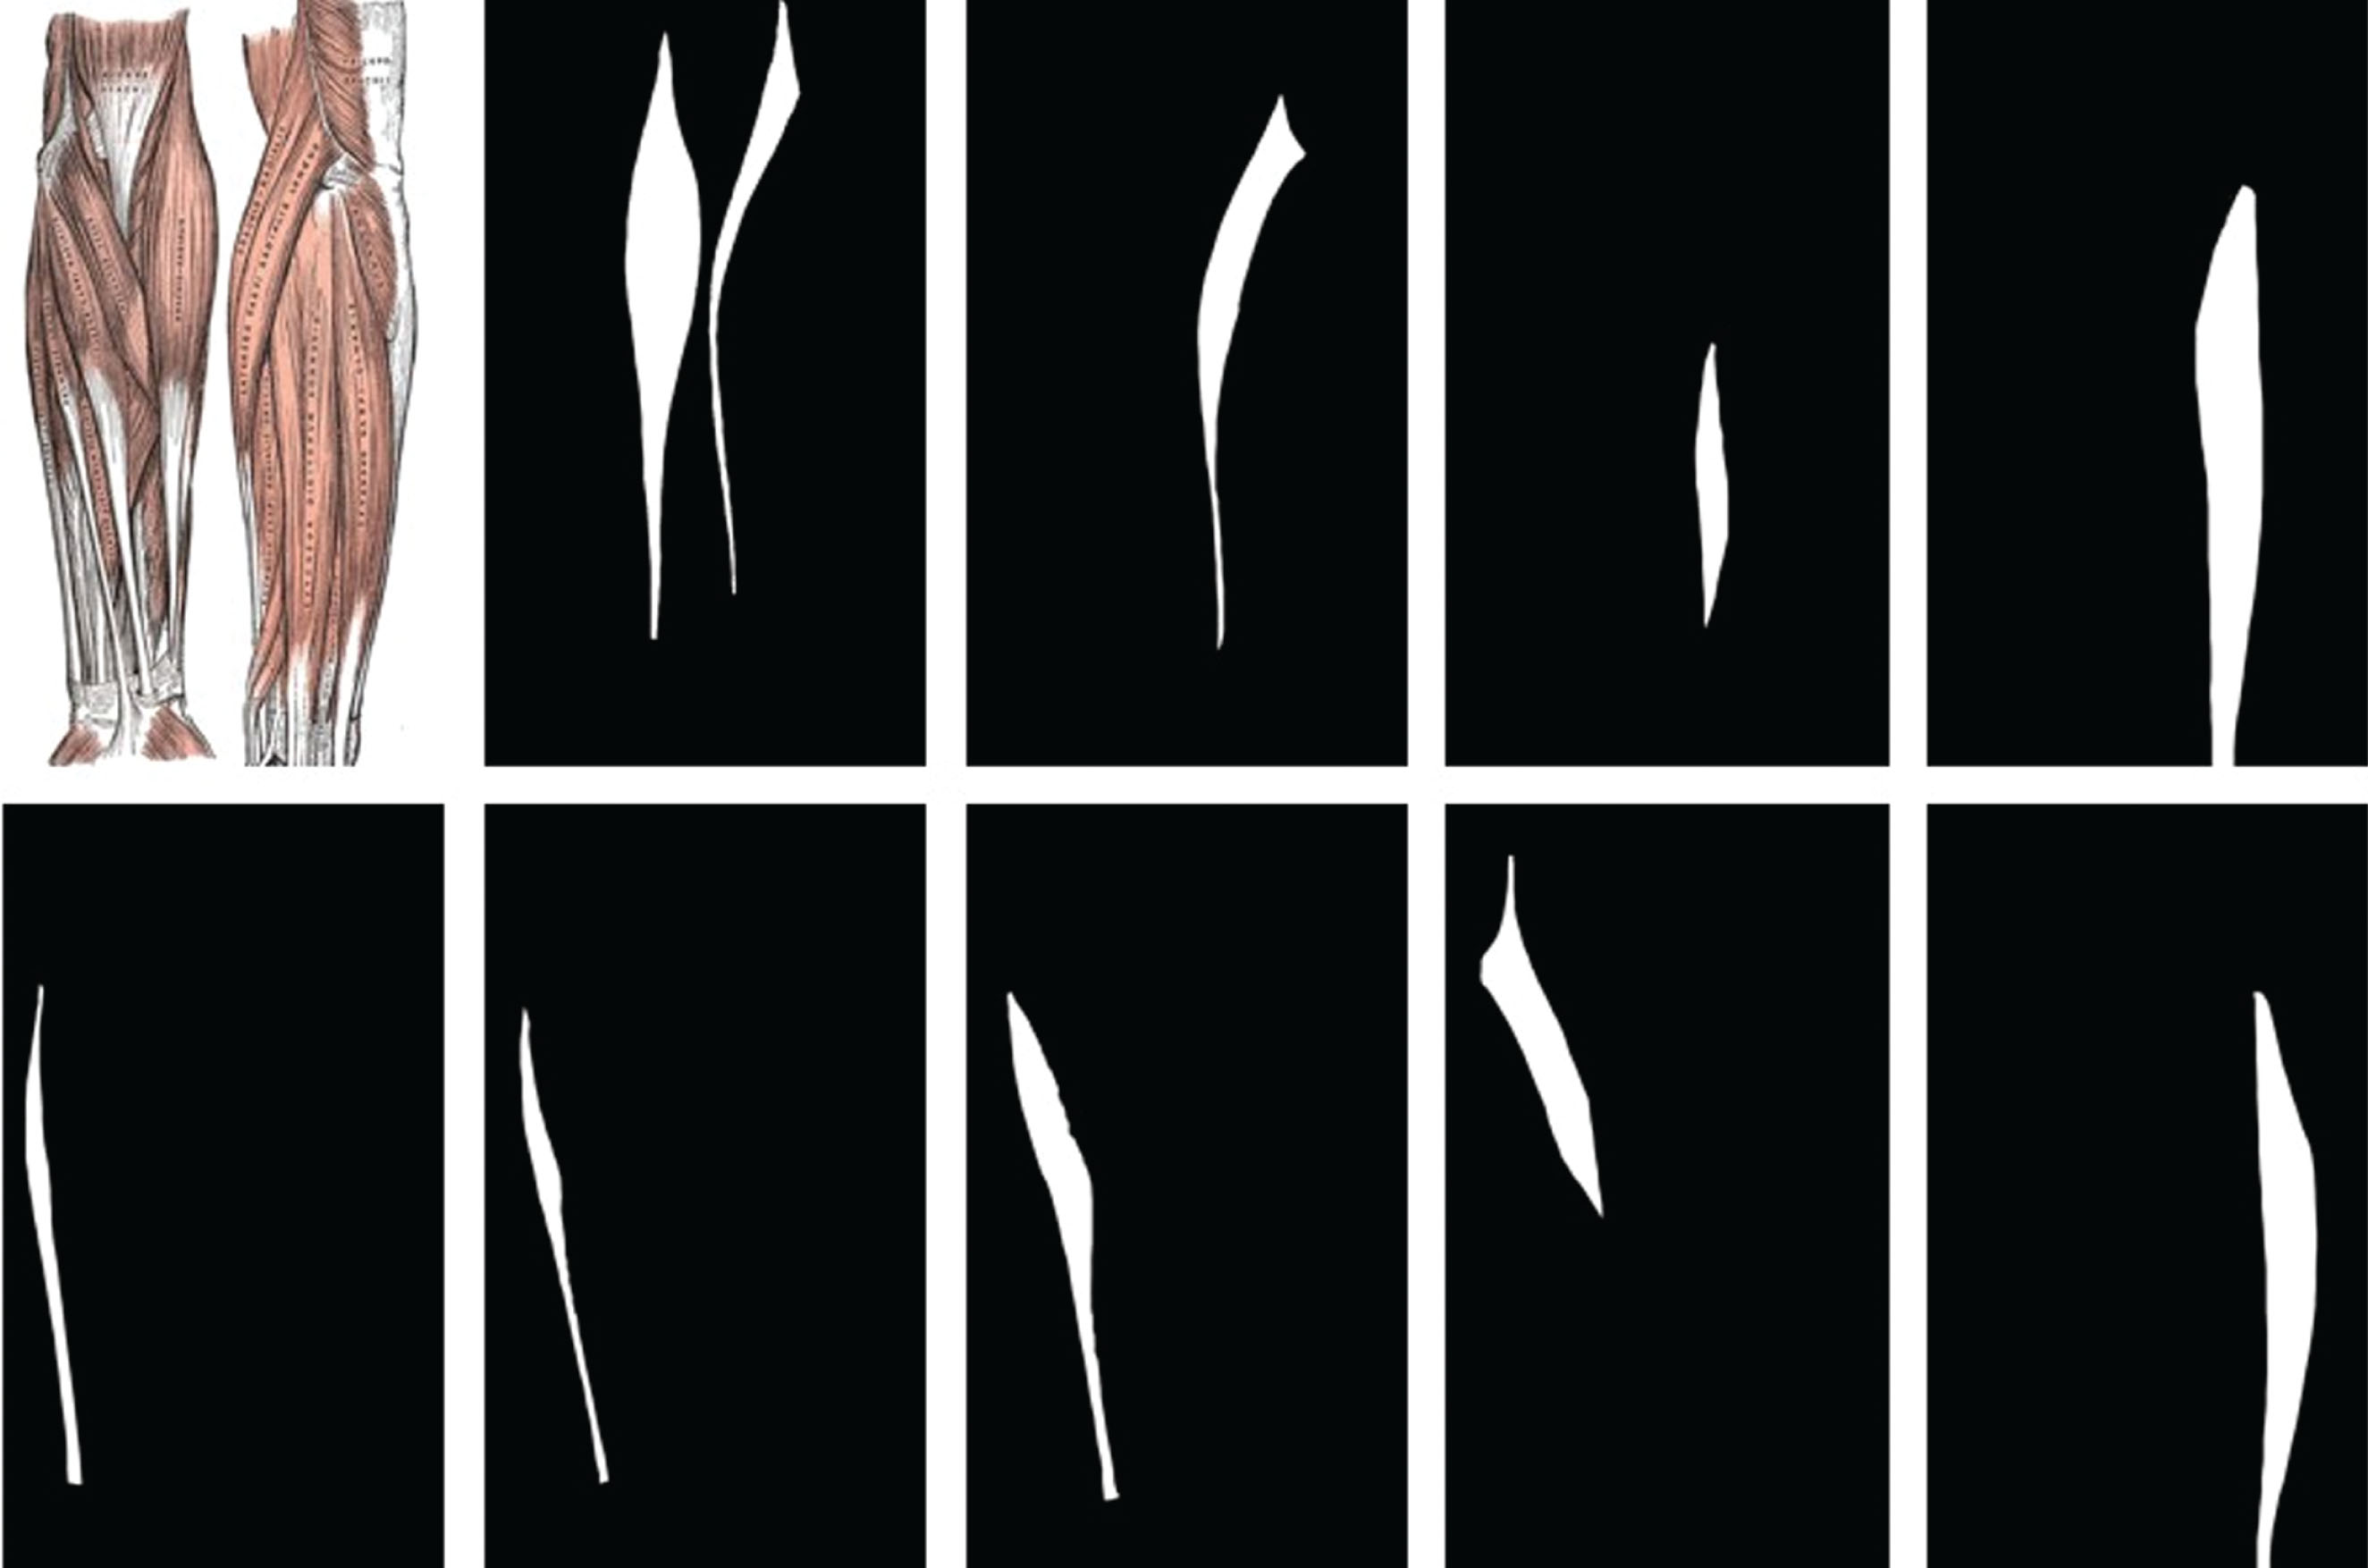
Visual interface bottom diagram and muscle masks for muscle area recognition.
The Mean Absolute Value of sEMG is normalized [56]. The normalization formula of deviation is as follows.
After normalizing the absolute mean value of sEMG, the attached value is given to the color parameter H in HSV color space. According to the position of the input electrode, the corresponding muscle region is obtained, and the corresponding color is mapped to the corresponding muscle region. For S and V, the fixed value is set to S = 0.8, V = 0.7. This parameters set the image to display more naturally, and since the above work is carried out in Matlab,its image display can only be output by RGB format image, so it is necessary to convert H, S, V values of HSV space into R, G, B values of RGB space for image output [57–62]. The corresponding conversion formula is Equations (4 and 9).
In the formula, h, s, v are input HSV gamut space parameters, r, g, b are RGB gamut space parameters.
After the built of visualization model, in order to realize the real-time display of muscle activation, a Graphical User Interface (GUI) interface for 16-channel sEMG sleeve is compiled in Matlab. After wearing the sEMG sleeve and connecting the sEMG acquisition instrument and computer through the corresponding port, the activation of muscle during hand motion can be displayed in real time through this GUI interface. In order to ensure real-time performance and no data loss, the corresponding codes are optimized so that the single run time of the program is less than the single sampling time of the electromechanical signal. The corresponding GUI interface is shown in Fig. 10.
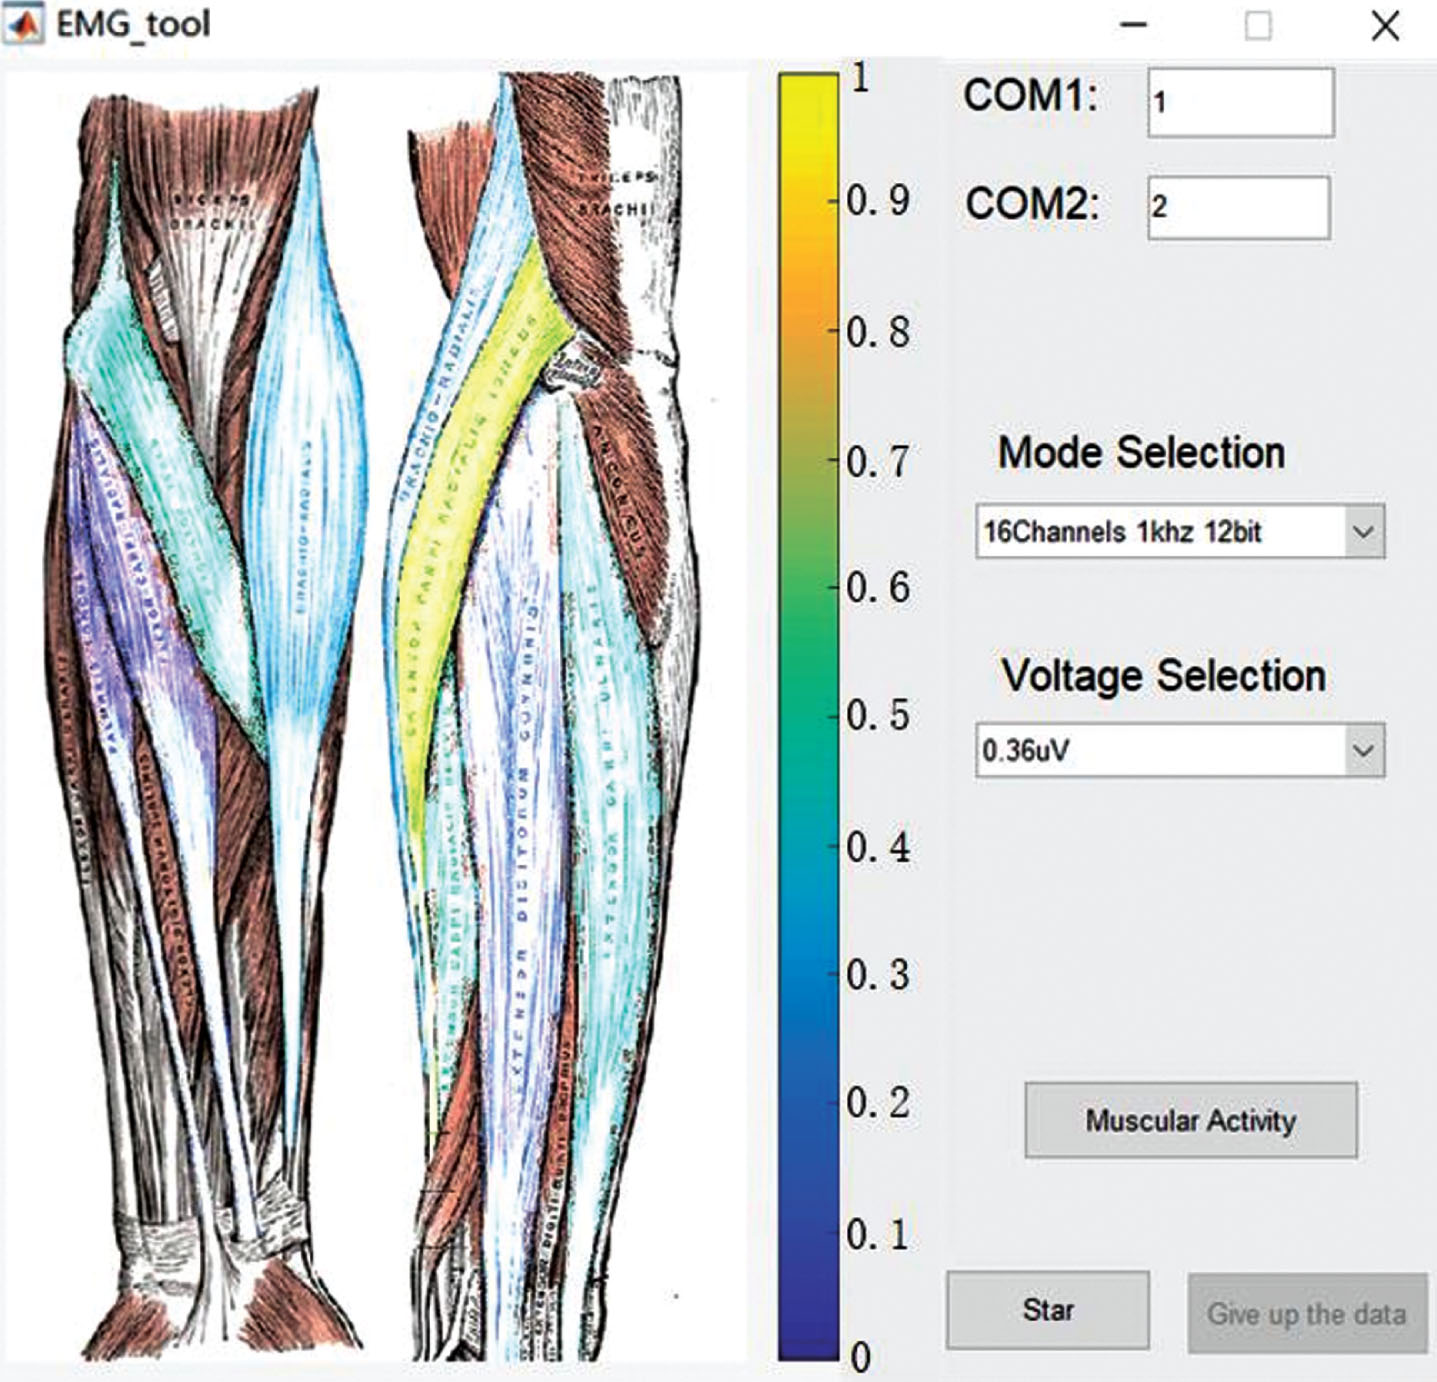
Muscle activation dynamic visualization human-machine interface.
According to the established visualization model, it can be found intuitively that different hand motions show distinctly different modes from the activation muscle graph. Figure 11 shows the results in the activation of muscle visualization system under six action modes of experimental hand motion. At the same time, another advantage of electromyogram is that the influence of force on the activation of muscle area is not obvious. Under the action of different forces, the active area of muscle in the same hand action is basically unchanged, but the intensity of the active area of muscle changes. This phenomenon strongly supports the subsequent extraction of sEMG features based on the activation of muscle regions, which proves that this feature pattern can have a good shielding effect on hand motion recognition. Figure 12 is a sEMG visualization of the same subject under three different degrees of fist clenching. The above phenomena can be clearly observed in the graph.
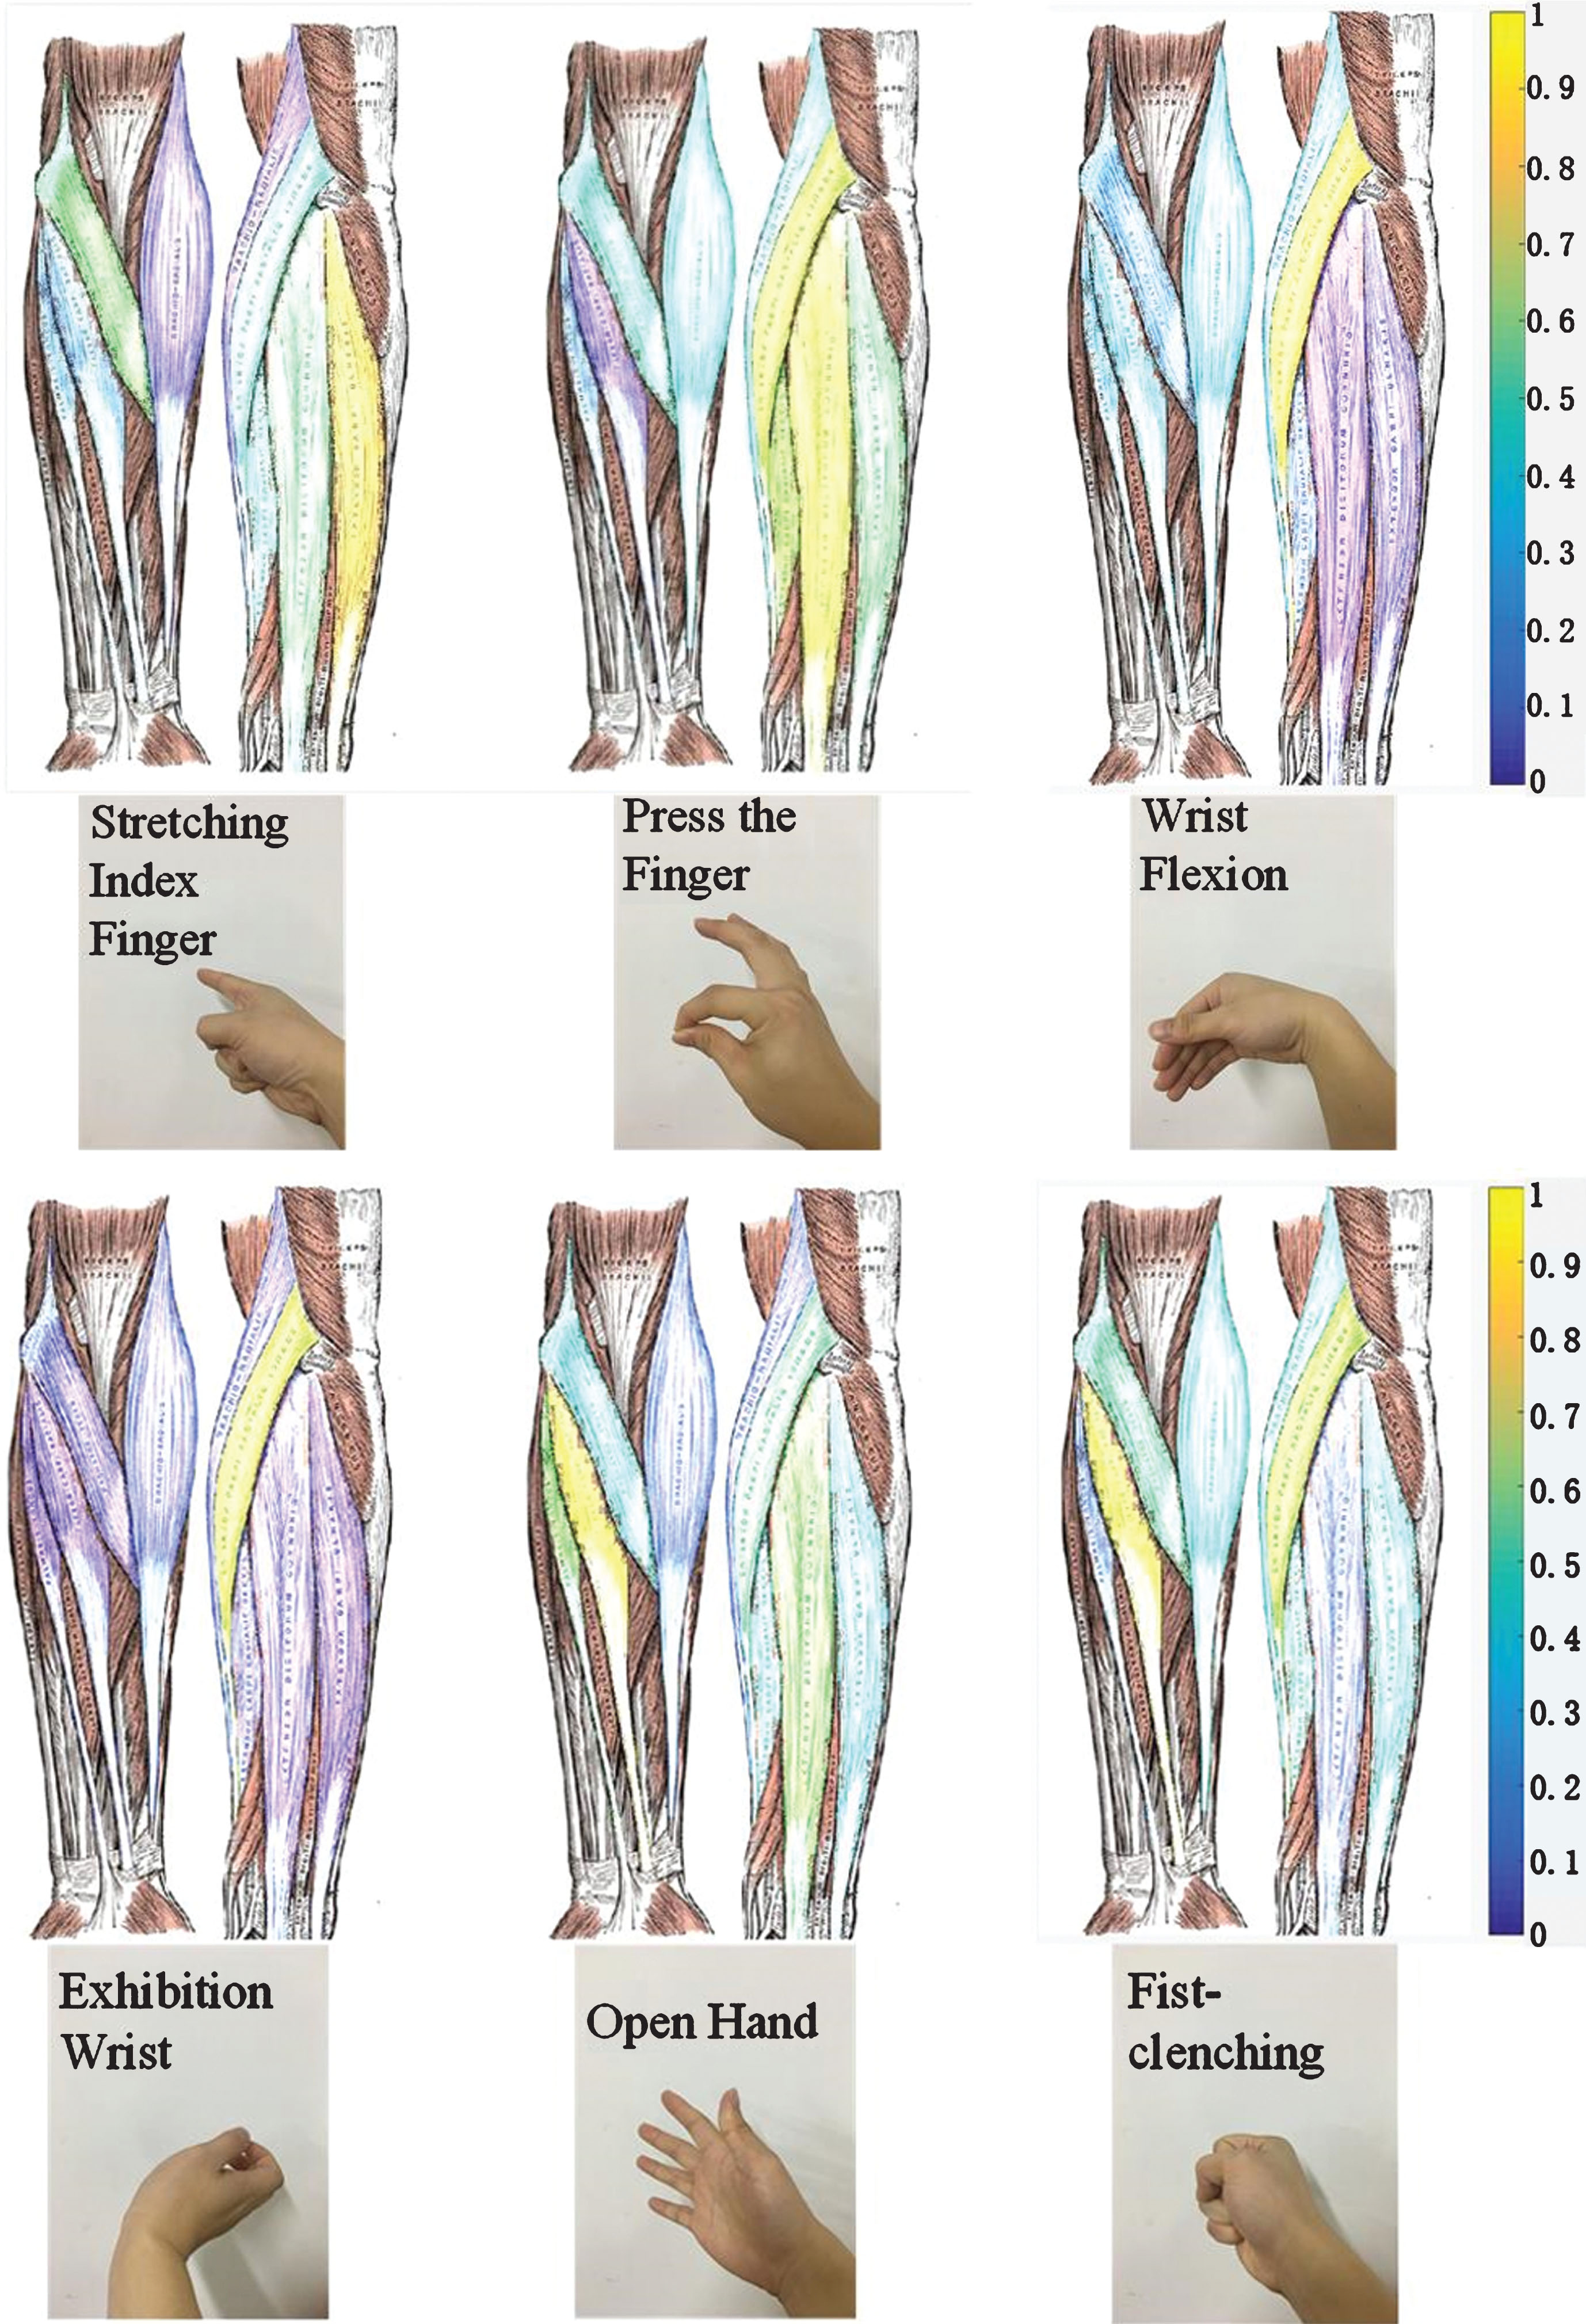
sEMG visualization of stable hand motions (color represents muscle activity).
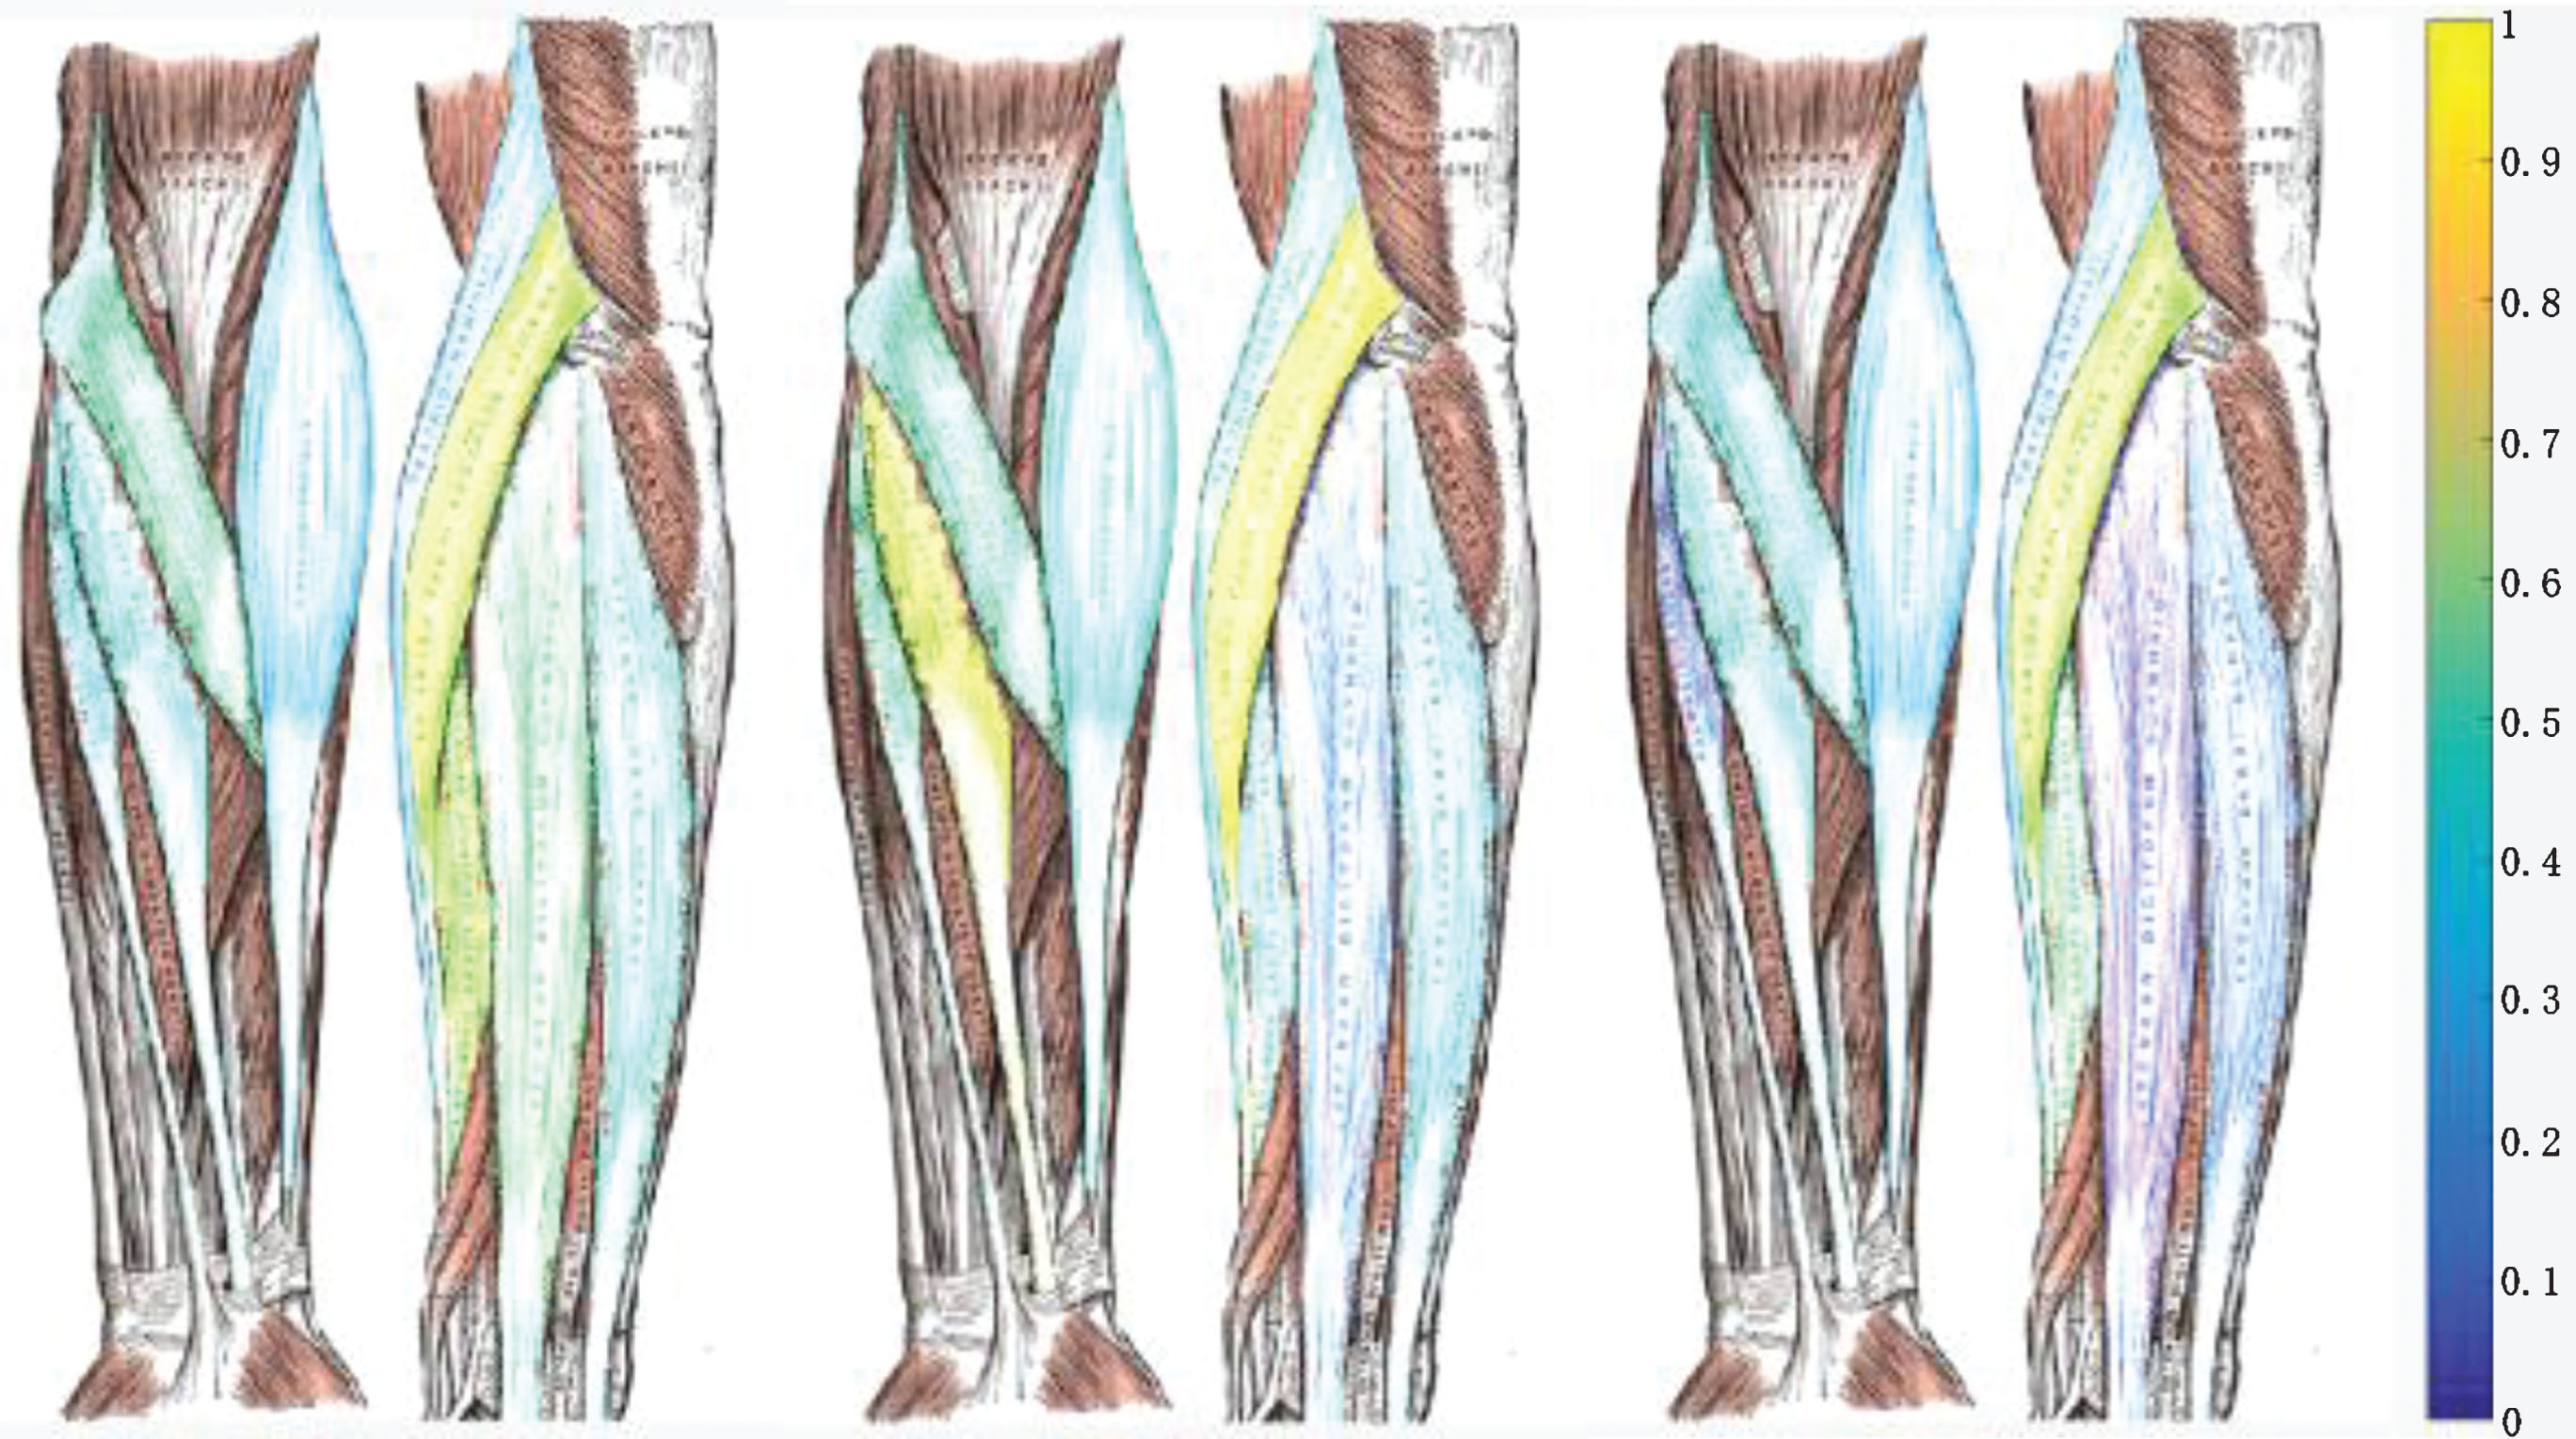
sEMG visualization charts of the same experimental subject with three different forces in fist-clenching (The order from left to right is large, medium and small).
Based on the study of the related activated muscle areas in the process of hand motion, the effective sEMG is obtained by detecting the active segment of the original sEMG and data segmentation. After obtaining the sEMG, the average absolute value of the sEMG in a certain time window is obtained, and the intensity of the sEMG is measured by this method, which is combined with computer graphics. Image technology establishes correlation mapping relationship, expresses the intensity of sEMG in HSV gamut space, and constructs a visualization system of sEMG based on activated muscle region. The interface of the system is very intuitive and can display the activation of each muscle in real-time during hand motion.
Footnotes
Acknowledgments
This work was supported by grants of National Natural Science Foundation of China (Grant Nos. 51575407, 51505349, 51575338, 51575412, 61733011), the Grants of National Defense Pre-Research Foundation of Wuhan University of Science and Technology (GF201705) and Open Fund of the Key Laboratory for Metallurgical Equipment and Control of Ministry of Education in Wuhan University of Science and Technology (2018B07).