
Abstract
Pattern of emotion identification is one of the improvised research application regarding facial expression as major concern, in those cases, conventional facial expressions for patterns identification. The present model is based on signal collected from physiological sensors followed by consecutive deployment of unsupervised machine learning model. The proposed model is unsupervised in following aspects: firstly, it introduces Expectation Maximization problem with respect to unknown emotion labels to be derived from the measures. Correlation of physiological signal and individual emotion labels can be identified. This follows a considerable emotion classification method. However, the output of EM model doesn’t ensure the correct identification of emotion class, if any. We introduce Support Vector Regression (SVR) as output module of this model. Hence, we try to forecast the probable classes of emotion after investigating the ranges of values and appropriate standard threshold values of physiological signal with respect to respective emotion class e.g. angry, frustration and joy. This should be noted that, the proposed model doesn’t envisage facial expression analysis. However, after successful implementation of Gaussian behaviors of mixed physiological signal, we can enhance the accuracy of identification. Significant emotional context exists in output with more precise results of emotion identification phases.
Introduction
Emotion and its expression in the form of physiological changes is not an isolated phenomenon. It is well investigated that emotion and psychology has a good interplay to analyze certain underlying pattern of emotion, if they persist. There are multiple number of instances, when human participants exhibit different levels of physiological parameters e.g. body temperature, heartbeat, blood pressure, pulse respiratory system in different situations, even some of the changes of the parameters are unusual with respect to the physiological measures. The unconventional magnitude of physiological measures seldom impress the artifacts of emotion pyramid. According to the primitive motivation from [27], it is described face expressions as universal, culturally and racially invariant emotion characteristics. In their work, they establish six universal emotions: “Disgust”, “Fear”, “Happiness”, “Surprise”, “Sadness” and “Anger”. However, we argue that unlike to the facial expression, there is a strong correlation between emotion and physical attributes of human and more-over in certain instances, the relation can be strongly demonstrated. Several interesting investigations are already established to represent relation between psychology and emotional aspects of human. However, emotion is still considered as a major fundamental building block of psychology [1, 2].
Hence, research has been centered on elaborate the impact of emotion towards a specific behavior. The key driver is thought to be the underlying complex interplay of the three processes of emotion [28] namely, influence and impact of emotion, and their stimuli [29] secondly, the distribution and expression of emotion with respect to different contexts [30] and finally, emotion tolerance. In spite of all these conventional process, it is seldom realized that emotion pattern revealed through physical changes are difficult to distinguish. Reason being that in facial and image expression, the expression is pre-defined. On the other hand, under similar context of impulse, same person can exhibit different level of emotional behavior, which could be retrieved from their physiological sensory inputs [3]. This specific trait of this behavior motivates to propose a novel method for identifying such piece of emotion. It is worthy to mention that there is no assurance of distinguished emotion pattern from the analytics, which may reflect emotion constituents from the conventional emotion pyramid. Therefore, the data instances are unknown and it will not be feasible to incorporate any supervised algorithm to detect certain embedded yet hidden pattern. In fact, all the variables in the input of physiological sensors are latent variables.
In this paper, an unsupervised machine learning model is proposed. This will be a variant of expectation maximization (EM) model constituted with a basic deep neural model. However, as the emotion labels are not identified therefore after EM model certain probabilistic classifications are expected. For example, in case of initial classification through Support Vector Regression, it improvises to learn a hyperplane, that separates positive and negative points. We argue that learning requires certain pre-deterministic features for appropriate training or learning session. However, pilot data of emotion class matching from physiological signal is not available directly. Even. in conventional models there is no notion of probability involved. It implies that, as per this model, an instance either belongs to positive or negative class can be identified.
The two commonly used forms of probabilistic models are: Generative Models: If x denotes the instance and y denotes the label, then in Generative Models, we learn a joint distribution over x and y, P (x, y) or equivalently P (x|y) and P (y). It begins by assuming a parametric distribution for P (x, y) (or P (x|y) and P (y)) and then learning the parameters using the training data. These models are called generative because once the parameters are learned, these models allow us to “generate” new data points from them through sampling. An example of such a classification model is Naive Bayes. Discriminative Models: If x denotes the instance and y denotes the label, then in Discriminative Models, we learn a conditional distribution on y given x, P (y|x). It begins by assuming a parametric distribution for P (y|x) and then learning the parameters using the training data. These models are called Discriminative because once the parameters are learned, these models only allow us to “discriminate” between the classes for a given instance through the probabilities that they provide. These models are not capable of generating new data points like Generative Models. An example of such a classification model is Logistic Regression. Given a probabilistic model, how do we learn the parameters of the model using the training data? The most common (possibly the simplest) way to estimate the parameters of the model is using the Maximum Likelihood Estimation (MLE) method.
Hence, as an output layer, support vector regression will be a probabilistic classifier of unknown emotion labels and class. The results will be a broader classification based on the output of EM model with better precession. Finally, EMDeep comprises of the combination of both models.
Thus, to ensure about final classification, we adopt support vector regression for more converged classification posterior to the EM model. Finally, with standard values of threshold signals of physiological signal is compared with respect to generic physical expressions like excitement, consolidated status of the mind etc.
The remaining portions of the paper is organized as follows:
Section 2 introduces the brief overview of proposed model with its constituted components followed by the scope of machine learning to address such problems. Section 3 elaborates the roadmap of the basic EM algorithm and its variants in subsequent sub-sections followed by section 4 detailing the recent works, which address contemporary emotion identification except facial expression. Section 5 describes very relevant discussion concerning mathematical constitution of emotion class and physiological signal and respective results of analysis in subsequent sub-sections. Section 6 summarizes about the contributions from this paper with respect to the potential of future research in this directions.
Representation of components
This should be noted that EMDeep is a hybrid model. This is due to the non-availability of training data on emotion classes from physiological signals and its unsupervised mode pf operations.
Moreover, the variants of basic EM algorithm assist to build up the EMDeep model, which also comprises of support vector regression. The role of different sensors to collect the physiological signal from group or individuals are performed. Subsequently, the measures are propagated to the next level of EMDeep model to estimate the “best” guess of emotion related to the physiological signal input. As this phase is primarily a statistical data mining process. therefore, the output will still remain as approximation. However, in the following Fig. 1, it is demonstrated that decision making level will be achieved by support vector regression (SVR) phase. This will be partially true, because SVR will assist to derive the closer match to a resultant emotion context with respect to specific physiological signal. It could not infer the output finally. Hence, an appropriate threshold values of correlation with physiological signal and emotion context is presented concerning the inference part for detecting the particular emotion class.
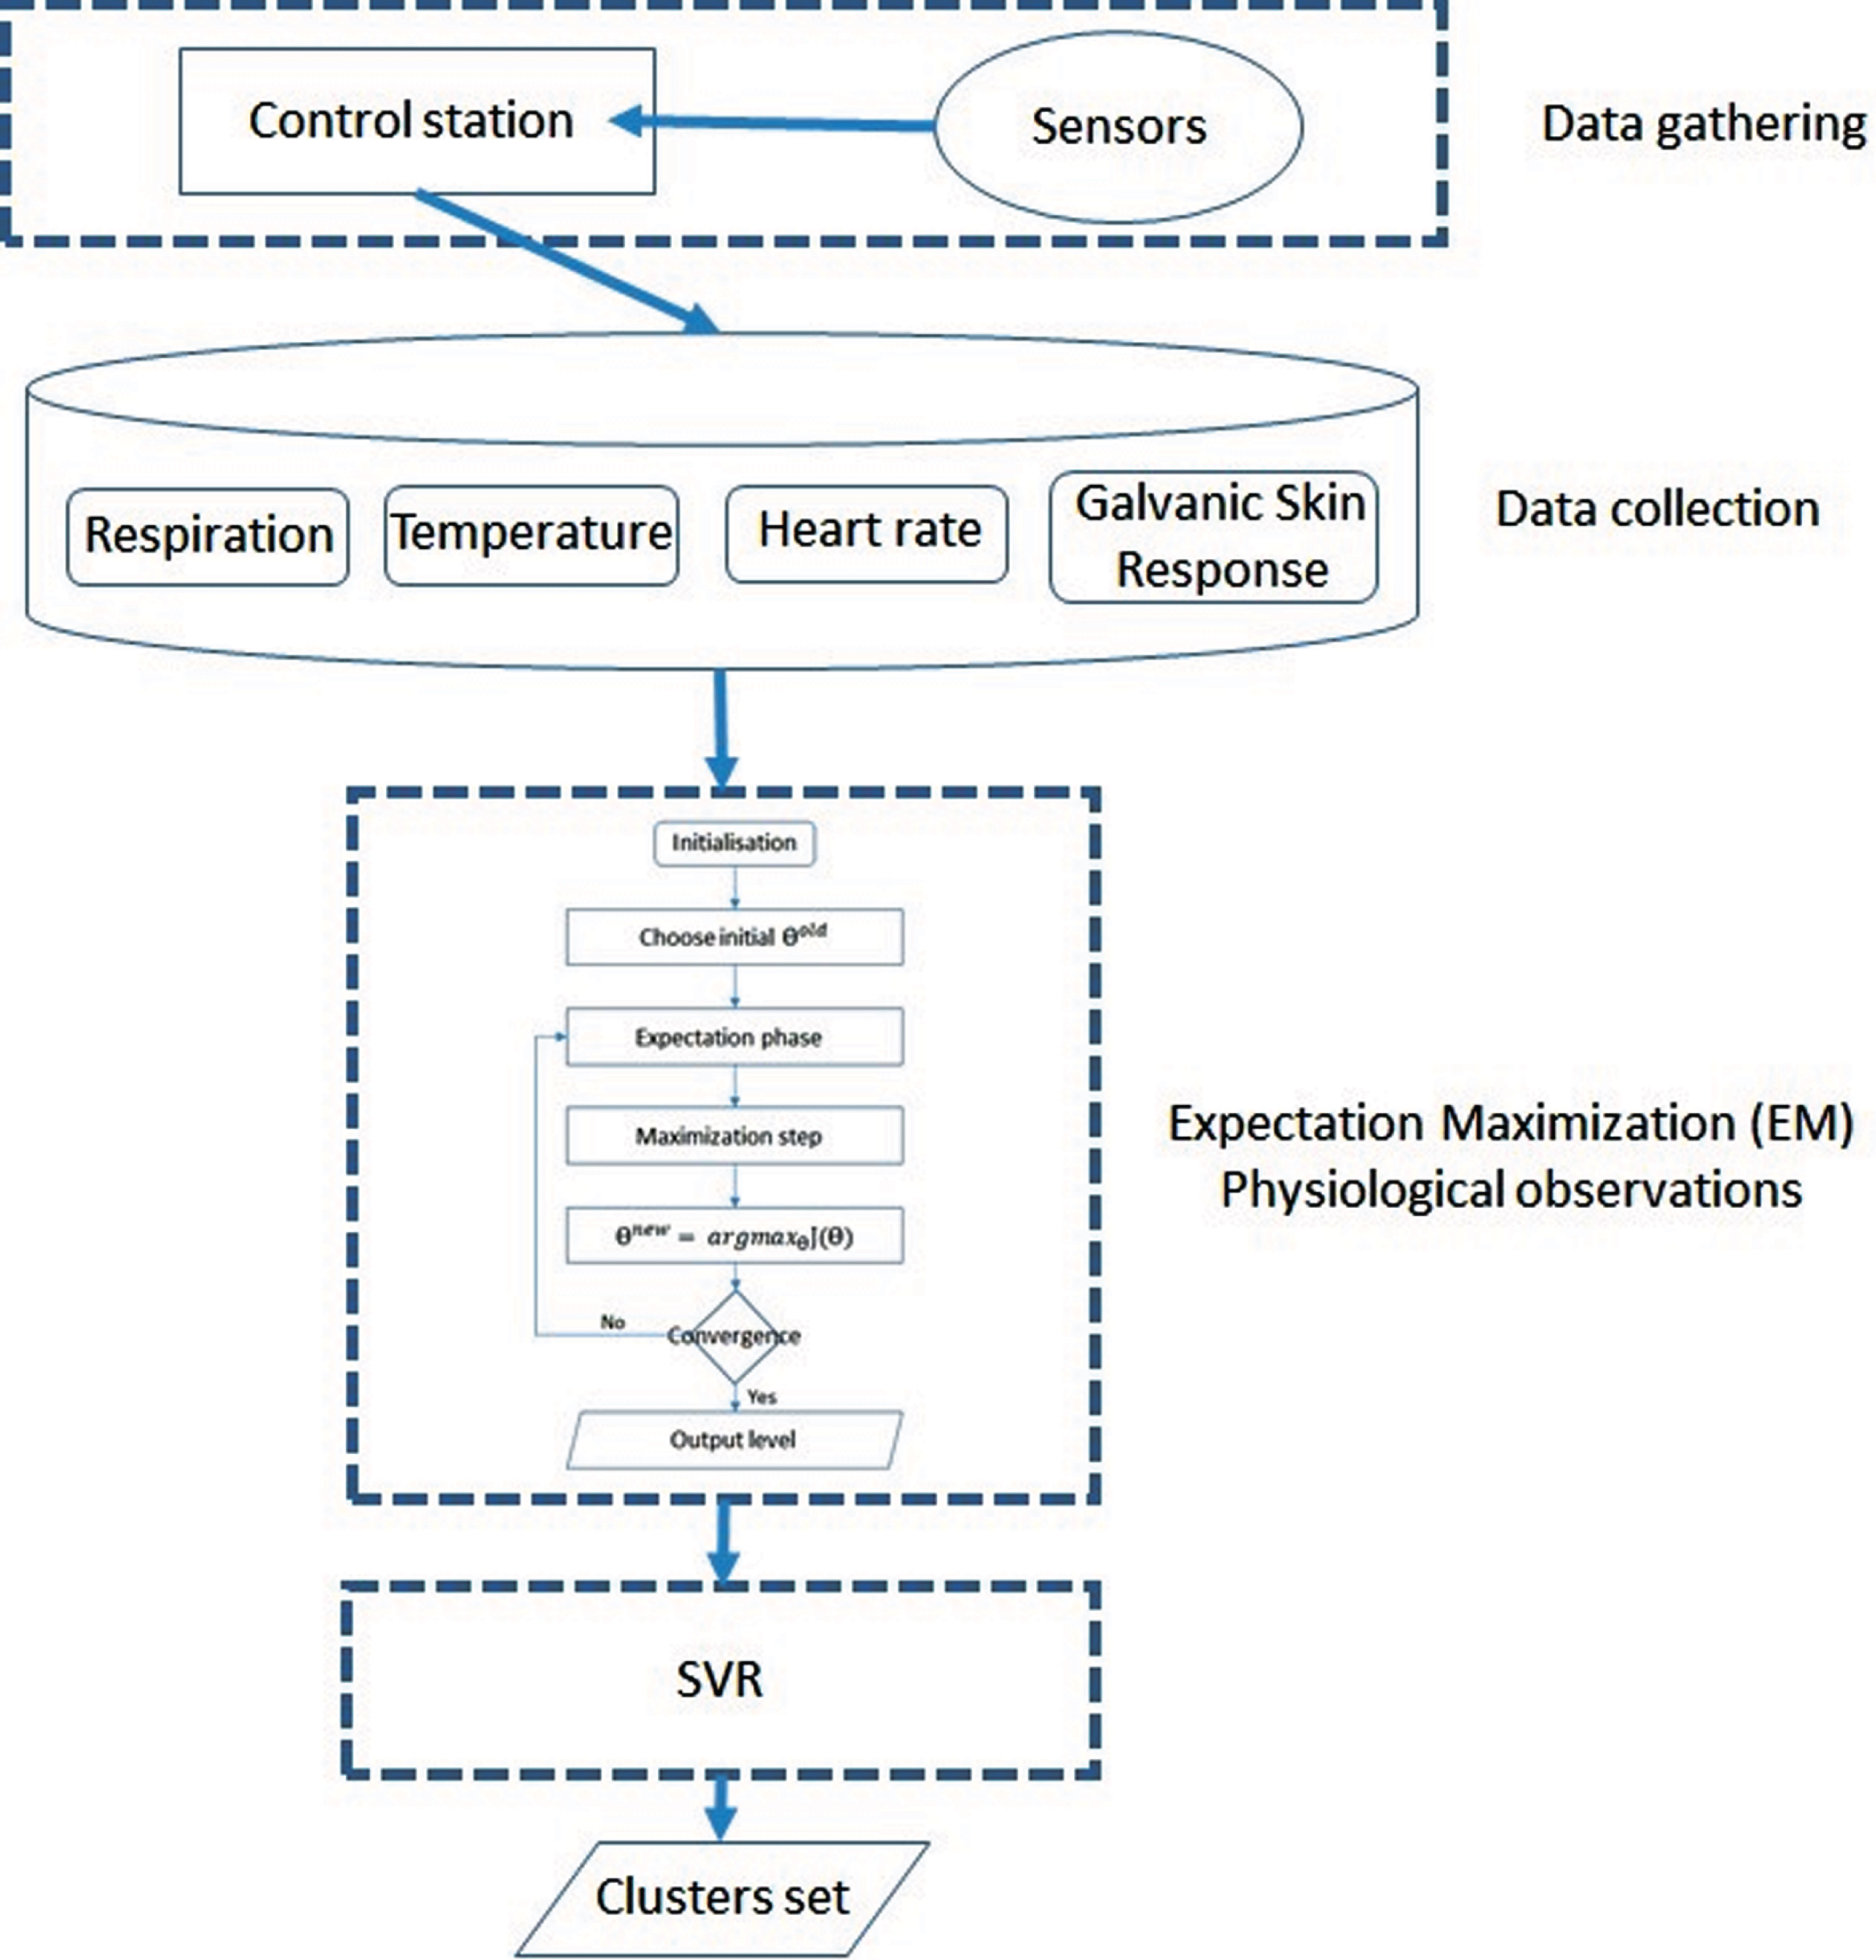
EMDeep schematic Representation.
As a brief interaction of the model we describe the followings for support vector regression in section 5.1.
The scope of machine learning is enormous in the context of referencing a specific class matches. Conventionally, till the feature acquisition through different sensors, stages appear to be similar. They only correspond to classification. However, in this paper we introduce generic deep neural network to identify or to forecast appropriate labels either by semi-supervised or unsupervised mode. This is worthy to mention due to large unlabeled corpus of physiological signal of individual may indicate more closely than proximity or similarity as well (Refer Fig. 2). It is to be noted that this paper would not like to measure the emotion from signals through machine learning methods. However, once the physiological signal is measured and if any pattern is explored then, it will ensure the closest resemblance of emotion pattern could be achieved via ML methods. Therefore, machine learning algorithms are used to consider the non-linear between subjective and physiological data. However, the algorithm used here is principally unsupervised. This implies prior to identify the pattern from physiological signal, no training is required. Afterwards, machine learning models can be customized with certain similar public data set to compare laboratory and wearable sensors in terms of emotion recognition accuracy and precision. Here, the problem is bifocal: it is the combination of identification and classification of pattern. We explored different classes of unsupervised algorithms However, hybrid model and hybrid structure of deep neural network can recognize specific patterns related to specific output class. The bridging of the physiological signal measure analysis and emotion identification can be presented with rudimentary pedagogy of neural models.
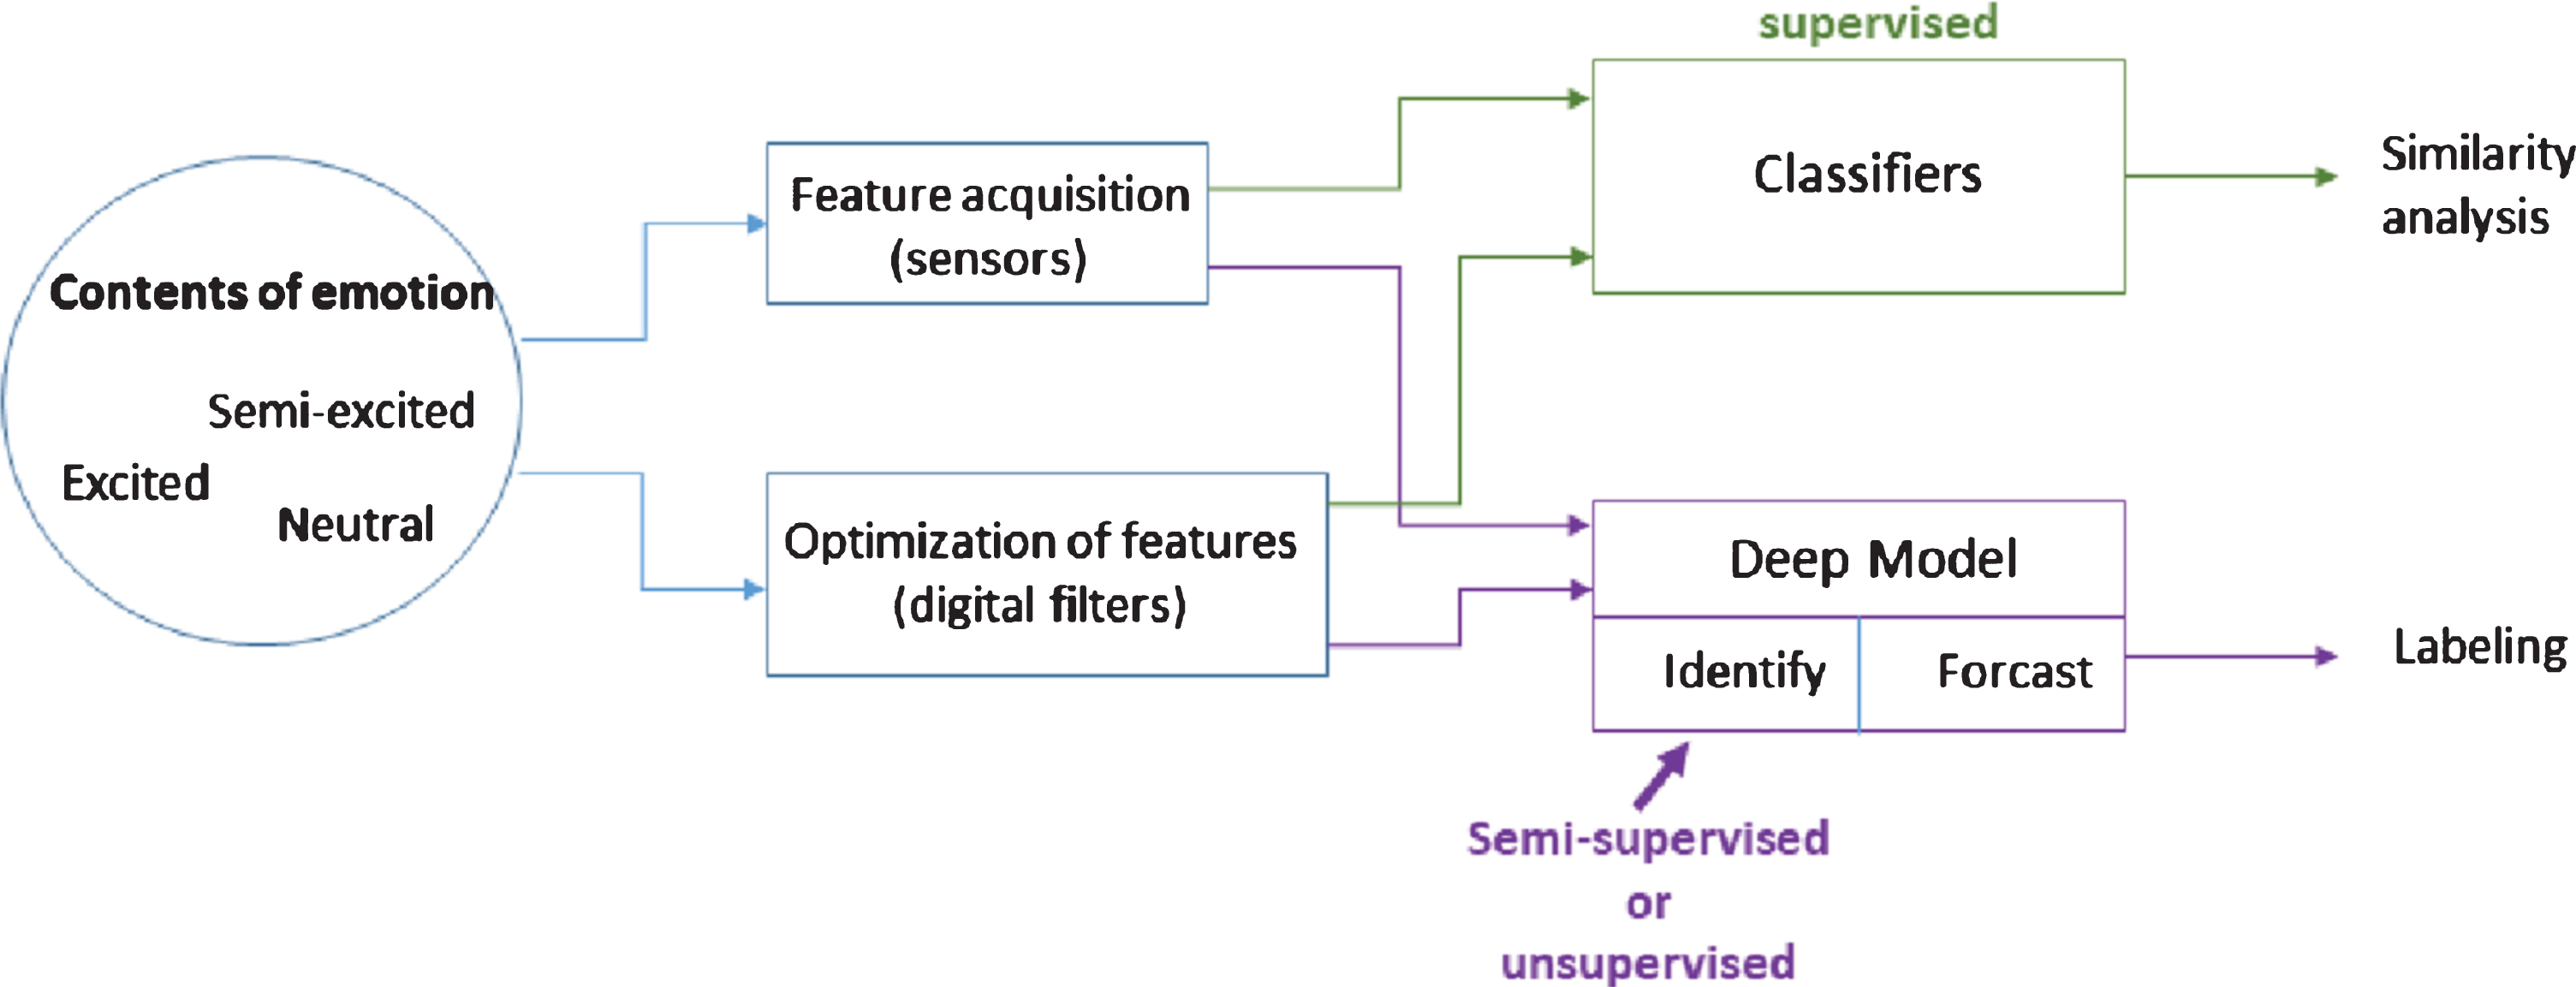
Stages of machine learning in emotional contents.
To formulate a hybrid model (as mentioned as EMDeep), a roadmap is presented (Refer Fig. 3) to understand the model. It is mentioned that the problem paradigm comprises of complex latent variables
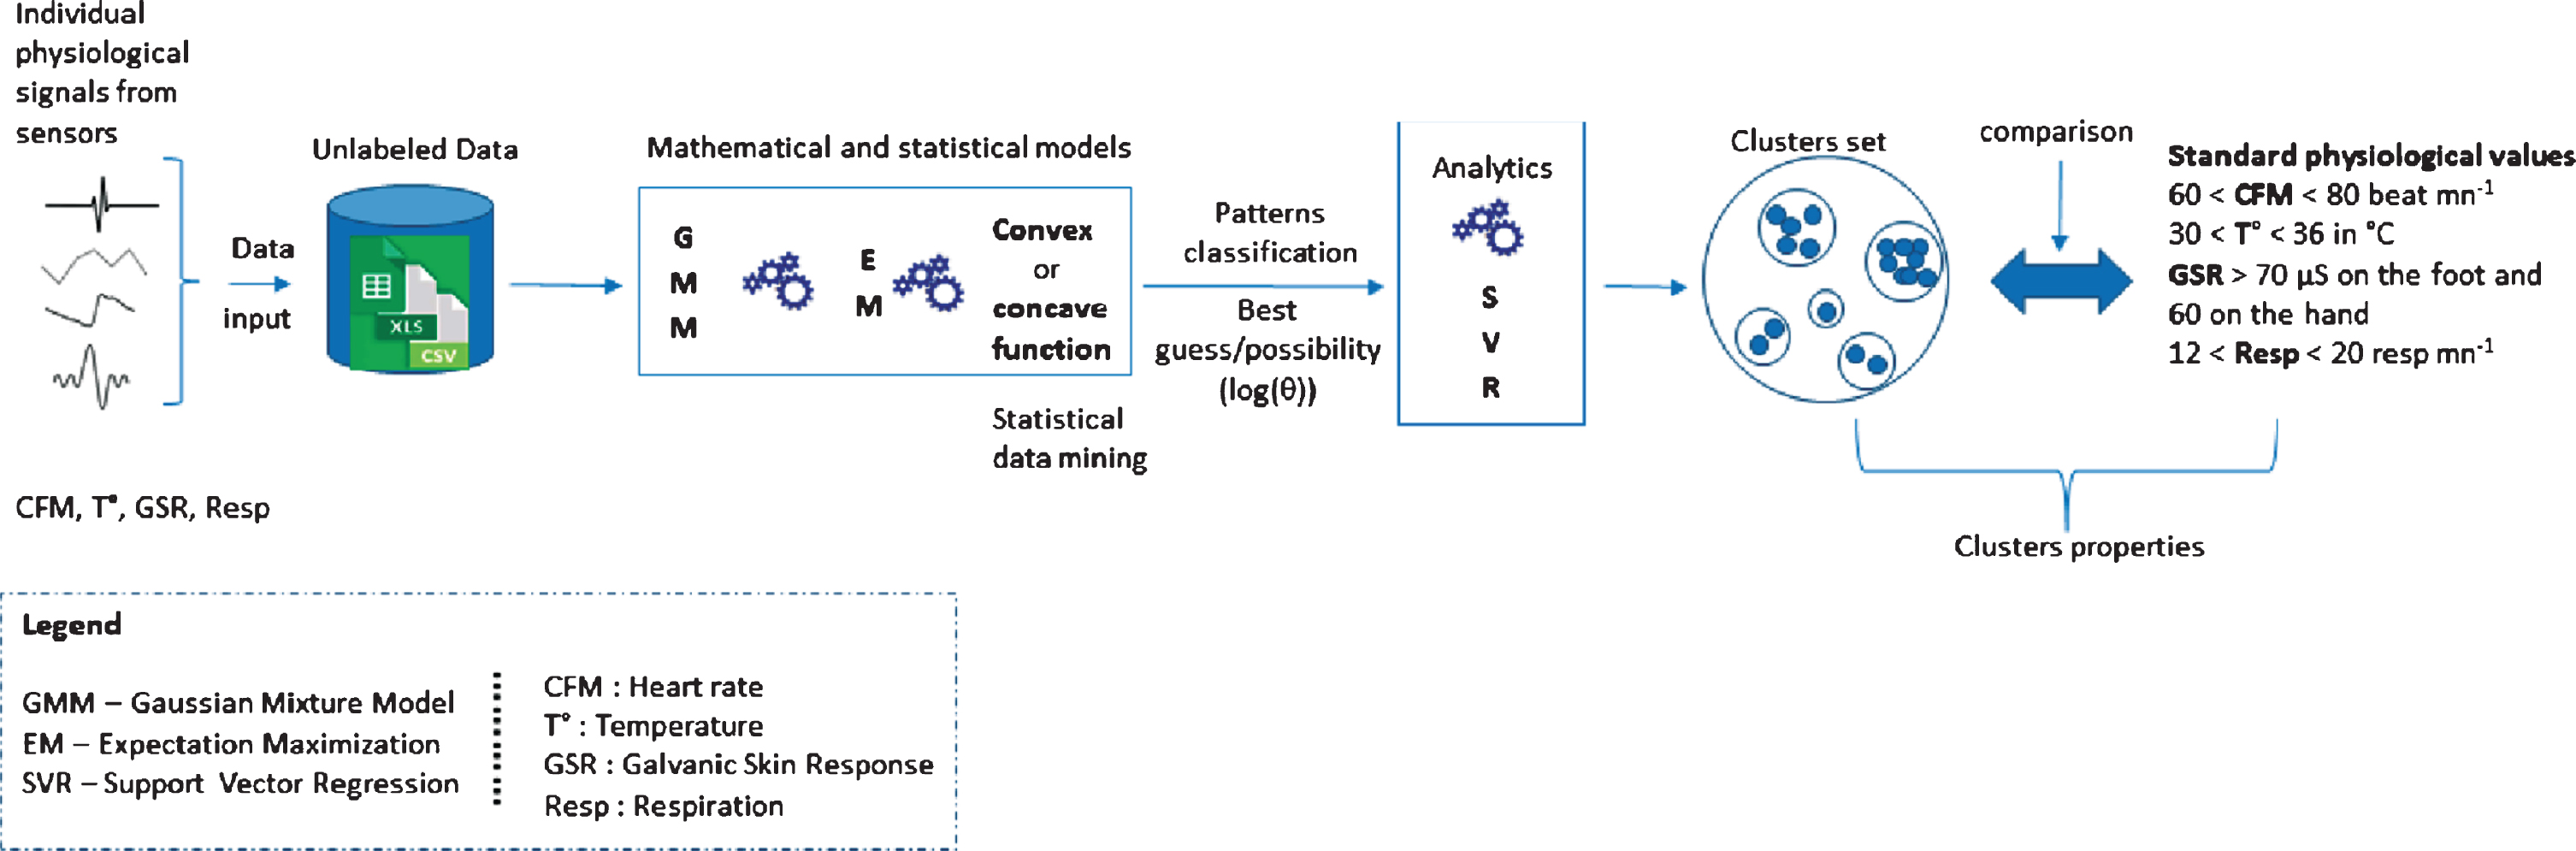
Outline of Machine Learning for Unsupervised Emotion Class.
Two sets of random variables: Z and X. Z consists of unobserved hidden variables. X consists of observed variables. Joint probability model parameterized by υ ∈ : p (x, z|υ). The set up for the problem is a probabilistic approach, not assured concerning the presence of pattern. p (x, z|υ) suggests a Bayesian setting, in which υ is a random value. However, we are not assuming a Bayesian setting. p (x, z|υ) is just easier to read than pυ (x, z), once υ becomes more complicated. Considering this initial set up, EMDeep is proposed. The model comprises of primarily two parts: Expectation Maximization module (EM algorithm is an iterative estimation algorithm that can derive the maximum likelihood (ML) estimates in the presence of missing/hidden data (“incomplete data”)
EM algorithm is another form of unsupervised machine learning technique
EM algorithm is an efficient iterative procedure to compute the Maximum Likelihood (ML) estimate in the presence of missing or hidden data. In ML estimation, we want to estimate the model parameter(s) for which the observed data are the most likely. Each iteration of the EM algorithm consists of two processes: The E-step, and the M-step. In the expectation, or E-step, the missing data are estimated given the observed data and current estimate of the model parameters. This is achieved using the conditional expectation, explaining the choice of terminology. In the M-step, the likelihood function is maximized under the assumption that the missing data are known. The estimate of the missing data from the E-step are used in lieu of the actual missing data. Convergence is assured since the algorithm is guaranteed to increase the likelihood at each iteration.
An observation of X is called an incomplete data set. An observation (X, Z) is called a complete data set. We never have a complete data set for latent variable models. However, it’s a useful construct.
As, we have an incomplete data set D = (x1, . . . , xn). To simplify notation, we consider X to represent the entire dataset X = (X1, . . . , Xn), and Z to represent the corresponding unobserved variables Z = (Z1, . . . , Zn).
Therefore, proposed EM is as follows:
We iterate two steps based on the current υ (t) and we will map in unobserved z to get z (υ). Finally, υ is updated to optimize the value.
The central key of the theme is to how to choose z (υ). We use p (z|x, υ (t)) as initial distribution. We don’t want to ignore any possible value of z, hence to optimize the expectation instead. More precisely, we start from some initial υ (0). Then iterate the following two steps until convergence E(expectation)step, and compute p (z|x, υ (t)) and form the expectation using the current υ (t).
M(maximization)-Step Find υ that maximizes the expected complete-data likelihood.
The mathematical steps are presented in terms of the high level description:
The key idea of the module is to map the identification of any possible pattern, with respect to the physiological signal through the intuitive observation(s), where there is possibility of matching an observation or not: therefore there is a possibility of log-likelihood measure for the event θ and for any discrete case the log expression could be the same. However, we found that: Optimization for complete data is relatively easy
Marginal log likelihood is hard to optimize:
Full log-likelihood would be easy to optimize
Hence, our approach is to maximize the expected complete data log-likelihood, which will enhance the chances of identifying certain repetitive pattern. The notations (Refer Table 1) are frequently used throughout the paper.
A Deep model based on hybrid deep neural network (Conventionally, we define a function f for mapping of the frames of specific physiological parameters and any hidden states of users: this is because, HDNN should have a core as convolutional neural network (CNN), therefore, the first Convolution layer uses ’TanHyperbolic’ as the activation function for valence classification model, and ’Relu’ or Rectilinear units as Activation for Arousal model [12].
Notations
The representation demonstrates initial basis of emotional state and frame of the game with respect to specific instance. However, pre-training of LSM [25] modules can be formulated with following objectives: We maximize the log-probability (4) using batched gradient descent as mentioned in EM the maximization is require. This is because for both the frame of physiological measures and associated unknown pattern of user can have two different probability distribution. Therefore, the unknown function must be balanced between the source features of sensors and approximate distribution of those features by LSM. the expression is: Subsequently, to maintain a mutual relationship between continuous configuration with individuals, an objective function in terms of cost incurred, can be defined. This objective function combines with the Pearson’s correlation coefficient (CC) and the square difference between the mean of the two compared time series [7, 34]:
Here, dashrightarrow is the Pearson correlation coefficient between two time series (e. g., prediction and ideal standard time series without restrictions),
The contribution in this paper is novel with respect to following aspects: There is an attempt to detect underlying pattern of emotion through physiological measures of sensors. This paper proposes an approach to investigate an embedded pattern of emotion (if persists) and to detect the similar pattern to infer about a possible emotional state. f
To propose the interaction model, the primary unit is envisaged as latent semantic machine (LSM). This is a direct feed forward perceptron for modeling a complex function. The proposed simple EMDeep consists of an input layer, more LSM with EM model and an output layer. In implementation, fully connected, dense neural layers where the output of one layer serves as the input for the next layer. The proposed methodology has been divided in three phases: firstly, a high level description is presented with identification of pattern space. This is followed by a classification algorithm with a tuned deep learning neural network and the measure of divergence of known and unknown input samples. The basis of mathematical model indicates specific need of optimization to select a balanced model of facial expression measure for known and un-known input. However, proposed model here involves latent and hidden states (reason to include EM model as basic building block), deliberately concentrating on the physiological signal instead of facial images.
Thus suitable data source is identified to justify the model.
As a pre-introduction of the given context, emotion detection is mostly oriented with facial image detection and labeling-the emotion from the structural changes in the faces for different contexts is discussed (section 3.3).
We also argue that how a possible emotion states can be detected by exploring the physiological signal of sensors following the identification of pattern of similar or dissimilar emotion labels with the help of computational intelligence and machine learning.
For possible unexplored emotional state from physiological signal, we use EMDeep model. However, for CNN the corresponding unexplored state creates a serious limitation, the following mathematical expression could justify this:
It should be be noted that that as x→ and y is held constant, then it goes to 2. Likewise, as it should be noted that that as y → 1 and x is held constant, then it goes to 0. Thus, the x → 1 and y is held constant, then it goes limit doesn’t exist. Hence, the range of tan-hyperbolic function (+1.–1) should be bypassed. Therefore, the ranges are not adequate to justify the maximized physiological signal values, as they don’t associated image pixels like facial images.
Modifications
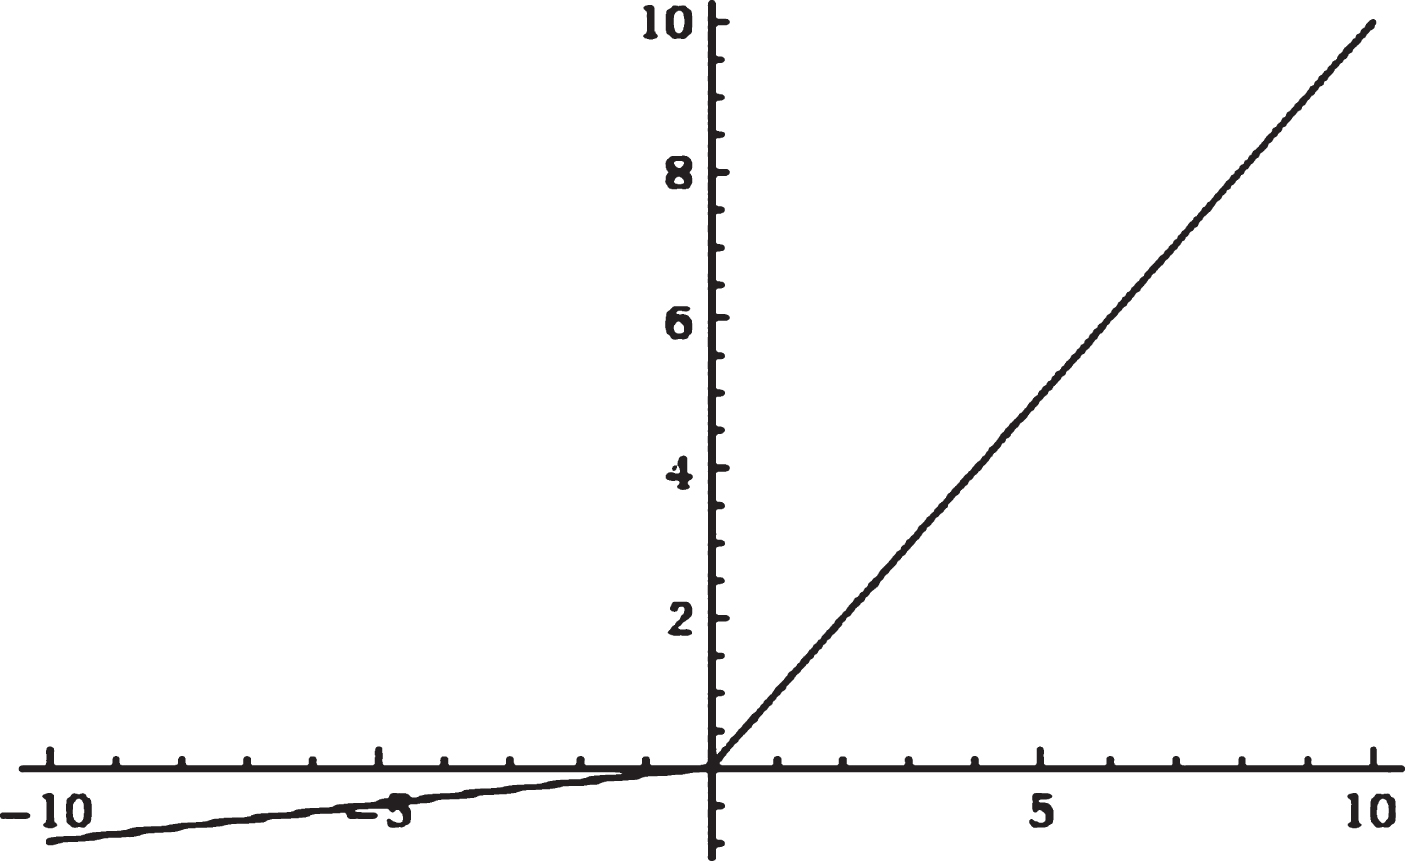
Non-leaky rectified linear units seldom faces a technical restriction known as “dying”. When the dot product of the input including its weight to a ReLU becomes negative, then the output attains 0 value.
The slope of max (x, 0) is 0 when the output is 0. (Refer left side of plot)
If, for whatever reason, the output of a ReLU is consistently 0 (for example, if the ReLU has a large negative bias), then the gradient through it will consistently be 0. The error signal back-propagated from later layers gets multiplied by this 0, so no error signal ever passes to earlier layers. The ReLU has diminished.
If instead leaky ReLUs are used, the gradient is never 0, and this problem is avoided. Refer the plot below:
Background points: Supervised models from facial expressions
Conventionally, for normal facial emotion recognition, input images including the face region and facial landmarks are detected. This is followed by spatial and temporal features are extracted from the face. The crucial facial locations are also spotted. Subsequently, spatial and temporal features are extrapolated from the face and multiple pixel locations. Finally, the facial expression is distinguished based on one of facial categories, while incorporating pre-trained pattern classifiers. Keeping this basic recognition system intact, in case of video analysis the strategy experiences plenty of variations.
We observe that deep learning based approaches specially for video analysis of pervasive games.
Expression of facial mood analysis, emotion recognition and activity recognition always have been considered as the most successful domain of research. In this context, convolution neural network with temporal averaging and pooling operations can also be proved basic tool of research. These are widely used approaches for the spatial aggregation of information. The performance of pattern recognition models have been greatly improved with DNNs. Recently, a series of new neural network architectures have been proposed, such as auto-encoder networks [18], Convolutional Neural Networks (CNNs) [10] Deep Belief Networks (DBNs) [19] or memory enhanced neural network models such as Long Short-Term Memory (LSTM) [20] models. These models have been deployed in different versions for multi-modal recognition tasks such as in speech recognition. For instance, [21] proposed a Multimodal Deep Auto-encoder (MDAE) network to extract features from audio and video modalities. Primarily, a bi-modal DBN was trained to initialize the deep auto-encoder and then the MDAE was further customized to reduce the reconstruction error. In another study, [22] narrated a temporal multimodal network known as Recurrent Temporal Multimodal Restricted Boltzmann Machine (RTMRBM) to simulate audiovisual sequence of data. DNNs have also been used is gesture recognition. In [23] the authors use skeletal information and RGB-D images to distinguish gestures. However, specific human computer interactions must be analyzed, which can predict to understand player loyalty and to anticipate when they will stop playing a game [24]. From the analytical perspective, this paper can extend that contribution. The contribution of the paper is to design multi-facet mathematical perspective to distinguish the emotion of individuals or group and in-turn the interaction paradigm of people could be conceived.
Related works
As the physiological signal measures too is collected from the human activity itself. Hence trend of using deep learning has also been referred recently to record and reflect people information of activities Challenged task is to synthesize the concept that how much and how far characteristics of physiological signal can impress emotion level. In the context fuzzy logic based decision rules for classification and evaluation of the level of functional states on two blocks of heterogeneous characteristics are referred. They are the subjective test questionnaires and indicators describing the human attention [42]. More emphasis on convolutional neural network (CNN) is given towards pattern and object identification as it is referred in [43]. Hybrid intelligent system has become more acceptable in control dynamics and prediction system as well [44].
However here features identification will be more suitable than feature selection and optimization, shown in by different novel intelligent techniques for better convergence and run time techniques.
Emotion and its expression in the form of physiological changes is highly acclaimed topic in research. However, till this article is written not much research breakthrough are available. It is worthy to detect psychological and emotional state with physiological input of human being [5–7].
From the perspective of behavioral psychology, psychology and emotion analysis, it is obvious that emotion cannot be coined as isolated behavior. However, due to its repetitive patterns, it seem to distinguish the emotion of specific emotion class. Thus, presence of emotion becomes deliberate to impress human behavior to some extent.
Emotion recognition and identification pivoted mainly on physiological signals, has been considered an accomplished research. The research is commissioned to detect mental health care, security, driving assistance, and personal well-being. There are a large number of devices, often linked to mobile phones, using body measurements to provide feedback to users in order to improve their lives both from the point of view of self-awareness and well-being. These measures are also of great importance for therapeutic purposes and need to be developed.
The recognition of emotion through rudimentary physiological signal also may assist for daily interactions across the society. Hence, a more balanced emotional exchange could be possible. The important aspect of emotion recognition and physiological signal to explore possible trusted relationship between physiological parameters and emotional contexts. For example, it is not because that the values associated with emotions by supervision as anger, anxiety, fun and joy cab assure a specific emotional state of an individual is. As In supervision process, there is a possibility of bias. This is due to there are uncertainties of in the range of values, their combinations and moreover it differs from person to person irrespective of the situations. However, electroencephalography as suggested by [11] should be treated as major process of such emotion recognition. In addition to that other suitable methods like galvanic skin response (GSR), Electromyography (EMG) from various references to consolidate the expanded process of physiological signal.
ECG dominates as a major interface between physiological data acquisition and their respective correlations with different emotion states. Research in [12] has put a deep insight on these aspects. For instances, they deployed ECG signal to detect negative emotion. In the work, as a whole 28 features were analyzed.
These features also including 7 derived features from linear relationships, 10 nonlinear features, 4 time domain features (TD), and 6 time-frequency domain features. The highlighted part of the work is mainly to put emphasis on classifier since they incorporated 5 different classifiers including SVM, KNN, RF, DT and GBDT. Their performances are also compared. In the study of [5]. The authors referred EMG, EDA, ECG and other signals from 8 participants and included the research kit. This is to mention that this kit is a wireless real-time bio-signal acquisition unit with a combination of physiological sensors. They also deploy machine learning based classification schemes like SVM, KNN, Decision Tree (DT). In terms of the performance, DT yields the highest precision with the ST, EDA, EMG signals. Analysis derived through specific game; ideally they are targeted to virtual reality [14]. The authors suggested an innovative GT-system, which fosters the real-time monitoring and authorization of psychological signals. An electronic platform (R-TIPS4) was set to acquire the ECG signal. Digital signal plays a crucial role in the ECG paradigm. Hence, different filtration methods assisted by a hybrid mode of wavelet transform was developed for EEG to solve the problem [15]. On result, the scheme considerably improvises the recognition performance compared to the other conventional component analysis algorithm. Practically, noise is the persisting phenomena in all physiological signal studies. In [16], the authors compared three filtering algorithms, primary principal component analysis (PCA) and multi-scale principal component analysis (MSPCA). The evaluated rates of convergence were 78.5%, 84.72%, 99.94% for PCA, ICA, MSPCA respectively. In more recent works, it has been observed that the eye-blink type of physiological signal could have impressed the signaling aspects and thus in data acquisition with analysis. Therefore, empirical mode decomposition (EMD) is deployed to isolate the eye blink portions form EEG. The EEG signals blended with eye-blink was further spited into a series of intrinsic mode functions (IMFs) by EMD [17], where some IMFs signified the corresponding eye-blink. Certain cross domain correlation algorithm was also designed backed-up by an appropriate template explored from the contaminated segment of EEG. This will be significant to introduce reduced distortion to the brain signals and efficiently put a neutral effect towards the eye-blink artifacts. Similarly, Db-4 wavelet was applied to conduct continuous WT (CWT) for the EEG signal [6, 7]. Importantly, feature extraction is one of the main foundation block of any machine learning and intelligent algorithm.
The high level proposition with respect to the feature acquisition of the bimodal deep auto-encoder is functional for trusted recognition [19] Here, two restricted Boltzmann machines (RBM) comprising of of EEG and eye movements were designed. The common features across, extracted from the BDAE were further propagated to the SVM. ReliefF algorithm was commissioned on account of its efficacy and computing compatibility [20]. The specialty of RelifF is to extrapolate the functional features to isolate them from the examples, which are proximal to each other. In the work of [19], the authors initiated maximum relevance and minimum redundancy (mRMR) to drag additional features. Models like hidden Markov model (HMM), Bayesian network (BN) are responsible to deal with similar contexts. A BN was developed to blend the features from EEG and ECG for effective recognition of emotions [20]. In the work of [21], several statistical features were fed to the CNN and DNN. Recorded accuracy of 85.83% outperforms the similar works of the category of DEAP. In the work of [8] dynamical graph convolutional neural networks (DGCNN) proposed relations between EEG channels through adjacency matrix. This had created more prominent results with differentiated feature extraction techniques. This results in recognition accuracy of 90.4% [13]. DE features were extrapolated and subsequently, DBN was applied in mapping the targeted features. A higher-level characteristics space was created, and observed peak-value accuracy of 95% (approximated) for multi-classification was recorded. In the work of [23], instead of the manual feature extraction, the raw EEG, EMG, EOG and GSR signals were directly fed to the DBN, and optimal features according to the data distribution could be extrapolated. The recognition accuracies of 78.28% and 70.33% were recorded for valence and arousal on the DEAP database respectively. Practically, semi-supervised approaches are the common methods of matching such physiological signal and the appropriate emotional contexts. SVM was also used in [24]. Here also the concept of classification of EEG signal was. Researches [19, 31] demonstrated a better accuracy using one-way ANOVA and other semi-supervised deep learning approaches. The major classifier applied in the 6 references on DEAP was SVM. Neighborhood component Analysis was applied to improve the KNN performance [26] psychiatric diseases [37, 39] and in-groups or out-groups also are addressed with respect to signaling and emotion approval. Hence, selecting an appropriate classifier solicits trusted pre-processing approach. In case of reduced numbers of samples, linear classifier is perfect. The data should be more segmented to acquire more semi-supervised patterns for initial guess.
Regarding the emotion-classification framework, both analytical and preprocessing steps with respect to the model-free vs. model-specific perspective, should be considered. However, conventional emotion recognition systems are used to classify the specific emotion states. The trigger of switching of emotion is although a segregated concept. As stated in [4, 39], we agree that the combinations of physiological signals will lead to significant improvements in emotion recognition. This motivates to incorporate certain challenging auto- recognition of emotion using proposed EMDeep model. We are not essentially proposing a simple classifier model of emotion states, rather we try to label the state in a more deterministic way. Therefore, the proposed model doesn’t reply on EM model solely. Additionally, for improved forecasting of emotional state from physiological signal, it also refers SVR as a supporting approach.
Mathematical constitution of emotion class and physiological signal
Unlike the facial expressions, physiological signals cannot be manipulated. This characteristic makes them a robust alternative for emotion recognition systems. Therefore, more such technology can envisage different brackets of emotional states from different communities of society having different framework of emotions.
Following this paradigm of approximation and correlation of physiological signal and possible emotion class can be given as follows:
Given a test input containing the 4 types of physiological signals, each participants provides a weighted prediction of the different possible emotion classes that the input is likely to be constituted of. However, as the labels of emotions are not available as supervised model, therefore, only it can be referred as class ranks and ids, without any appropriate labeling of emotion.
Next, all the weighted predictions from the 3 random participants are concatenated in a matrix in order to compute a mean weight vector that will consolidate any random different criteria. Finally, a discrete yet feasible emotion clustering is obtained by computing the emotion for which the maximum mean weight was computed.
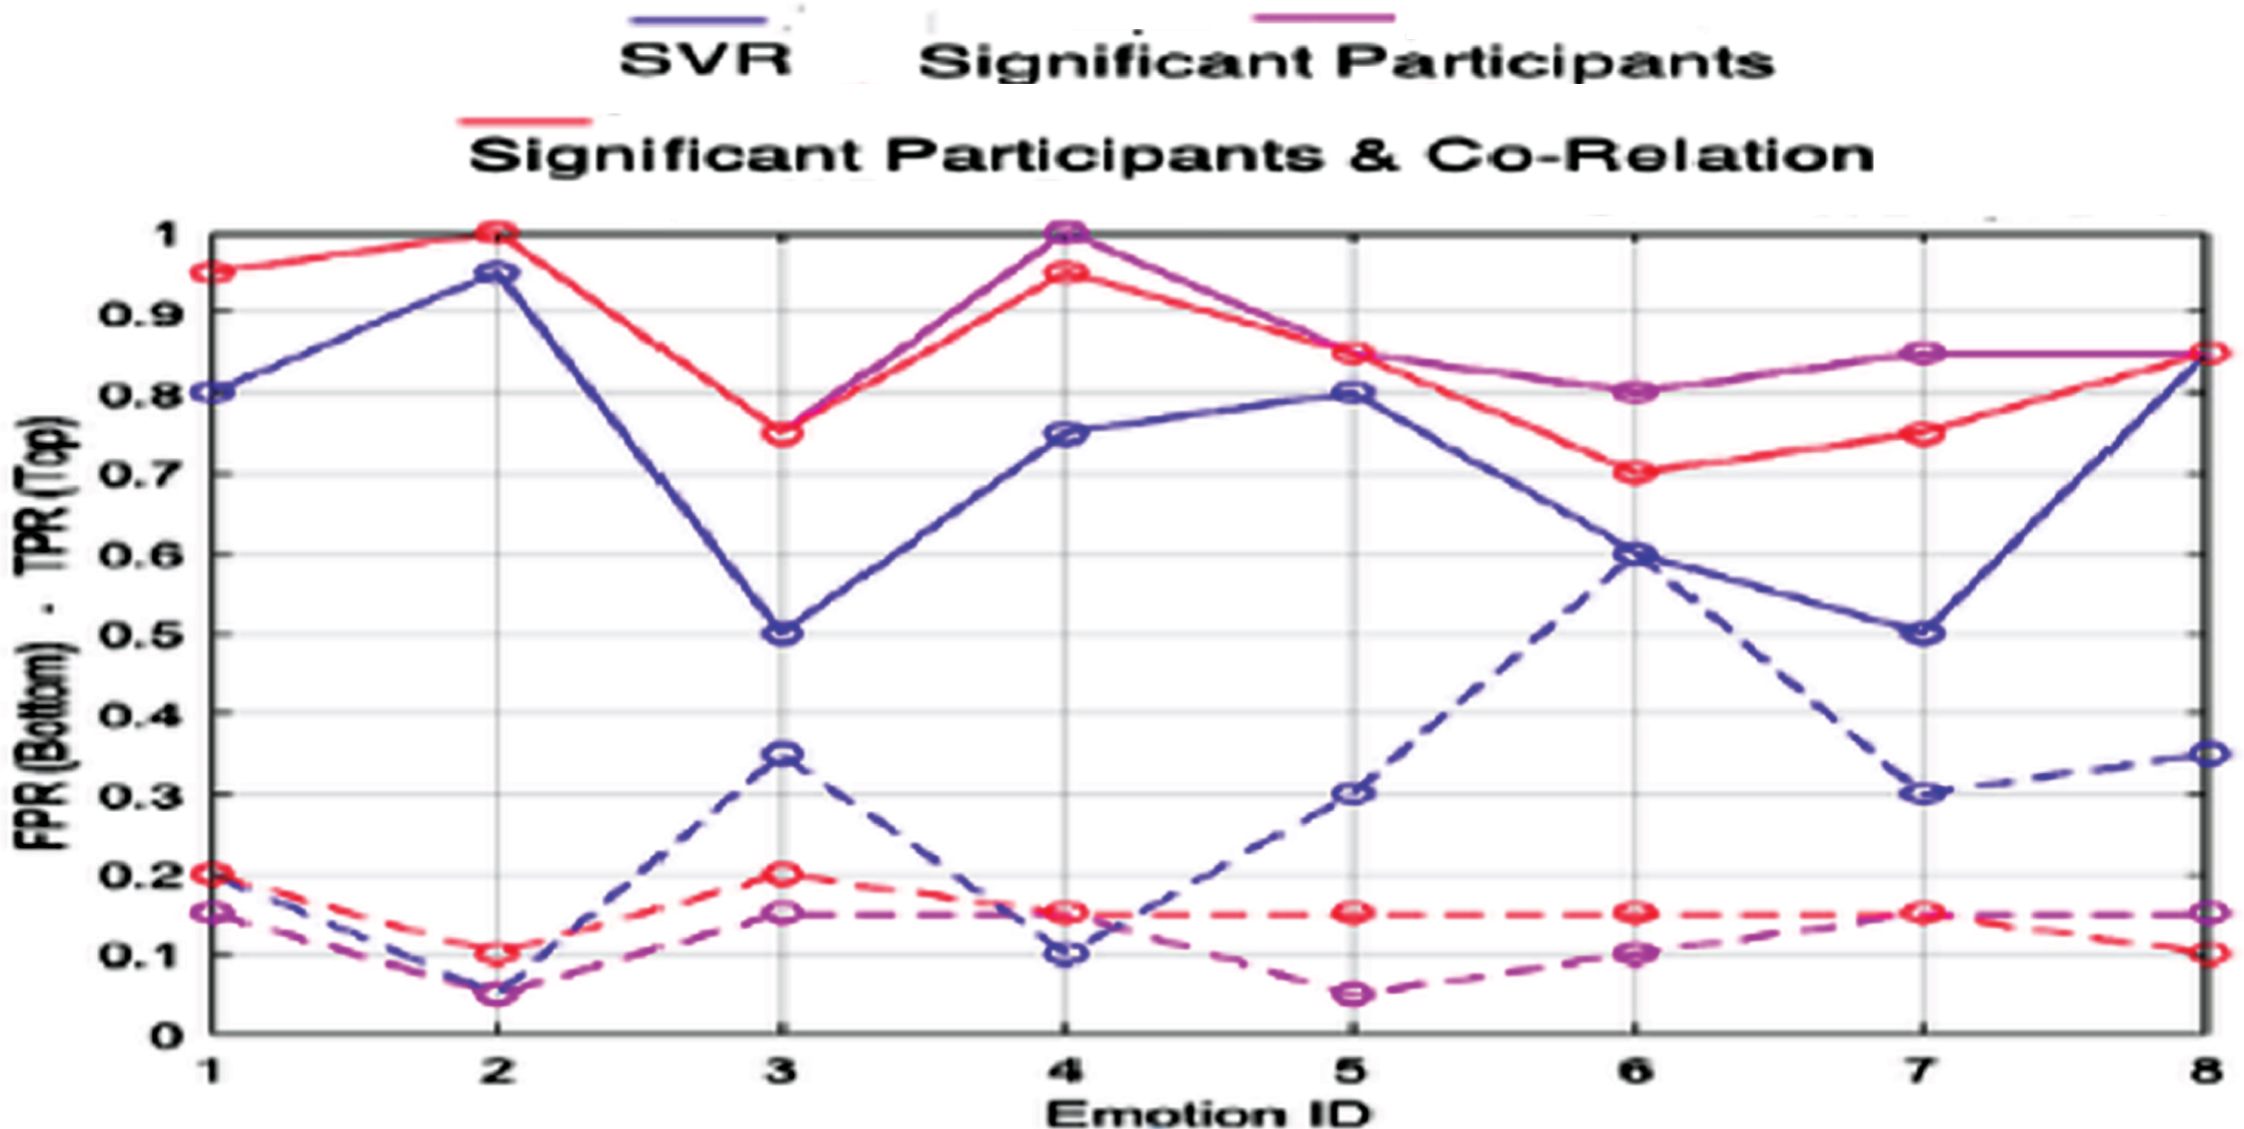
True Positive Rate – TPR (solid lines) and False Positive Rate – FPR (dashed lines) curves for each of the target emotions under the scope of the given proposed methodologies. It should be noted that the proposed weak learners with and without correlation analysis outperform SVR by achieving a higher TPR and lower FPR.
Significance of TPR and FPR
Analytically, this section describes briefly concerning the independent convergence for each of possibility of emotion. In the Fig. 6 it is demonstrated that in the group of experiments mentioned in Appendix, there are 67 experiments, ranging in duration from 5 to 25 minutes each for 23 participants. In the proposed model, we select only 3 experiments.
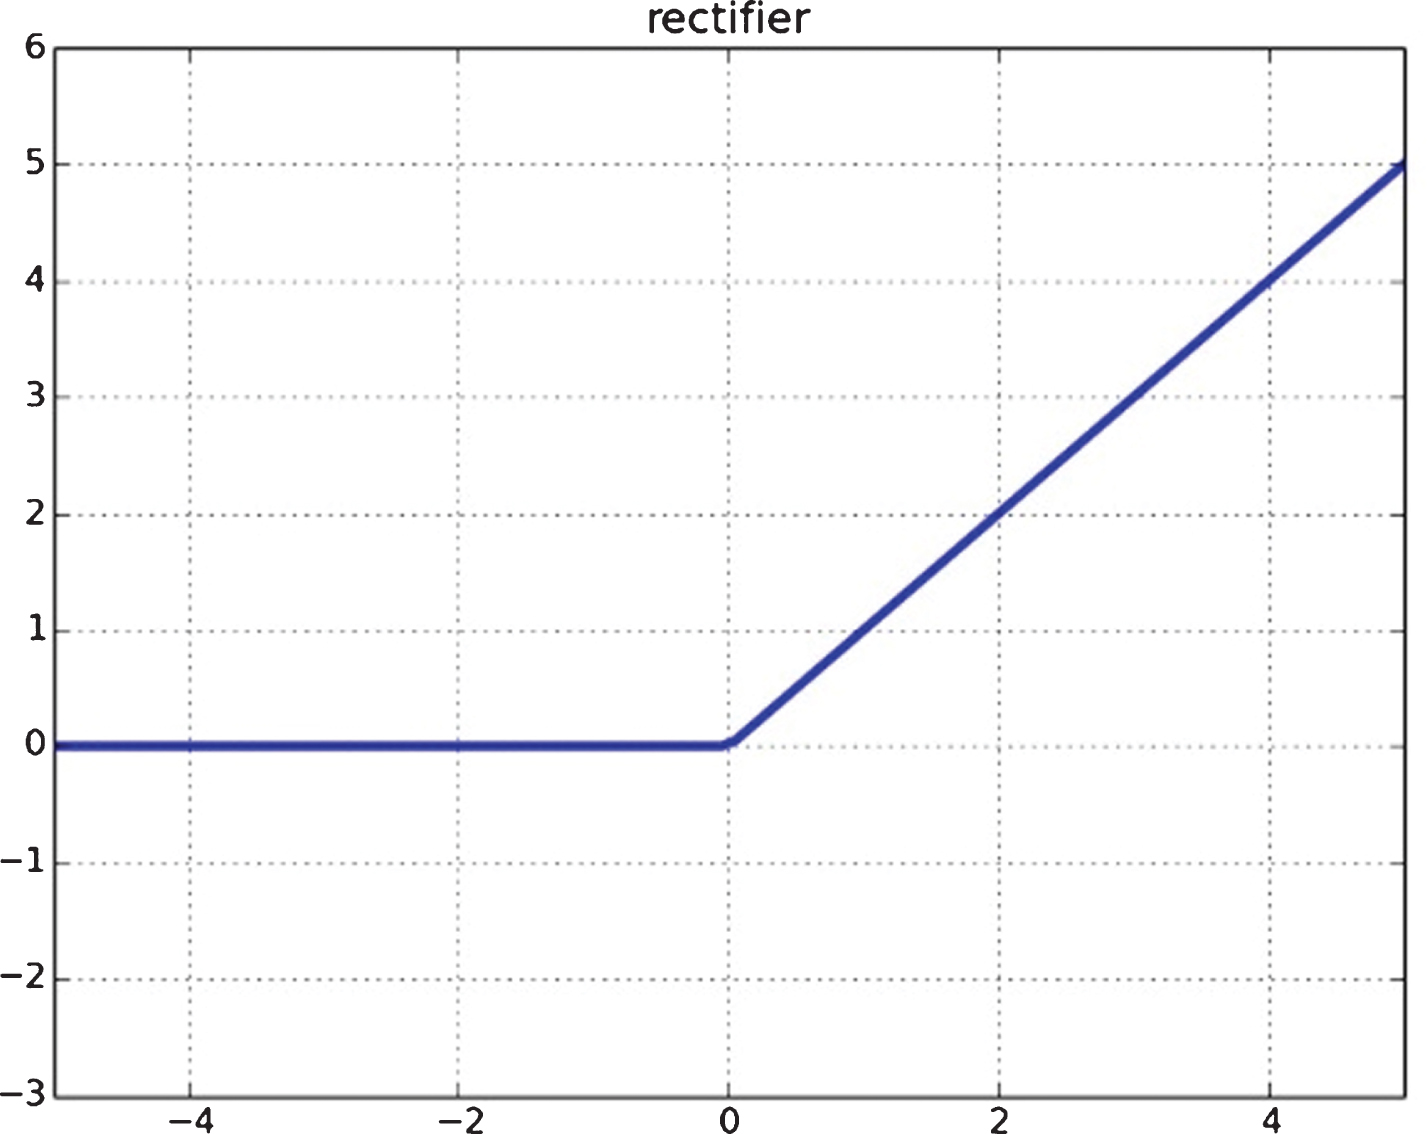
Effect of Non-leaky ReLU.
Gradient issues of Leaky ReLU.
Emotion Class Analytics through SVR characteristics.
The quantitative data collected are in csv format. However, broadly, there may be different behavioral trend of participants irrespective of their physiological signals. This is because without any supervised status of emotion (to be explored from physiological signal), there will be no correlation available for participants. There may exist some guess/hints with emotion correlated with physiological signal. Hence, convergence of analysis falls under the categories of SVR and with certain participants (with available guess about their emotion and behavior) during the experiments and others, who are quite inert in their Fig. 6: Emotion Class Analytics through SVR characteristics. It is highlighted both the participants with guess emotion and inert one may outperform (as both these cases are bit ideal ones) SVR. However, SVR (part of EMDeep) has most realistic and believable result with respect to TPR and FPR segments.
The expected output of Embedded can be presented in the next subsection.
We want to classify the maximum expected guess of emotion class. However, there is no availability of training data with subsequent iterations, hence, we introduce the classification model as support vector regression.
The SVR is close to SVM, although there are sharp differences as SVR introduces the regression problem and SVM is classification problem. In the present problem of unidentified measure of emotion class, we require continuous value rather than a discrete value. SVR provides a continuous value as sample point to reach towards final classification. Broadly, SVR will undertake regression analysis between the starting set and the Gaussian mixtures of each physiological signal measures for each entropy of signal (however, in this article, we have not incorporated any digital filter to remove any deliberate noise from the signal itself. This will avoid to reduce biasing of input), whereas classification will classify each signal entropy according to the reference dataset that obtains from semi supervise training data (or spectral library) with associated class labels. This will indicate a pilot data values available from the standard medical data set.
We consider the maximized guess value from Expectation-Maximization procedure and the scattered value will be fed to SVR. SVM for classification involves assigning one slack variable to each training data point, whereas in SVM for regression, there are two slack variables for each semi-supervising data point.
The constant C > 0 determines the trade-off between the flatness of f and the amount up to which deviations larger than x are accepted.
Analogously to the “soft margin” loss function [30], which was used in SV machines by [31],
Choice of kernel will determine the asymptotic behavior of the final clustering, if it becomes relevant. However, more self-explained discussion of SVR process could be more pertinent to describe its role in this proposed hybrid model.
The input pattern of emotion cluster correlated with specific measure of physiological signal and their values (for which a possible forecasting of clusters has to be derived) is encompassed into feature space by a map F. Then dot products are computed with the shadow clusters of the pilot patterns of semi-supervised data under the map F. This corresponds to evaluating specific kernel functions k (x n , x). Finally, the dot products are summed up using the weights n i = (a n - a * n). With the expression including the constant term b yields the final forecasted possible clusters, if found to be similar.
The output possible clusters is demonstrated on raw data collected from sensors. The output class is divided in two sections:
In the Fig. 7 while investigating the output of probable emotion clusters with EM algorithm, we observe that in this snap, we first generate a dataset of points from two normal distributions and label the dataset. This dataset with correct labels are the pilot values (not exhibited to the experiment). Then, the labels are randomized as real data and execute the EM algorithm for the new dataset. The EM algorithm clusters the dataset correctly and also estimates the parameters of two normal distributions that could be used to draw the points.
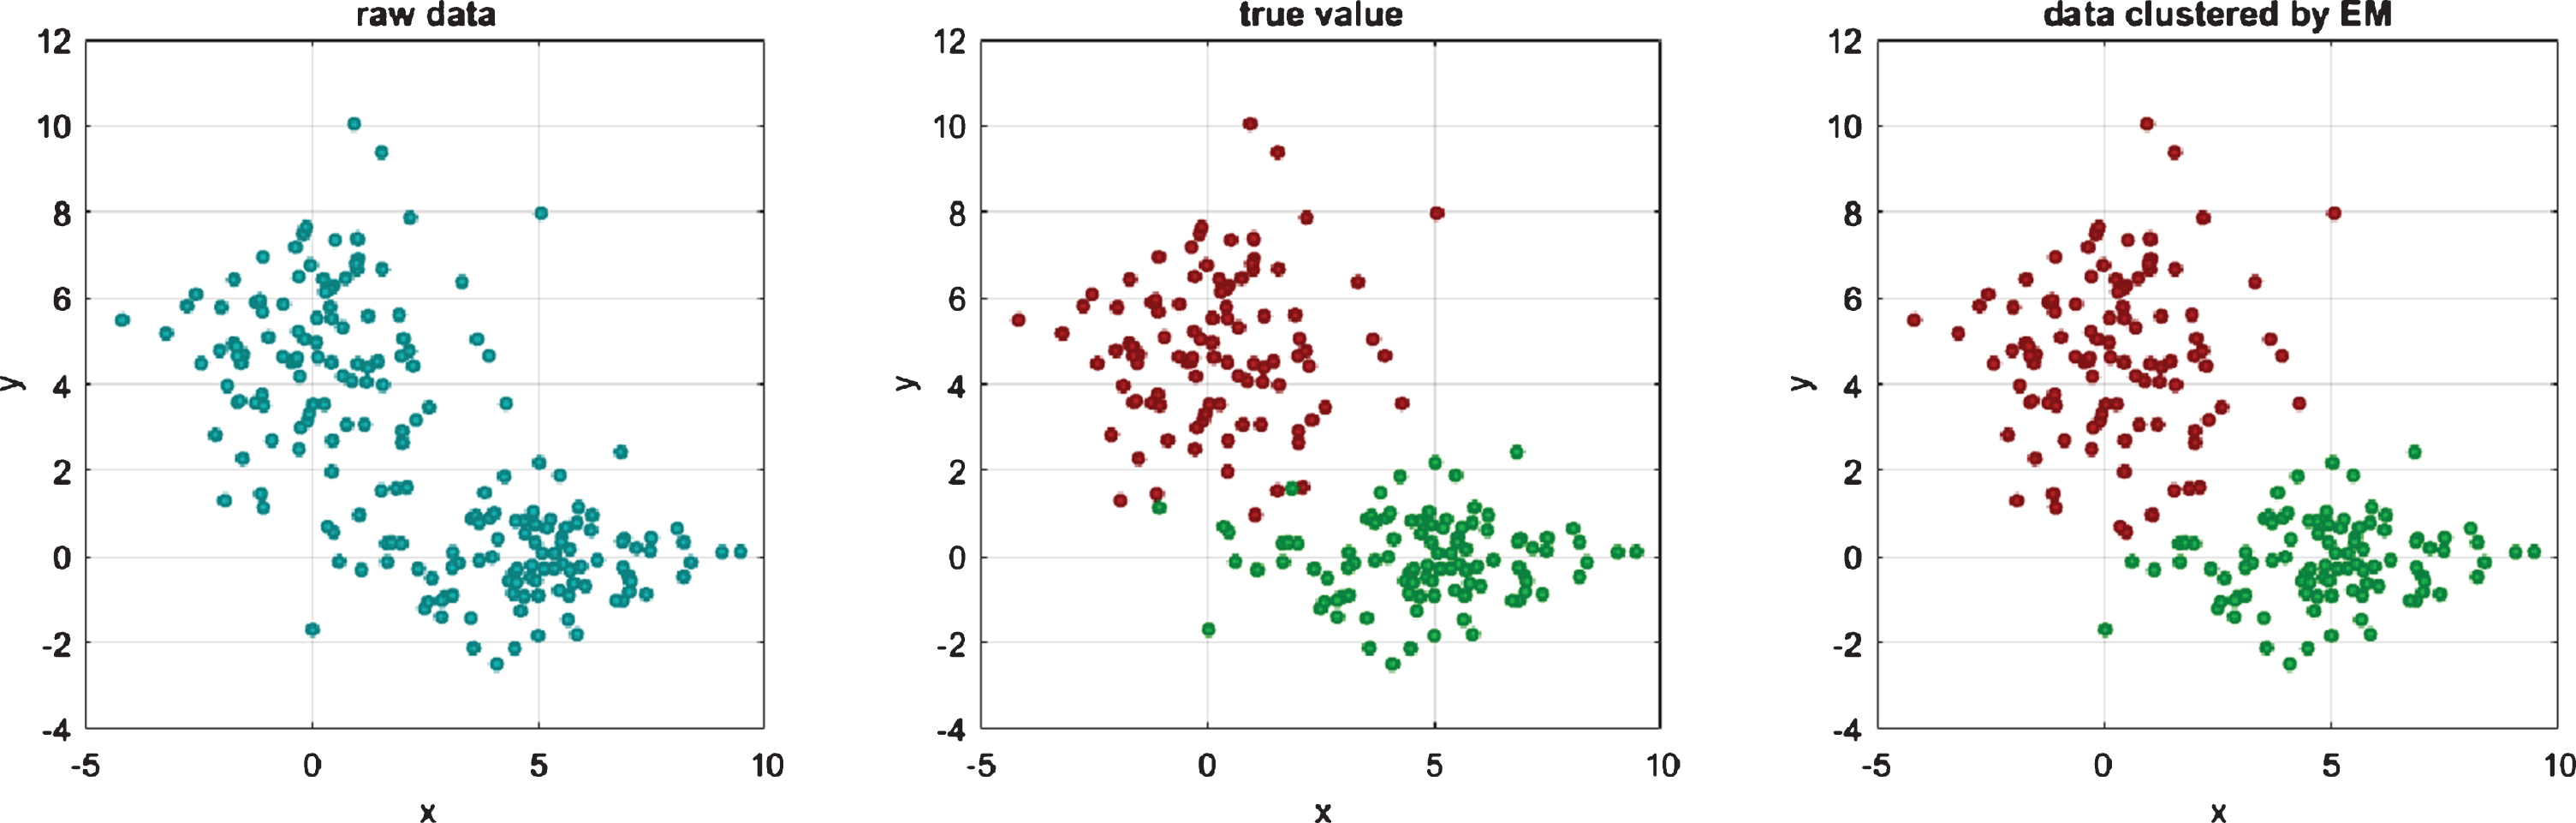
Probable Emotion Label Identification: EM output.
Fig. 8 describes the classification of clusters as derived by final EMDeep algorithm. Bivariate (variation of physiological signal/ probable emotion class) scatter-plots demonstrates the classification reached by each algorithm e.g. EM and support vector regression, corresponding to the same probability space of emotion class and exact initial conditions. Clusters are denoted in different colors. In the right panel, the variables determining the final threshold regions are depicted as dashed lines and dot-dashed lines. The centroids of each cluster are shown as black dots. In the left panel, the EMDeep yields an output clustering that is difficult to link to a clear semantics. In addition to right panel also expresses that proposed EMDeep is driven by the threshold value for SVR, forcing the centroids to lay within the associated regions, yielding a final clustering that can be clearly interpreted in terms of L/H values of the variables (orange:LL, red:LH, cyan:HL and blue:HH). The matching among binary regions and classification is not appropriate as data-points are assigned to clusters depending on their weights, not on the threshold values. In this case, the EMDeep outperforms (the clustering likelihoods are-3.3368 and – 3.2180 respectively), however, this result can not represent any generic class of emotion values. However, after the possible clustering through SVR (Support Vector Regression) the clustering and labeling could be more decisive.
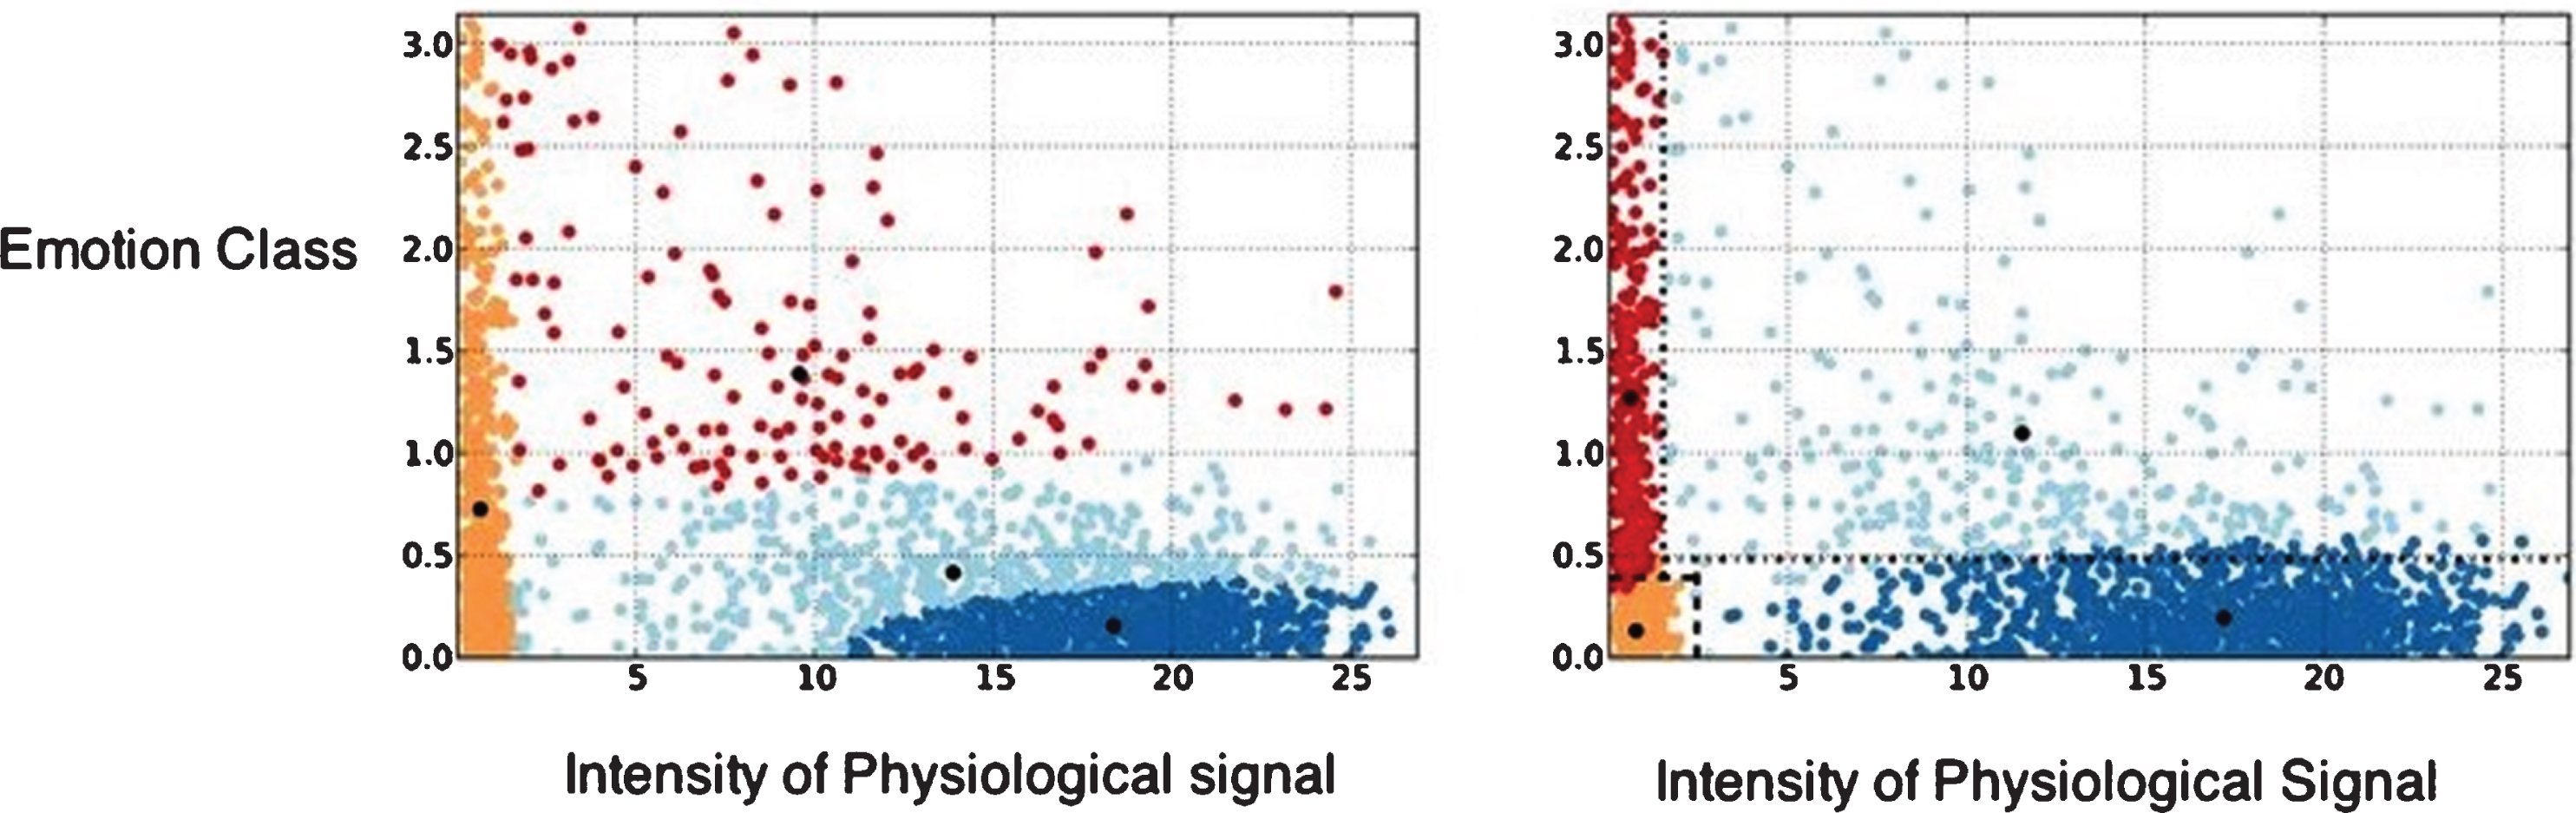
Final significant Probable Emotion Class from Embedded Physiological Signal.
As the final clustering is dependent on the final support vector regression process, hence following analysis has also been incorporated:
By preprocessing the EM output data, we include normalization with certain ranges of intensity values. For the purpose of processing, non-numeric data to be converted into numeric data.
To find more affinity towards values, we initiate simple linear kernel, with single parameter C (penalize parameter). It is a process to normalize the skewed data in more specific labelled one with conventional radial kernel, Here, two parameters (C and gamma) are assigned. This is one of the leading property as depending on the type, nature and size of the kernel parameter, data either to be over-fit or under-fit. To avoid over fitting, the method of n-fold cross validation is referred. This signifies that total numbers of validations will also follow more high-dimensional distribution.
Certain interesting observations are made: Initial stages cluster of emotions are subjected to be more scattered, in the second part of the figure, we attain more zoomed result. However, still there will be some patches of clusters, on which no correlation of physiological signal can be established and thus apart from label “emotional state 1” and “ emotional state 2”, it will be denoted as “mixed content of emotion class ”. Green and red scattered patch represents the certain confirmed state of emotional content. As we mentioned, that there is no specific supervised data for detecting the emotion class is available, therefore we gradually accelerate semi -supervised value of learning rate both for the training of nearest emotion class followed by final classification. The classification will confirm the presence of specific emotion content or mixed contents of emotion as shown in Fig. 9.
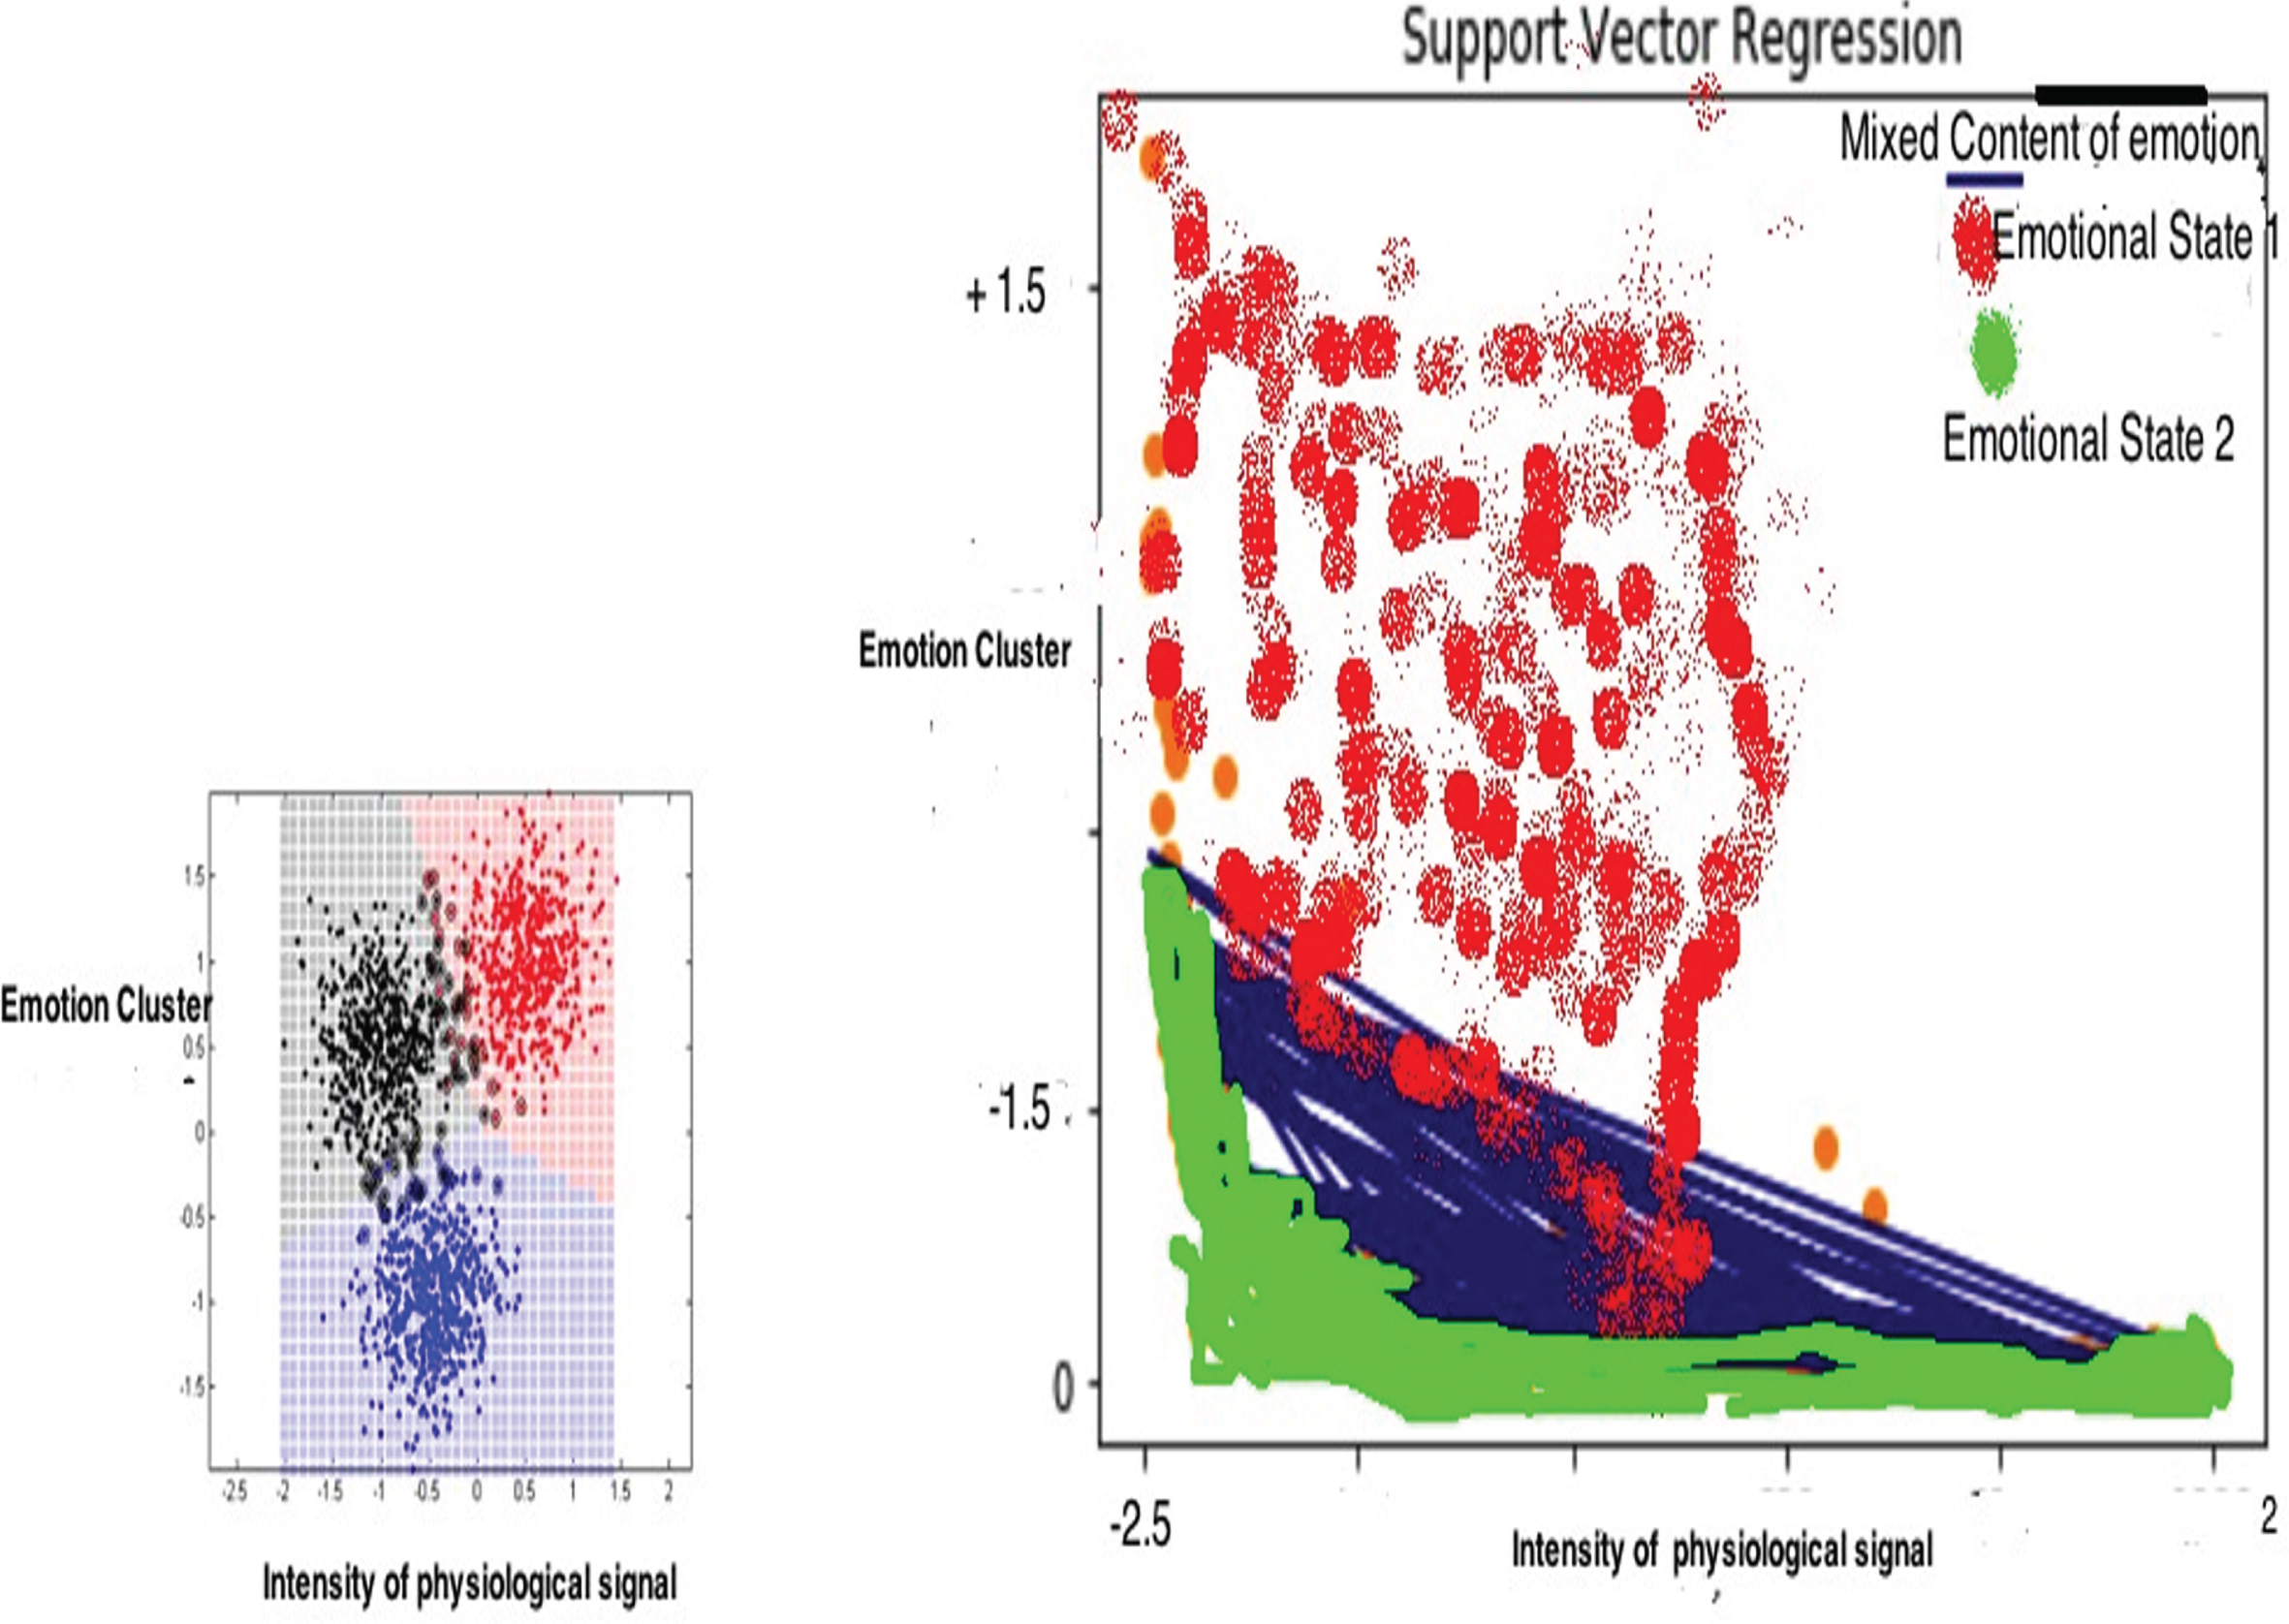
Label clustering based EM output through SVR.
The following table demonstrates such instances of numerical value driven semi-supervised mode of training or learning. It should also be noted that data size and features are gradually moderated to investigate the specific point of iteration, where from the model will start responding towards precise contents of path for presence of emotional values. The features corresponds here to the different spikes of the collected physiological signals. It could be linear, Gaussian, sigmoidal, polynomial, trapezoidal, triangular and may be the heterogeneous distribution of all of them. In the proposed model, Gaussian model is used, which indicates unbalanced and unlabeled mixtures of data. For experimental purpose, the model doesn’t use the signal filter, as it could foster other areas and more computational complexity may be enhanced.
There are significant values as shown in Table 3. Initially, data size is fixed, even the features to be classified are enhanced there is no corresponding values of svRSemi-train and svRCLASSIFY is found. However, once the features are increased and the training value (svRSemi-train) is assigned as 0.01, then svRCLASSIFY started classifying the content with more compact values. The green and red patches in Fig. 9 consolidates this fact.
Ranges of Emotion Probability Class
Acceleration from semi-supervised mode to Precise class Content of Emotion
However, we also consider the other folding techniques (folding techniques are the basis to classify as vector of classification)
These notions motivate to test the final label of emotion classification; We found appropriate classification over the specified ranges of signal (marked as bold-black), however, ideally data becomes closer to be labeled classification (blue-marked). Fitted SVR with green markup representing the ideal value (Refer Fig. 10), which is not too far than the appropriate classification. Thus error value will more diminished and the classification label becomes deterministic. -v n: n-fold cross validation -t 0: linear kernel -t 2: radial basis (default) -s 0: SVC type = C-SVC -C: C parameter value, default 1 -g: gamma parameter value
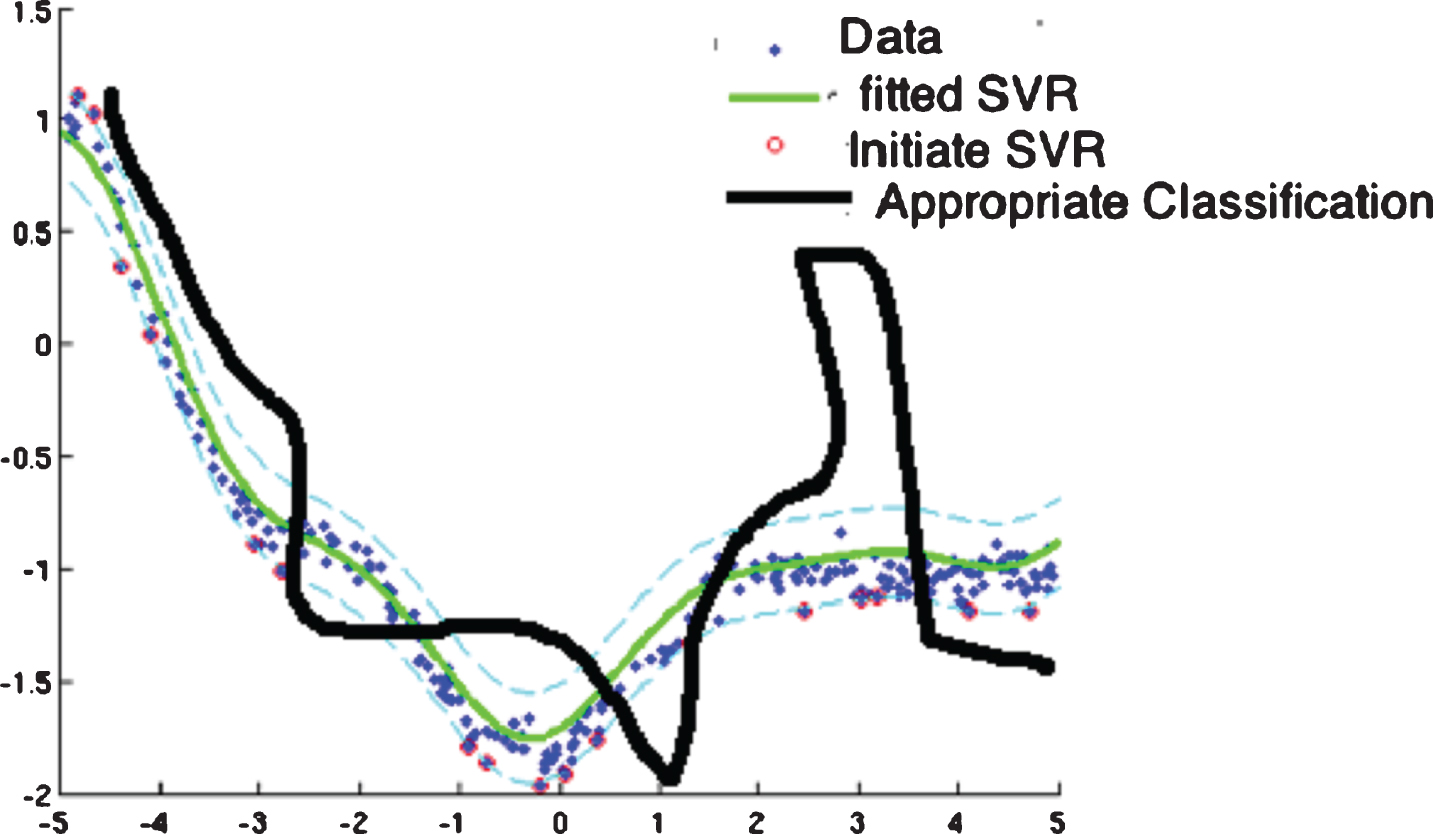
Better Error Approximation through SVR.
The results presented here has been summarized from the proposed hybrid model of EMDeep. Till this article is formulated, the works concerned with machine learning in the paradigm of emotion identification from physiological signal majorly discusses different clustering outputs. Different existing models like SVM and KNN, experimented on certain specific databases like: Database for Emotion Analysis Using Physiological Signals (DEAP), MAHNOB Database and SJTU Emotion EEG Dataset (SEED). In this section, we will try to analyze the proposed model of EMDeep with respect to these databases.
DEAP is a database for human emotion analysis [34]. As it consists of 32channels, in corresponding the present experiment, it supports to match with GSR and respiration values respectively. On the other hand, MANHOB consolidates multimedia labels of physiological response data [35]. It also assists to collect respiration and skin responses. Even investigating emotion dimensional space model, psychologists found it interesting to explore that there are likelihood correlations. For example, distinguished emotions, such as hatred and hate, pleasure and best choice, which signify a certain degree of specific emotional level. On the contrary, the emotions with the synonymous semantics may have of specific emotional level(s). Lang [36] explored that the emotions can be visualized in a two dimensional space by valence and arousal. In this perspective, it was suggested that the emotions can be categorized in a 2 dimensional map through valence and arousal. Valence denotes the values from unpleasant (negative) to pleasant (positive), and arousal ranges from indirect (low) to direct (high). This signifies the intensity of human feeling towards specific cluster or likely cluster of emotion. The SEED database [37] comprises value of EEG and eye-movement of three different emotions (positive, neutral and negative).
Considering the standard features of these 3 available data sets and synchronizing them with EM-Deep model, there are significant observations while referring Lang [36] for valence and arousal emotional class.
For the proposed EMDeep only analytical results can be presented, as there was no supervised class available for training.
The comparison demonstrates that SVM is widely used with KNN for classification, however, no semi-supervised or unsupervised approach is initiated. From Fig. 6 of True positive and False positive classification and with the proposed approach of EMDeep, we validate following comparative snaps:
We investigate certain portion of the plot shown in Fig. 6 and while exploring the mean it is observed for both data bases EmDeep can perform better than (SVM + KNN) combination in-spite of mostly un-supervised data instances. Therefore, here data values and guesses from EM guides the analysis process instead of supervised data. In terms of percentage of arousal and valence mapping, EMDeep 74%, 71.2.3 %, 82.3% and 78.4% with respect to the DEAP and MANHOB data base (Table 4).
Analytical Comparison for EMDeep
Analytical Comparison for EMDeep
The objective of this work is to identify the emotional states of individual or a group while envisaging a specific task e,g. participation to play a video game primarily based on the arousal of their physiological signal measures. There are contemporary research works, which discuss such identifications incorporating machine learning as a tool. How to compare, conventionally, they either used classifier to compare the close values of statistical similarity of emotion contexts and to establish how they accomplished a more precise classification. Autonomic identification of emotion labels from measured and experimental physiological signal could be definitely a novel one. Most importantly, the proposed model is based on hybrid and statistical aspects of machine learning combining expectation maximization (EM) and support vector regression (SVR). Both mutually demonstrate that the states and observations of the data are latent and unknown. Therefore, the experimental performance initially reciprocates the guess and best approximation resemblance of the proximal emotion class. To ensure more precise SVR is introduced. The highlight of the work is it never claims that detection will be best precise. Like human inferences, the recognition may experience ambiguity too. Subsequently, the work solicits certain more hybrid techniques to envisage the embedded uncertainty with inherent physiological data acquisition methods like ECG and EEG. Reason being is the arousal of a signal from a particular method with a specific parameter may not be deterministic. It will be more adaptive, if there will be balanced combinations of those processes and parameters to attain a decision on specific emotional state. Hence, fuzzy logic backed-up through a deep neural model can be thought of. The approach may open up the scope of more training if required to identify a state precisely. Similarly, if the states are more ambiguous then fuzzy engine can address the inference mechanism to be close like human experts. Emotions are used to respond appropriately to changes, real or otherwise, in relationships with ourselves, between people and the environment in order to maintain a sustained balance. It is not always easy to find. As we have explored, knowing or recognizing emotions is important for the human to feel good and to be able to manage his own emotions that can sometimes be non-functional. Some recent works have been conducted since the 90 s on emotional intelligence concept [41]. It is about the ability to perceive, and to express the emotions in order to understand them. However, at final stage, integration and regulation can be accomplished. This ability solicits to recognize, understand and control emotions for an individual but also it will assist to know how to deal with others is an asset in all circumstances of life for better well-being. For example, studies in adolescents [39] where emotions are particularly increased at this time of life, indicate that it is important to be able to regulate them. Indeed, their mismanagement can lead to pathologies in adulthood. Our method could contribute to this recognition and understanding and thus facilitate controlled status of emotion, with finer and precise classification of emotion class of the proposed model.
Footnotes
Appendix -A
Here choice of kernel becomes significant as initially the experiment begins with linear separable classes, however, in the decision part the results demonstrate non-linear behavior. Therefore, both linear and radial basis function (RBF- non-linear) are combined.