



Abstract
Here, an unique approach is presented for automatic detection of blood vessels and estimation of retinal disorder from color fundus image. This technique can be used to determine the progression of retinal disorders due to diabetic retinopathy, which can help in better evaluation and treatment for clinical purposes. The proposed method combines the Gaussian based matched filter with Kirsch for extraction of blood vessels, and inpainting technique to determine the pathologically affected region. This is tested on various databases (such as: DRIVE, Aria and Glaucoma etc.,). Various performance measures (such as: accuracy, sensitivity, specificity and F-score etc.,) are used to estimate the quality of blood vessels detection. Here, we have applied the segmentation technique to the subband-2 image in 5-level wavelet decomposition by db4 mother wavelet. This reduces the computational time for inpainting. Comparing the blood vessels and the pathologies, index for blood vessel damage is calculated. This index is proportional to retinal damage in case of diabetic retinopathy. Higher index corresponds to significant amount of blood vessel damage. From the index, progression of the disease and condition of the retina can be assessed. The index for blood vessel damage for Im-24 is 2.98%, whereas for Im-18 is 68.78%. This indicates that in Im-18 more blood vessels are affected by pathologies. It also indicates that maximum portion of the retina is affected by pathology.
Introduction
The human eye is responsible for sensation of vision and perception of depth [1]. Retinal blood vessels can be viewed by fluorescent angiography, however storing the angiographic image is unmanageable. Thus fundus image is taken by ophthalmic camera and is used for diagnostic purposes. The fundus image represents the retina, which contains optic disc (OD), macula, and fovea [2]. Various pathological features (such as: hemorrhages, exudates, cotton wool spots, blood vessel abnormalities and pigmentation etc.,) can be detected by observing the fundus image [3, 4]. The range of eye diseases affecting the blood vessels is referred as retinal vascular disorders and linked to high blood pressure, diabeties and atherosclerosis, etc. [5–7]. Hypertensive retinopathy, retinal vein occlusion, central retinal artery occlusion, and diabetic retinopathy are the most common retinal vascular disorders and leads to swelling. Thus retinal blood vessels extraction can play an important role in the diagnosis of retinopathy. However if undetected at later stage these vascular diseases affect the vision and may also result in its permanent loss [8]. Thus a method of accurate extraction for blood vessels becomes indispensable.
A number of methods have been discussed in the literature to estimate the retinal damages. Zhang et al., [9] uses a modified matched filter with double-sided thresholding for enhancing the neovascular net during the proliferative DR (PDR). Welfer et al., [10] uses adaptive morphological approach for detection of optic disc in color fundus images. Pang et al., [11] segment the retinal blood vessels by using bottom hat transformation. These methods segment the blood vessels but not able to detect the damaged blood vessels for assessment of retinal damage or vision condition. Niall et al., [12] finds a relationship between retinal blood vessel damage and cerebral micro vasculature. A similar anatomical relation is present between the macro vascular and the microvascular blood supply to the brain and the retina. Li et al., [13] uses retinal blood vessel diameters for determining cardiovascular diseases. They have used retinal arteriolar narrowing as a grader for cardiovascular diseases. In these literature relation of vascular damage with respect to the pathology is not mentioned. In this paper the vessel damaged is calculated for measuring the condition of blood vessels in retina.
The proposed method described in this paper determines the extent retinal vascular disorder has affected the human eye. To achieve this, an approach for blood vessels extraction [14] and inpainting [15, 16] technique are combined with the extraction of pathologies. There are several blood vessel extraction approaches which include filtering-based methods, mathematical morphology, and trace-based methods. Filtering based methods maximize the response to vessel-like structures, whereas mathematical morphology uses morphological operators to find blood vessels. Trap based method on the other hand maps out the global network of blood vessels after edge detection by mapping the center lines of vessels [14]. Matched filter (MF) is a much simpler and effective method. The Gaussian based matched filter approach is employed in the proposed technique as it can be able to provide better segmentation. Performance measure is evaluated by comparing the segmented blood vessel output image with the marked data by experts. Performance measures like sensitivity, specificity, sensibility, equal error rate (EER), F-score, Dice coefficient (KD), Jaccard’s coefficient (KJ), and conformity coefficient (KC) are analysed. These segmented blood vessels are used as the mask for inpainting technique [15]. The inpainted image helps to separate the pathologically affected region from the fundus image. Inpainting based on Field of Experts (FoE) model is used in the proposed method. FoE is an extended Markov Random Field (MRF) where potential functions over extended pixel neighborhood is examined. However in contrast to the previous MRF approaches all the parameters in FoE model, including the linear parameters, are learned from training data. The computation time required for inpainting can be reduced by wavelet decomposition techniques which makes the proposed method more effective. Five wavelet families such as Haar Wavelet (Haar), Daubechies (db4), Symlets(sym2), Coiflets (coif1) and Biorthogonal (bior1.3) are examined here. Wavelet decomposition decompose the image into various sub-bands and only those sub-bands are considered which carry relevant information about the blood vessels.
In this paper, five level wavelet decomposition is performed by Daubechies-4 (dB4) mother wavelet on green channel of the color fundus image. Image is reconstructed by considering the approximation coefficient of final level and the detail coefficients of second level. Level-2 reconstructed image contains more blood vessel information [17]. To the reconstructed image blood vessel segmentation technique and inpainting is applied to highlight the pathologically affected regions. The pathologically affected regions are separated from the inpainted image.
As in case of diabetic retinopathy, blood and other fluids are deposited over the retina and damages the retina. Deposit over the retina depends on the amount of blood vessel damage. The main objective of this paper is to develop a technique to examine the degree to which the blood vessels in the eye has been affected by the pathologies due to diabeties. This damage provides an index for retinal damage or vision damage / loss. Inpainting technique is deployed to separate the pathologically affected regions of fundus image. Comparing the segmented blood vessels image and segmented pathologies, the overlapping region of the pathologies and the blood vessels are determined. More the overlapping more portion of the retina is affected by pathology. Blood vessel segmentation is performed by Gaussian MF and merging of Kirsch-Gaussian based method. Pathologies are separated by applying histogram based method to the inpainted image.
The rest of the paper is organized as follows. Section 2 discusses the proposed technique. Results are discussed in Section 3. Conclusions are highlighted in Section 4.
Proposed method
The block diagram representation of the proposed method for blood vessels detection and evaluation of retinal disorder from the color fundus images is given in Fig. 1. The major blocks are Gaussian based segmentation, inpainting technique, and histogram equalization. Each blocks are discussed below.
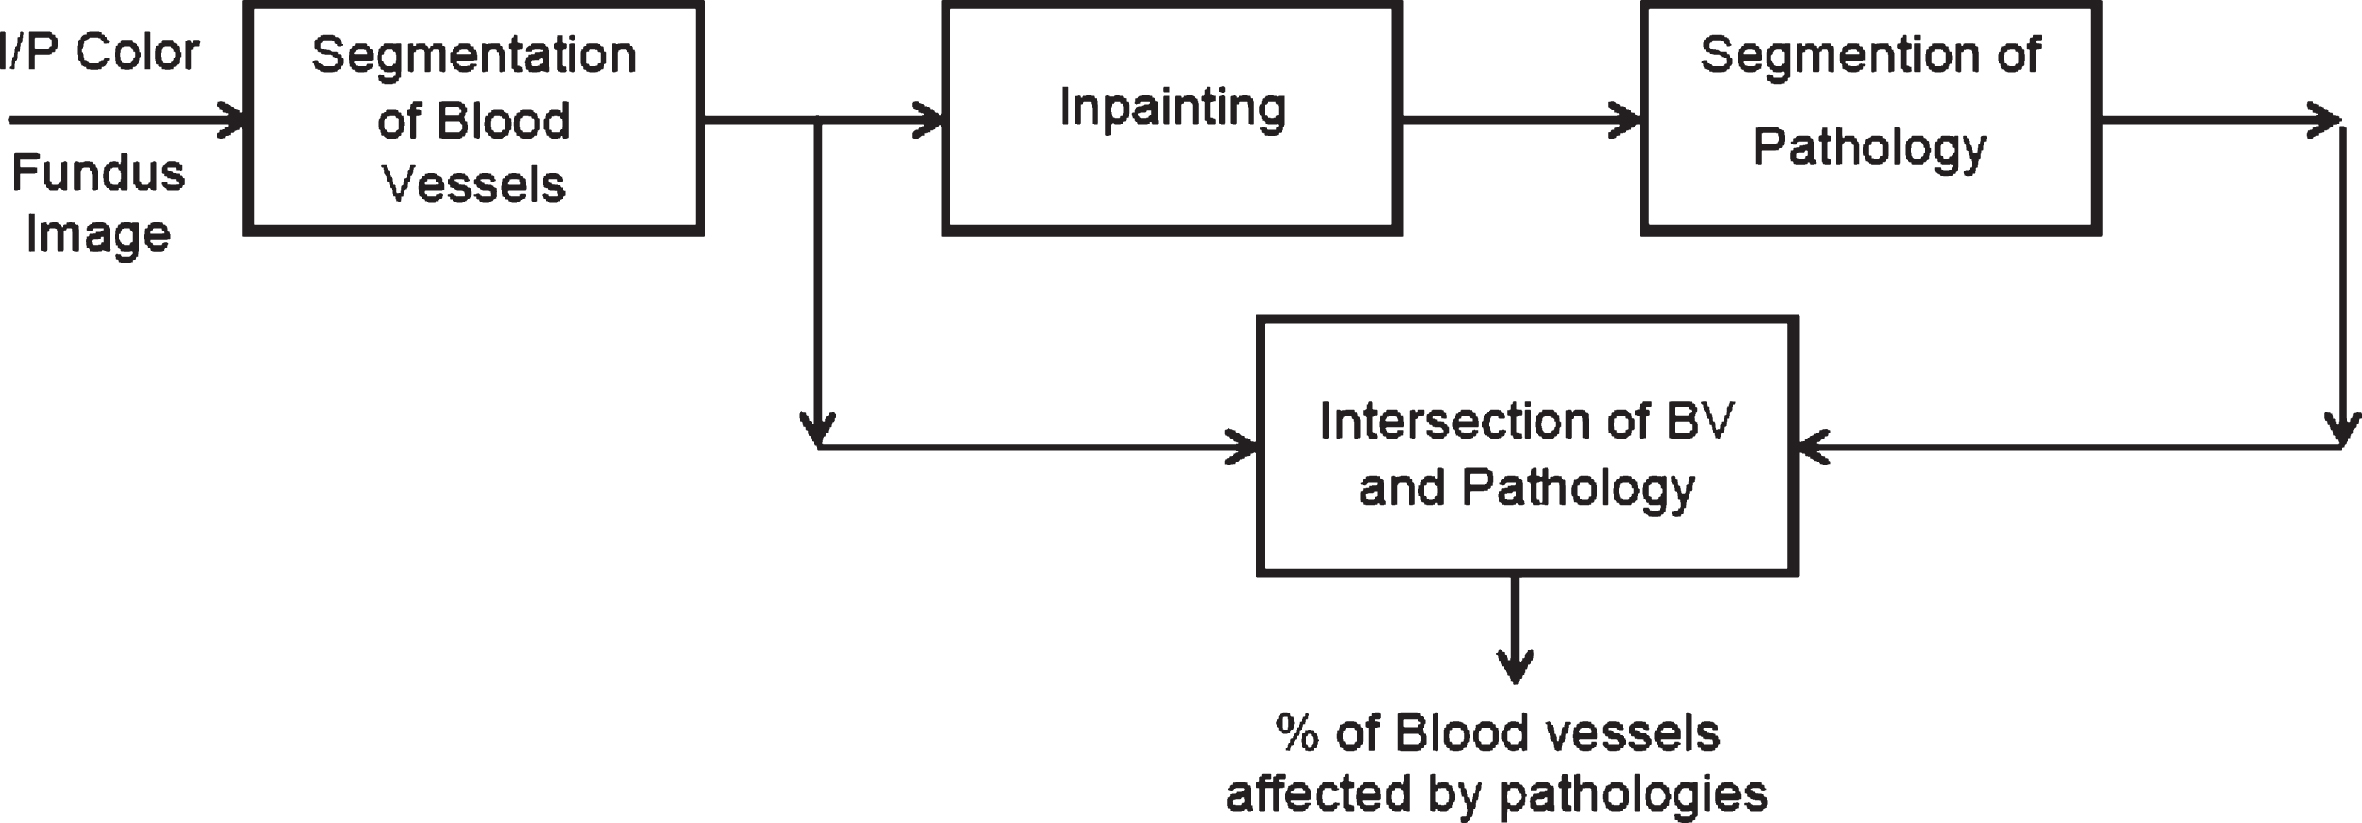
Proposed method for assessment of retinal vascular disorders.
Green channel of the color fundus image has higher contrast between the blood vessels and the background [18, 19]. So, it is considered to enhance contrast of the image, which in turn facilitates the efficient blood vessels segmentation. To the processed image, various blood vessel detection techniques are applied (such as: Kirsch’s method, histogram equalization approach and Gaussian based matched filter (MF) technique).
Kirsch method is a template based method which uses 8 templates by rotating the matrix elements [20]. The templates model 8 different possible edge directions such as, left-right, up-down, upper-left and lower-right. For each pixel of the image, all 8 templates are applied and maximum value is chosen and compared with the threshold to detect the retinal blood vessels from the processed color fundus image. Template used in Kirsch’s method is given by first matrix of Equation (1). This template is rotated in eight different directions. With each rotated template, convolution is performed with the green channel image. The largest gradient in the different directions is considered for blood vessels extraction. The original Kirsch template is slightly modified and shown in second matrix of Equation (1) which provides better performance as compared to the first template. In the second template a scaling factor of 21 is used.
Contrast limited adaptive histogram equalization divides the image to small non-intersecting contextual regions for further processing [21]. Different steps involved in this method are contrast enhancement, background exclusion, thresholding and post filtering. In modified histogram, post filtering is performed by morphological operation (opening), which basically removes the noise.
Matched filter (MF) uses the Gaussian shape distribution of the pixel values in the cross section across the blood vessel. This is matched by a Gaussian filter [14]. Zero mean Gaussian filter is the MF, which is represented by the Equation (2). It provides better performance with lower complexity. It responds to both the vessels and the non-vessel regions. This difficulty/limitation can be overcome by Gaussian MF with first order derivative.
Performance Measures: The segmented blood vessels obtained by different methods are compared with the manual segmented blood vessels provided by the experts using various performance metrics. Some of them are, true positive (TP), true negative (TN), false positive (FP) and false negative (FN) values [22]. Measures of TP, TN, FP, FN provide the number of blood vessel pixels correctly identified, accurately rejected, incorrectly detected, and falsely rejected, respectively. Different performance measures such as sensitivity (α), specificity (β), sensibility (δ), accuracy (γ), equal error rate (EER) (ξ), F-Score (ψ), Dice coefficient (KD), Jaccard’s coefficient (KJ), and conformity coefficient (KC) are used in this paper.
Sensitivity (α) tests the ability to identify positive results [23] whereas specificity (β) determines the segmentation method’s ability to identify negative results. Specificity and sensitivity are always close to 100% for better segmentation. Sensibility (δ) provides consistent and reliable evaluation scores without considering the image background properties. It should be low for better segmentation. Accuracy (γ) measures the tolerance and defines limit of the errors made when the image is processed under normal conditions [24, 25]. It ranges between 0% and 100%. EER (ξ) provides a good indicator for segmentation performance [26]. F-score (ψ) parameter considers both sensitivity and specificity [27]. Dice and the Jaccard’s coefficient are band-based similarity coefficients which provide a quantitative assessment of similar information in an image [28]. Conformity is more sensitive and has power to discriminate small variations in segmented image. This is more rigorous than Jaccard and Dice coefficients [28]. Values of KJ and KD become 100% for accurate detection/segmentation. KC becomes negative infinity for failure pixel segmentation and approaches 100% for accurate pixel detection/segmentation.
From the performance values it is observed that the Gaussian based blood vessel segmentation technique provides the best performance compared to the other blood vessel segmentation methods. Quality of this technique declines in presence of pathologies. The segmentation performance of blood vessel may be increased by combining the Kirsch and Gaussian based method.
Image inpainting [15] is basically incorporated to remove certain parts of an image, without altering/affecting the overall visual appearance. In this case, the detected/segmented blood vessels from the processed fundus image are treated as mask for inpainting. It results in fundus image without blood vessels or in other terms, a fundus image where the pathologically affected regions are highlighted. Inpainting algorithm propagates information using only the Field of Expert (FoE) prior [29]. Levin et al., exploited the learned models of image statistics for inpainting [30]. Their approach relied mainly on a small number of hand selected features to train the model on image, which to be inpainted. On the other hand, for FoE model generic prior is used. The YCbCr color model was used, and the algorithm was independently applied to green channel image. To attain faster convergence 2500 iterations are run with large step size. Numerical instability occurs due to large step size. This can be overcome by applying 250 more iteration with small step size. The resulted inpainted image ideally has only the pathology and no blood vessels. However certain blood vessels are still appear. To remove the retinal blood vessels completely from the image, number of iterations has to be increased. But this drastically increases the computation time. Hence, a tradeoff is required between the accuracy and computational time.
Wavelet decomposition
Wavelet subband highlights various image features in different wavelet scales [31–34]. This reduces the computational time significantly as different subbands contains different feature information. Nirmal et al., found the blood vessels information in different wavelet subband [17, 35]. L2 Subband image contains more blood vessel information compared to other subband in 5-level wavelet decomposition by Daubechies-4 (db4) mother wavelet. 2-D wavelet decomposition gives rise to one approximation band and three detail subbands (horizontal(H), vertical(V) and diagonal(D)). In 5-level wavelet decomposition one approximation band at level-5 and three detail bands at each level are created. These bands can be represented as A5, - .3ptH4, - .3ptV4, - .3ptD4, - .3ptH3, - .3ptV3, - .3ptD3, - .3ptH2, - .3ptV2, - .3ptD2, - .3ptH1, - .3ptV1, D1, where the digit after each subband represents the level in the wavelet decomposition process. L2 subband image is reconstructed by considering the detail coefficients of level-2 subband and approximation coefficients of 5-level subband. This level contains higher blood vessel information compared to the other levels. This reconstructed image is used for the segmentation of blood vessels. The output obtained after wavelet decomposition is taken as input image for inpainting process. The output of inpainting technique is subjected to histogram equalization to obtain the pathologically affected region of the image. Due to the less number of coefficients, the segmentation and the inpainting algorithms become faster and reduces the computational complexity.
To determine region of retinal affected by pathology or the blood vessels affected by pathology the segmented blood vessels and the pathological image are subjected to intersection and the common pixels between both the images are computed after converting both the images to their binary form. The percentage of blood vessels pixels affected by pathologies are determined by Equation (3). This value provides an estimate of blood vessel damaged by pathologies.
The proposed method is evaluated on normal and pathological images present in DRIVE database [36], Aria database [37], and Glaucoma database [38]. DRIVE database contains 40 test images, in TIF format having dimension 512 × 512 pixels. The total images are equally distributed in test set and training set. Manually segmented blood vessels are available for all the images. Aria database contains 129 pathologically affected images, compressed in JPEG format. Glaucoma database contains 40 JPEG images.
Different methods are used for vessel extraction from the color fundus image such as Kirsch’s method, histogram based method, modified Kirsch’s method, modified histogram based method, and Gaussian MF approach. The above mentioned techniques are applied on the 40 images of DRIVE database (20 training images and 20 test images). The output of different methods are given in Fig. 2. Figure 2(a) and (b) show the color fundus image and the respective green channel image. The green channel image has higher contrast between the background and the blood vessels compared to the red channel and the blue channel image. Figure 2(c)–(g) show the segmented blood vessels obtained by Kirsch’s method, modified Kirsch’s method, histogram based segmentation technique, modified histogram based segmentation method and Gaussian MF approach. Figure 2(h) shows segmented blood vessels obtained by merging Gaussian and Kirsch’s based segmentation output. Performance of difference segmentation method are calculated by sensitivity, specificity, sensibility, accuracy, EER, F-score, Jaccard’s coefficient (KJ), conformity coefficient (KC) and Dice coefficient (KD). The performance measures are tabulated in Table 1. Accuracy for Gaussian based segmentation techniques is found to be higher i.e., 95.463% whereas the histogram based segmentation has the lowest accuracy i.e., 87.665%. Specificity and sensibility values are found to be the best for the Kirsch-Gaussian (KG) MF segmentation method. EER is found to be the least for Gaussian MF based method. The next lower value for EER is for Kirsch-Gaussian MF segmentation method. From the performance table it may be concluded that Gaussian MF and Kirsch-Gaussian MF perform better as compared to other methods.

Segmentation of blood vessels from normal fundus image: (a) color fundus image, (b) green channel image, (c) Kirsch’s method, (d) modified Kirsch’s method, (e) histogram method, (f) modified histogram method, (g) Gaussian method, (h) merging Kirsch-Gaussian MF method.
Performance measure of segmentation of blood vessels for DRIVE database
The receiver operating characteristic (ROC) is a metric to evaluate classifier output quality. It is plotted between true positive rate (sensitivity) along y-axis versus false positive rate (1- specificity) along x-axis [39]. Area under ROC curve is more important as it distinguishes between two diagnostic groups. Each point in the ROC curve represents sensitivity vs specificity value corresponding to a particular threshold. It is ideal to maximize the true positive rate and minimize the false positive rate. This can be known from the steepness of ROC curve. Accuracy becomes maximum if the ROC curve traverse from the point (0,0) to (1,1) through the (0,1) coordinate. Accuracy attends 50%, when the ROC curve is diagonal. In this case, the ROC curve lies toward the higher accuracy side. The ROC of different methods such as Krisch, histogram, Gaussian MF, and Merging KG are shown in Figs. 3 and 4. Figure 3(a) and (b) show the ROC for Krisch method and the histogram method respectively for two different data sets. In these two methods the ROC curve is not steep enough. The ROC for Gaussian MF is shown in Fig. 3(c). From the figure it may be concluded that ROC curve is steeper for Gaussian MF compared to the Krisch and histogram based method. Gaussian MF and Krisch are combined to extract the blood vessels from the retinal images. The ROC for the Merging of Krisch and Gaussian method is shown in Fig. 3(d). The area under this curve is maximum compared to the area under other curve. In Fig. 4 the ROC for different methods are plotted. The area under the ROC of Gaussian MF is found to be highest, whereas the area under the ROC curve for Krisch method is least. The ROC curve for Gaussian MF is more inclined to the sensitivity. So, the proposed method merging of Gaussian matched filter and Krisch method can perform better segmentation.
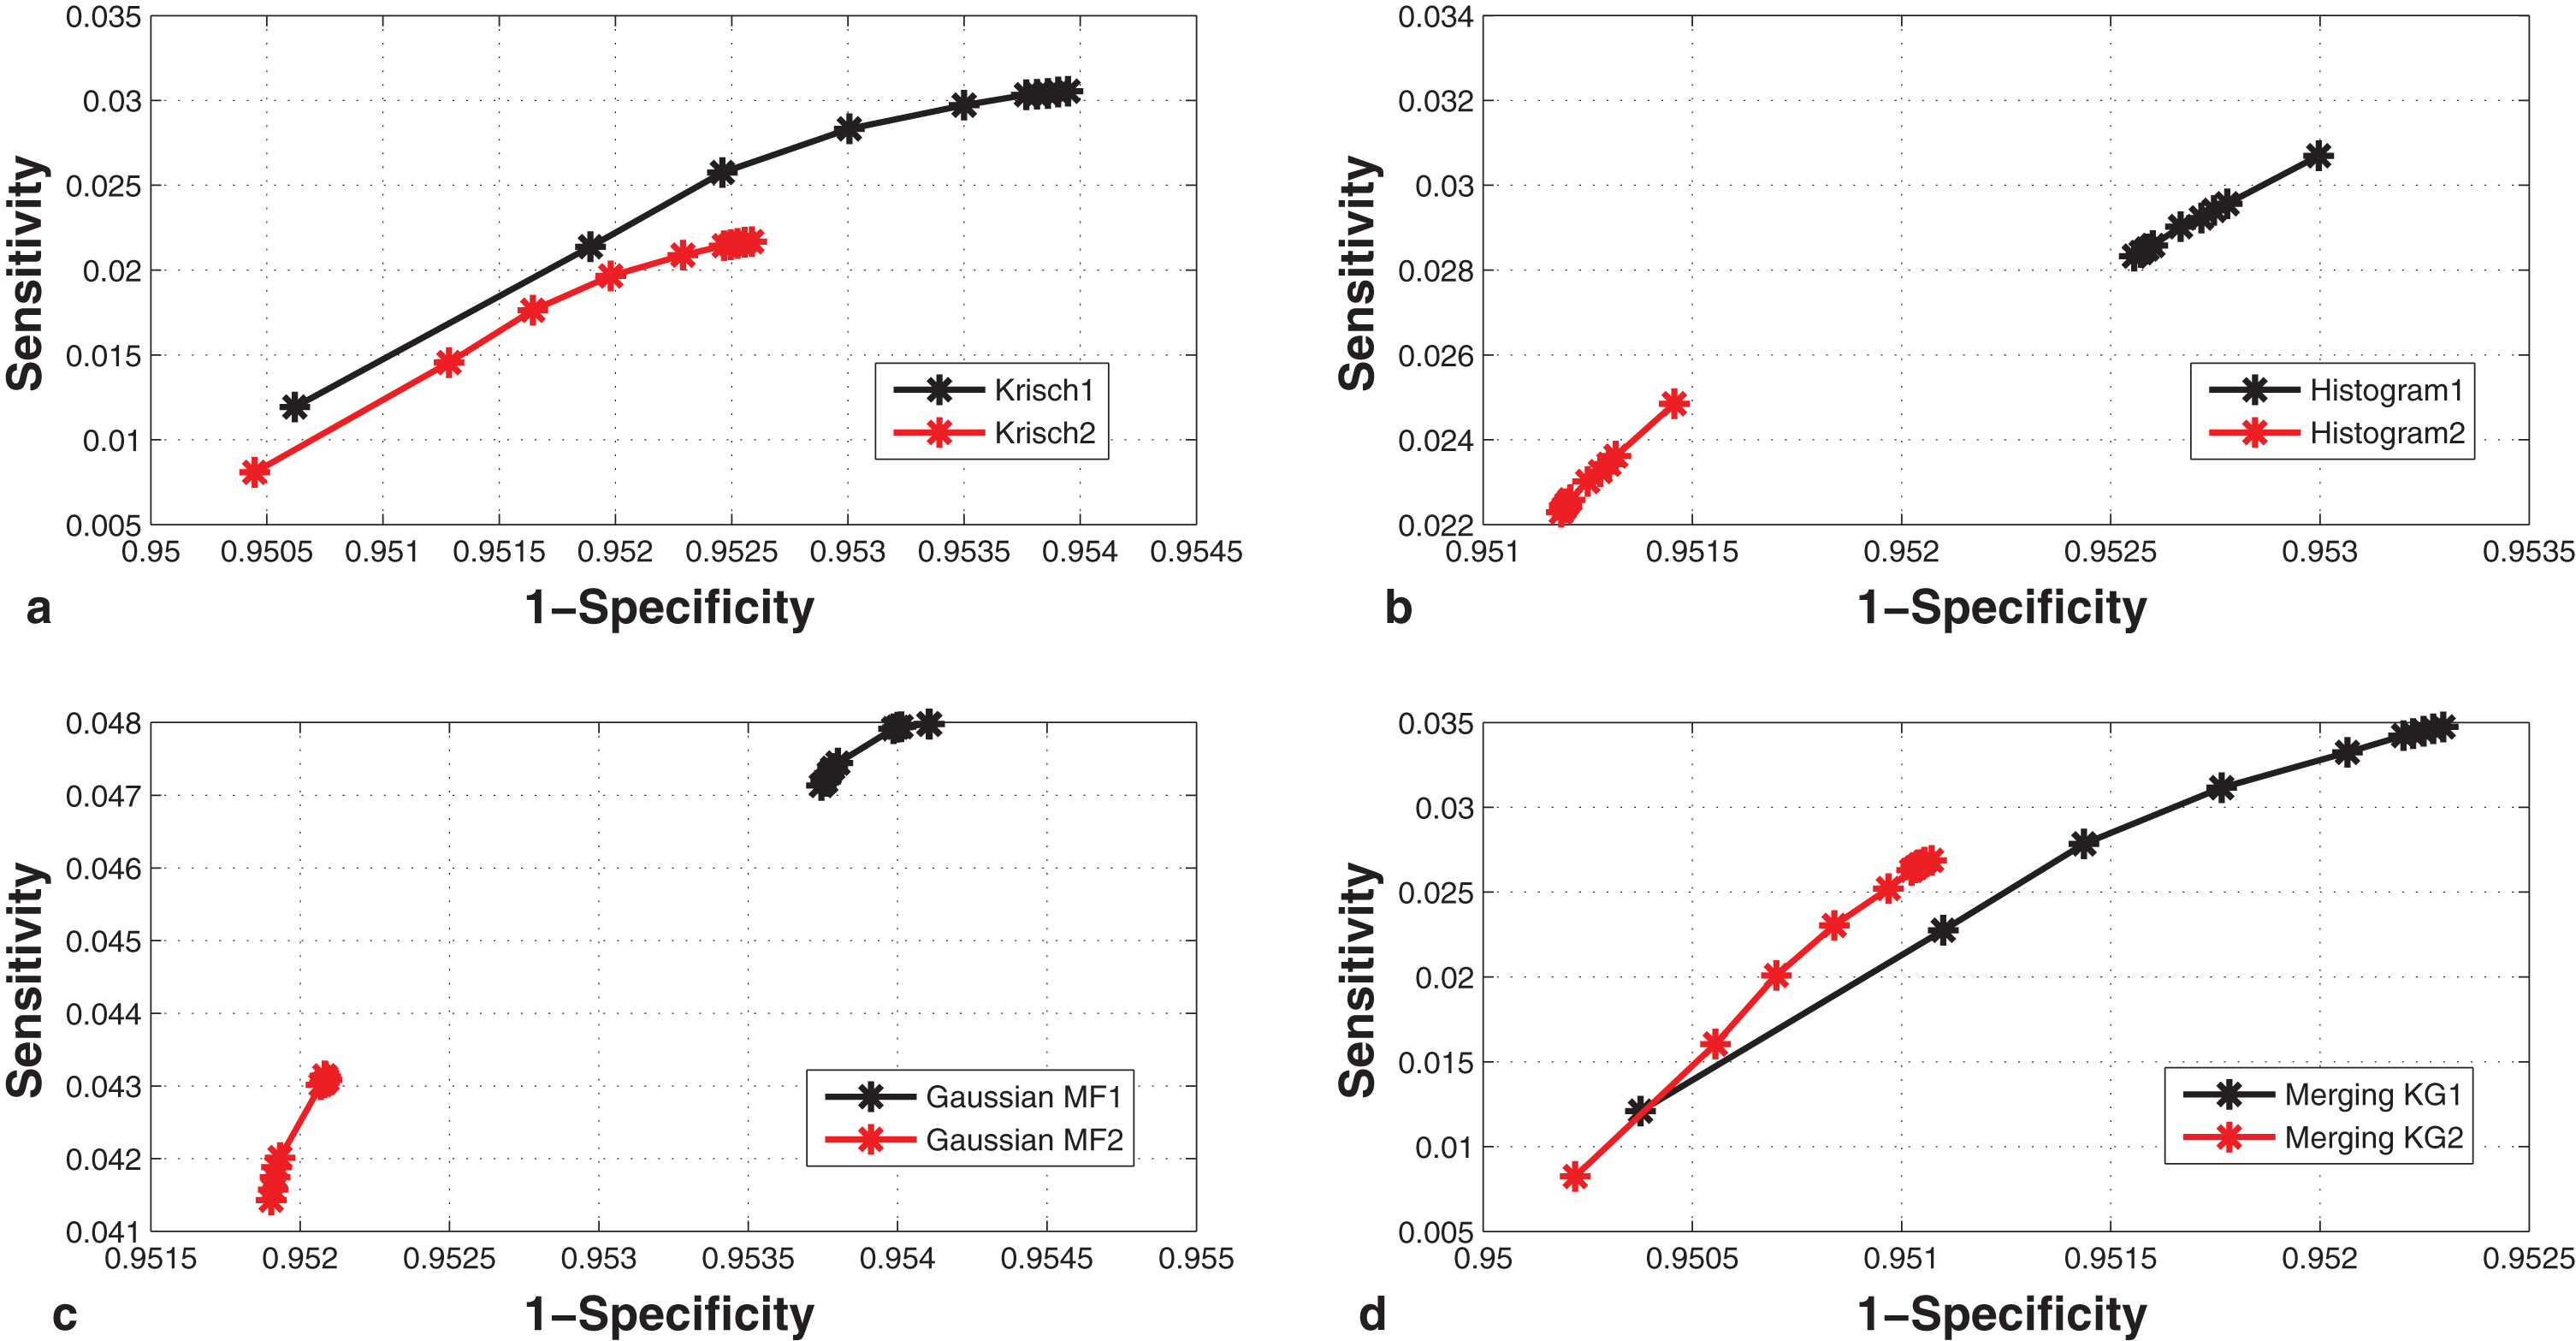
ROC of blood vessel segmentation for different methods: (a) Krisch, (b) Histogram, (c) Gaussian matched filter, (h) merging Kirsch-Gaussian MF method.

Comparison of ROC plots for different methods of blood vessel segmentation.
Salt and pepper noise mainly affects the fundus image [40]. It is an impulse noise which presents itself as sparsely occurring white and black pixels. To study the performance of different segmentation technique in the presence of noise, salt and pepper noise of magnitude 0.002 is added to the retinal images and different segmentation algorithms are applied to the noisy image. Figure 5(a) shows the color fundus image from DRIVE database and Fig. 5(b) shows the respective image obtained by applying a salt and pepper noise of magnitude 0.002. Different segmentation algorithms are applied to the noisy image. Figure 5(c) and (d) show the segmented output by Kirsch method and modified Kirsch method. These images contain more noise. Figure 5(e) and (f) are the images obtained by segmentation by histogram and modified histogram based method, respectively. The noise is reduced in these methods. The segmentation outputs by Gaussian MF and Kirsch-Gaussian MF based methods are shown in Fig. 5(g) and (h), respectively. The amount of salt and pepper noise is low in Fig. 5(g) and (h), respectively. The performances of the different segmentation algorithms are calculated by the above mentioned performance measures and these are tabulated in Table 2. Sensitivity is found to be the highest for Gaussian MF based segmentation method i.e., 70.26% and the lowest for Kirsch method i.e., 49.37%. Specificity and sensibility values are found to be better for the merging method of Kirsch-Gaussian MF. The value for specificity and sensibility for merging Kirsch-Gaussian MF method are 95.54% and 4.45%, respectively. Accuracy and EER are found to be better for Gaussian MF based segmentation method i.e., 91.01% and 4.49%, respectively. From this we may conclude that Gaussian based MF and merging of Kirsch-Gaussian MF methods perform better segmentation of blood vessels compared to other methods in the presence of noise.
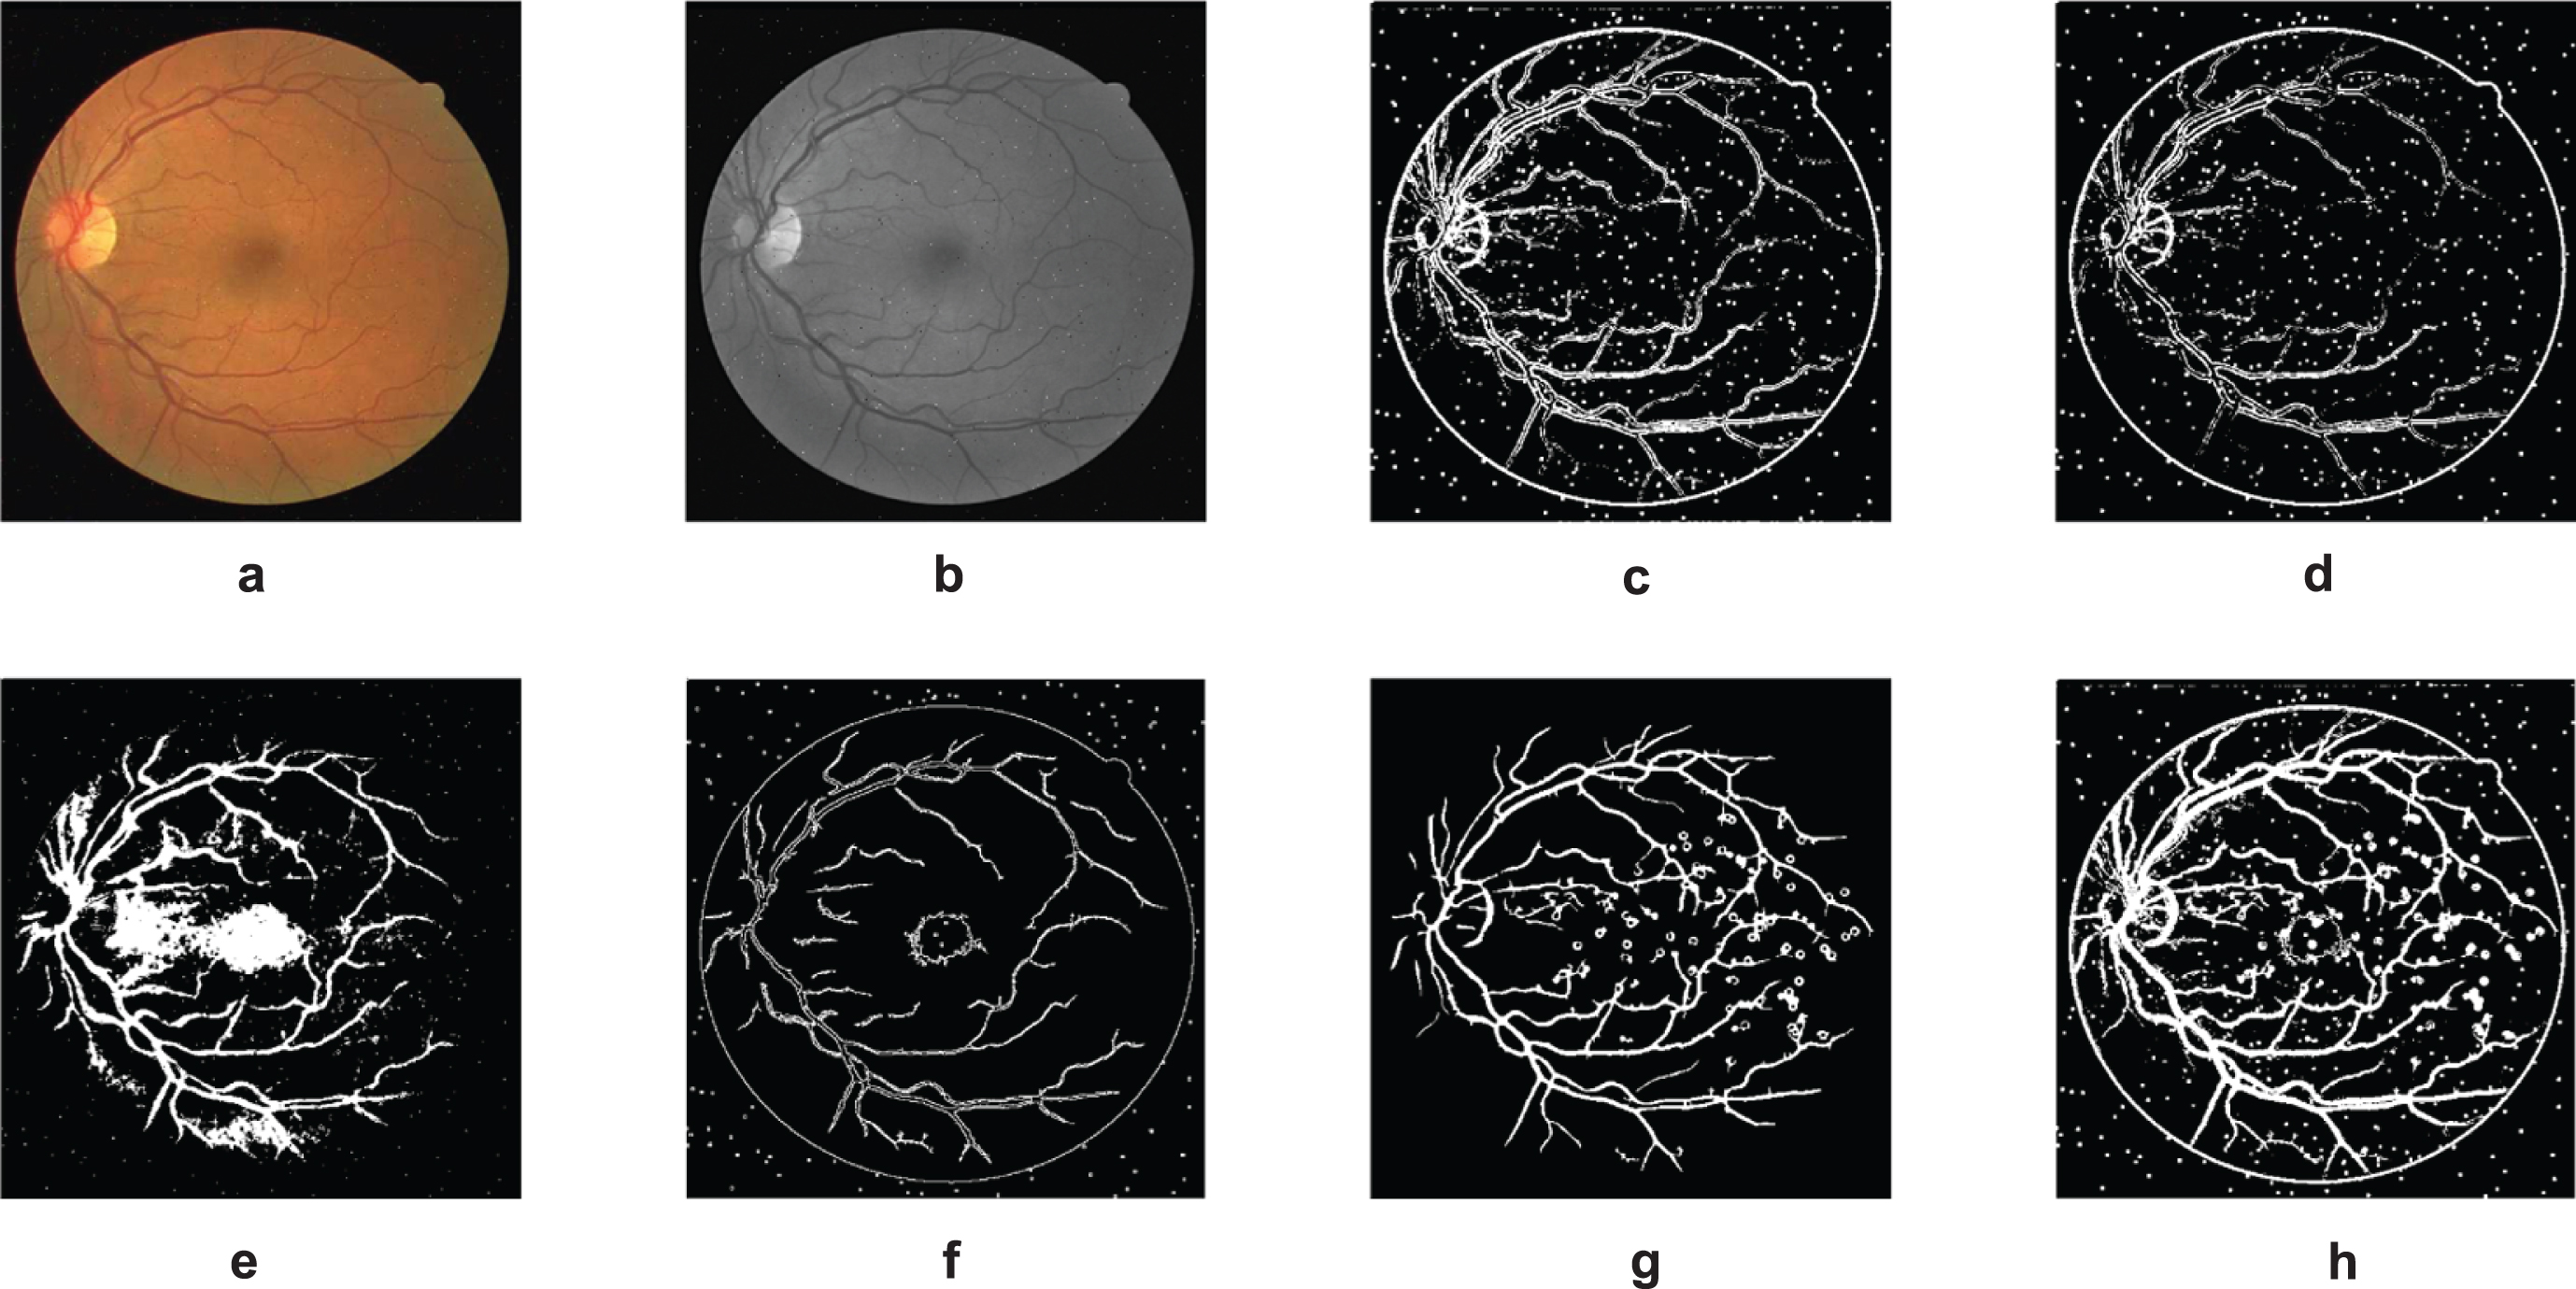
Segmentation of blood vessels in presence of salt and pepper noise: (a) color fundus image, (b) green channel image, (c) Kirsch’s method, (d) modified Kirsch’s method, (e) histogram method, (f) modified histogram method, (g) Gaussian method, (h) merging Kirsch-Gaussian MF method.
Performance measure of segmentation of blood vessels for DRIVE database in presence of salt and paper noise
The different blood vessels segmentation techniques are applied to the pathological images and glaucoma images present in Aria database and Glaucoma database. For the pathological images performance measures are calculated and tabulated in Table 3. Performance measures of all the above techniques are analyzed for 129 pathologically affected color fundus images from Aria database. Figure 6(a) shows the color fundus image with pathologies and Fig. 6(b) shows the corresponding green channel image. The pathological region appears as white patches in the middle part of the green channel image. Figure 6(c)–(g) show the segmented blood vessels by Kirsch’s method, modified Kirsch’s method, histogram method, modified histogram method, and Gaussian MF based method, respectively. Figure 6(h) shows segmented blood vessels obtained by merging Kirsch-Gaussian MF based method. From the figures, we can see that the segmentation by Gaussian MF and Kirsch-Gaussian MF based methods are better than other methods. In Table 3 the performance measures for different segmentation techniques are tabulated. In the presence of pathologies, the Gaussian MF segmentation has better performance compared to the other methods. Accuracy of Gaussian MF based blood vessel segmentation is higher i.e., 81.693%. The specificity value for the Kirsch-Gaussian MF based method is found to be better (88.725%) as compared to the other methods. So it may be concluded that Gaussian based MF and merging of Kirsch-Gaussian MF can be used for segmenting blood vessels for automatic detection of retinal disorders.
Performance measure of segmentation of blood vessels for pathological image
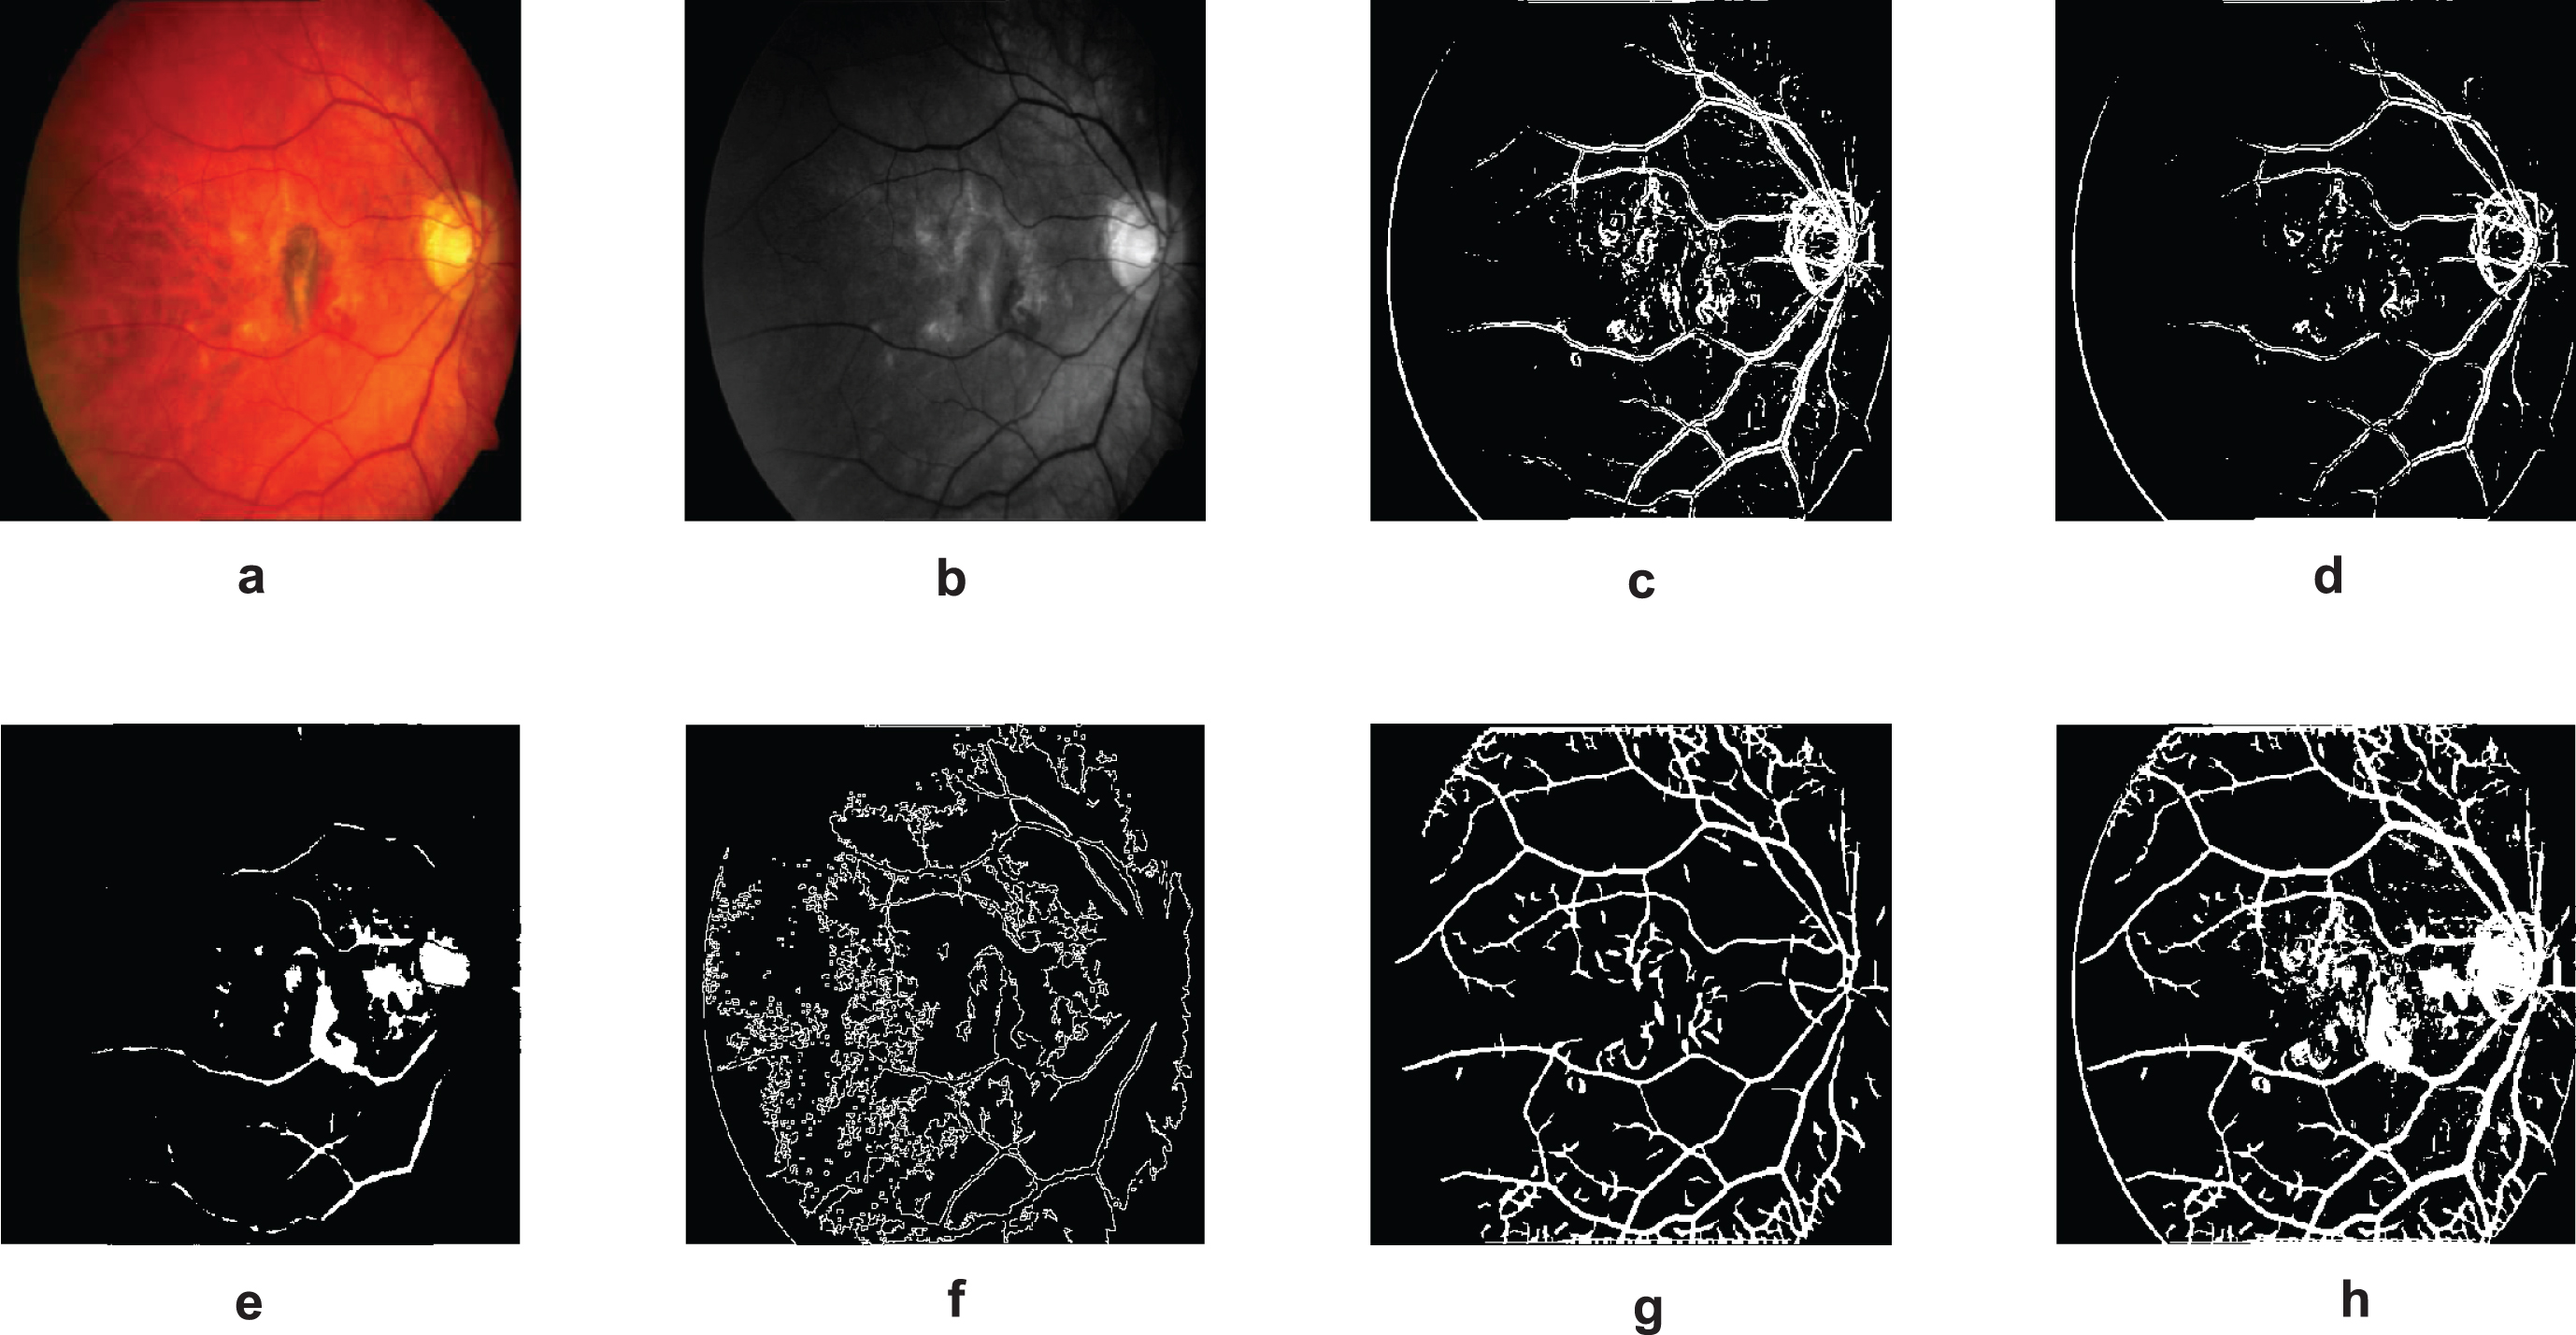
Segmentation of blood vessels from pathological image: (a) color fundus image, (b) green channel image, (c) Kirsch’s method, (d) modified Kirsch’s method, (e) histogram method, (f) modified histogram method, (g) Gaussian method, (h) merging Kirsch-Gaussian MF method.
Gaussian MF and Kirsch-Gaussian MF based blood vessel detection/segmentation techniques performed better compared to the other methods. These two techniques are used for the detection of various retinal and vascular disorders due to diabetic retinopathy. For this inpainting technique is used with FoE model on the green channel image. Figure 7(a) shows the color fundus image in which the pathological region appears as yellowish in color. Figure 7(b) is the green channel image in which the pathologies appears as white patches at the middle of the image. Our aim is to find the blood vessels affected by pathologies by calculating the number of pixels common in the pathologies and the blood vessels. This gives an estimate of blood vessel disorders and retina affected by pathologies. The segmented blood vessel image is shown in Fig. 7(c), which is obtained by using the Kirsch-Gaussian MF segmentation method. The segmented blood vessel is used as mask for inpainting. By using this mask the green channel images is inpainted to remove the effect of blood vessels. The inpainted image shown in Fig. 7(d), does not contain any blood vessels. This image is subjected to histogram equalization to find the pathological regions which is shown in Fig. 7(e). After getting the pathologies, the common points of the pathologies and the blood vessels are calculated. Blood vessels affected by pathologies is shown in Fig. 7(f). Then the percentage of blood vessels are calculated by the Equation (3). This provides an index for blood vessel damage (i.e., %ϱ). This reflects the portion of retina affected by pathologies. Higher the index higher is the percentage of affected blood vessels and retina and more is the severity of the disease. By looking into the figure of blood vessels damaged and the index, the progression of disease and the condition of vision can be estimated. Table 4 shows the percentage of affected blood vessels (%ϱ) for 40 pathological images. In image-24 (Im-24) only 2.98% blood vessels are affected by pathologies. In Im-18, 68.78% of blood vessels are affected by pathologies. It may be concluded that retina in Im-24 is less damaged than the Im-18. So, vision condition in Im-18 is poor as compared to Im-24. Progression of blood vessel damages for Im-18 and Im-24 are shown in Figs. 7 and 8 respectively.
Extent to which blood vessels affected by pathologies in fundus image(Im)

Assessment of pathological affected blood vessels from color fundus image: (a) color fundus image, (b) green channel image, (c) segmented blood vessels, (d) inpainted image, (e) segmented pathology, (f) blood vessels affected by pathology.
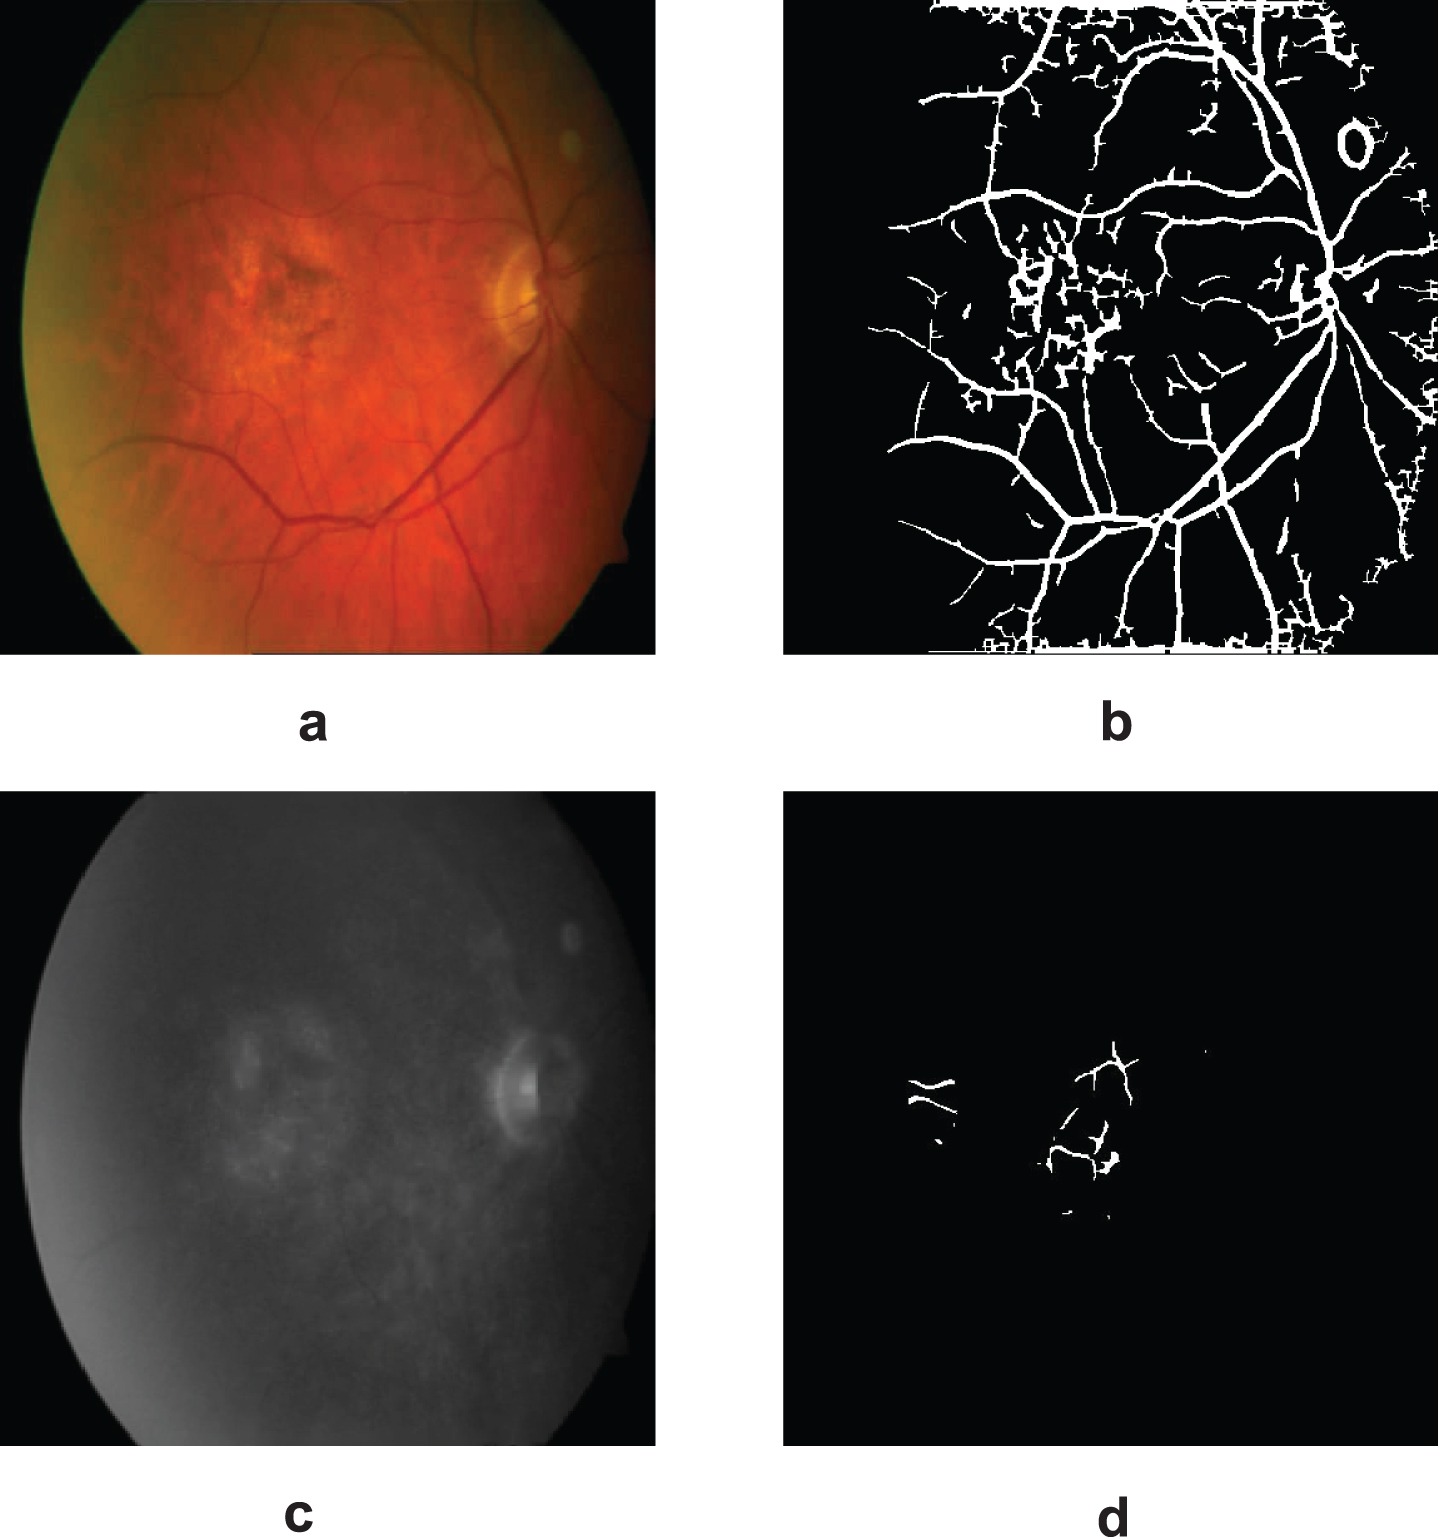
Assessment of pathological affected blood vessels from color fundus image: (a) color fundus image, (b) segmented blood vessels, (c) inpainted image, (d) blood vessels affected by pathology.
Computational time for applying inpainting technique on individual image is observed to be approximately 4 minutes. This is significantly reduced by using five level wavelet decomposition technique. Five wavelet families such as Haar Wavelet, Daubechies (dB4), Symlets (sym2), Coiflets (coif1) and Biorthogonal (bior1.3) are used for wavelet decomposition. Daubechies wavelet is found to reduce the computation time to nearly 1 minute without affecting the performance much. Segmentation is applied to the subband-2 reconstructed image in five level wavelet decomposition. Subband-2 reconstructed image contains approximation coefficients of level-5 and detail coefficients of level-2 in 5-level wavelet decomposition. In this image other level coefficients are made zero. To this image the segmentation technique is applied for segmentation of blood vessels. Then this segmented blood vessels is used as a mask to inpaint the blood vessels in subband-2 reconstructed image to reduce the effect of blood vessels and highlight the effect of pathologies for the purpose of segmentation of the pathological region.
In this paper, an unique technique is discussed to estimate the degree of pathology affected blood vessel in the retina from color fundus image. Fluid deposits over the retina depends on the amount of blood vessels damage. Quantity of leakage is portion to affected retina by pathologies. So it leads to more vision loss. The proposed method has employed modules such as Gaussian based MF and combination of Kirsch-Gaussian MF approach for blood vessels extraction and inpainting technique to separate the pathological affected regions from the fundus image. Experimental results obtained by using green-channel images have been presented. The performance of different segmentation approach are tested using DRIVE, Aria and Glaucoma databases. From the experimental results, it is found that the Gaussian MF and merging of Kirsch-Gaussian MF based segmentation yield superior results when compared with other existing techniques with respect to the various metric such as, sensitivity, specificity, sensibility, accuracy, EER, Fscore, Dice Coefficient (KD), Jaccard’s coefficient (KJ), and conformity coefficient (KC). The proposed method is able to determine the condition of vision from the blood vessels damage and fluid deposits. The only limitation which appears from the proposed method is that the computation time taken in inpainting technique is comparatively large. A tradeoff between efficiency and computational time is achieved by limiting the iterations to 2500. The computation time for each image is found to be nearly 4 minutes. The computational time is significantly reduced to one minute by using the inpainting technique in wavelet subband. Level-2 of five level decomposition by Dubechies wavelet reduces the computation time. Considering the relevant sub-bands decreases the number of coefficients significantly and consequently the processing time is minimized. Measuring the percentage of overlapping blood vessels with the pathologies, progression of the disease and condition of the retina can be assessed. In image-24 (Im-24), 2.98% blood vessels are affected by pathologies, whereas in Im-18 68.78% of blood vessels are affected by pathologies. It may be concluded that the retina in Im-24 is less damaged than that in the Im-18 (i.e., vision condition of Im-24 is good compared to Im-18).