
Abstract
Targeted marketing strategy is a prominent topic that has received substantial attention from both industries and academia. Market segmentation is a widely used approach in investigating the heterogeneity of customer buying behavior and profitability. It is important to note that conventional market segmentation models in the retail industry are predominantly descriptive methods, lack sufficient market insights, and often fail to identify sufficiently small segments. This study also takes advantage of the dynamics involved in the Hadoop distributed file system for its ability to process vast dataset. Three different market segmentation experiments using modified best fit regression, i.e., Expectation-Maximization (EM) and K-Means++ clustering algorithms were conducted and subsequently assessed using cluster quality assessment. The results of this research are twofold: i) The insight on customer purchase behavior revealed for each Customer Lifetime Value (CLTV) segment; ii) performance of the clustering algorithm for producing accurate market segments. The analysis indicated that the average lifetime of the customer was only two years, and the churn rate was 52%. Consequently, a marketing strategy was devised based on these results and implemented on the departmental store sales. It was revealed in the marketing record that the sales growth rate up increased from 5% to 9%.
Keywords
Introduction
The retail industry collects enormous volumes of POS data. However, this RAW POS data has minimal use if it’s not properly processed to generate retail insights, optimize marketing efforts and drive decisions. The retailer’s relationship with customers is the key success to brand loyalty, repeat store visits, and ultimately, sales conversions. This relationship has been affected by recent economic and social. The retail industry is prompted to be more strategic in their planning and to develop a deep understanding of its consumers as well as their competitors. Understanding customers’ behavior as well as establishing a loyal relationship with customers has become the central concern and strategic goal for most retailers [1] interested in tracking and managing their customer lifetime value on a systematic basis [44]. Market segmentation is the process to divide the market base of potential customers into similar or homogeneous groups or segments that possess mutual characteristics helps marketers to gather individuals with similar choices and interests [2]. This enables retailers to avoid selling unprofitable and irrelevant products with regards to their marketing purpose, which will result in better management of the available resources through the selection of suitable market segment and the primary focus of specific promising segments [3–15].
Furthermore, as far as the research scope is concerned, there has been number of studies that examine customer purchase behavior and lifetime value among different products based on a variety of market segmentation with demographic variables and characteristics. Instead of addressing individual consumers based on their purchasing behavior, most market segmentation studies merely considered the overview of consumers’ historical data to produce assumptions of what makes consumers similar to one another. It is significant to highlight that this method hides critical facts about individual consumers.
Among those customer lifetime value models, a highly regarded model cited by many experts is the Pareto/NBD Counting Your Customers proposed by Schmittlein, Morrison, and Colombo (1987). The model investigates customer purchase behavior in settings where customer purchase dropout is unobserved. However, the model is powerful for analyzing customer purchase behavior, but it has been proven to be empirically complex to implement due to the computational challenges, and only a handful of researches claim to have implemented it [44].
Based on previous studies of market segmentation on the retail domain, Recency, Frequency, and Monetary (RFM) has been extensively employed as this model can divide customers into groups which, therefore, enables retailers to decide on ways to fully utilize their limited resources in providing effective customer service through the categorization of customers. Nonetheless, RFM also has its own limitation [4] where it only focuses on customers’ best scores in addition to providing less meaningful scoring on recency, frequency and monetary for most consumers (Wei, Lin, and Wu, 2010). Moreover, RFM analysis is not able to prospect for new customers, as it mainly concerns the organization’s current customers [6] and that it is not considered as a precise quantitative analysis model as the importance of each RFM measure is different among other industries [16–20]. The current research foresees an enhanced user-friendly market segmentation modeling method, which is more advanced and effective than conventional RFM method. The integration of Customer Lifetime Value and newly proposed RFM variants (PQ) (T) into a closed-loop model represents different variation in customer purchase behavior. The enhanced model has the capability to simultaneously analyze millions of raw POS data, identify groups of customers by criteria the retailer may never have considered. This goldmine knowledge is expected to help marketers avoid the assumptions when doing customer deep-dive and trend analysis, which subsequently tapped marketers to device targeted marketing campaign resulting in sales growth and higher ROI. The RFMPQ and RFMT dataset concentrate on the idea of identifying the purchasing power history of an individual customer or segment. P variable represents the average purchasing power per customer per all transactions, Q variable represents the average purchasing power per product, and T represents the change of consumer buying behavior or trend using change rate. The enhanced RFM model also incorporates CLTV for predicting future cash flow attributed to the customer’s shopping period with the retailer [8], followed by applying a modified best-fit regression technique, and K-means++ and Expectation-Maximization (EM) clustering algorithms to analyze the customer buying behavior as well as to assess the clustering technique’s performance using cluster quality assessment. The analysis can also identify marketers’ area of focus and ensure the highest quality of customer service.
Installing and using the microsoft word template
Market segmentation is the process of categorizing large homogenous market into similar or homogeneous smaller groups who share characteristics such as income, shopping habits, lifestyle, age, and personality traits [9]. These segments are relevant to marketing and sales and can be used to optimize products, customer service and advertising to different consumers [6]; It is seen that many companies across the retail industry have identified customer service as a market key differentiator and tend to segment their customers for positive customer experience and service delivery [10]. There are three types of market segmentation bases, namely demographic, geographic, and behavioral. Demographic segmentation is the most commonly used variable when segmenting a market. It has the ability to provide the retailer with a clear vision with the future advertising plans, a precise customer shopping profile and focuses on the measurable factors of consumers and their households. Furthermore, this segment is primarily descriptive in terms of gender, race, age, income, lifestyle, and family status [11]. In contrast, behavioral segmentation divides customers based on their attitude toward products. Many marketers consider behavioral variables such as occasions, benefits, usage rate, customer status, readiness, loyalty status, and attitude towards a product as the ideal starting points for creating market segmentation [11]. According to behavioral segmentation, consumer behavior is the segmentation process based on their evaluation and buying activities, as well as the use and disposal of goods to recognize consumer needs. These criteria can provide a thorough understanding of consumer behavior as they reason from social psychology, anthropology, economics, sociology, and psychology that influence consumers on their purchasing decision of products [21–25]. To get a sense of the overall customer lifetime value for the customer-base, [45] proposed a framework to integrate customers’ distribution with the iso-value curves, by grouping customers on the basis of RFM characteristics and to understand the factors that trigger consumer’s defection. [48] proposed analytical model for consumer engagement, related to the subsequent stages of the consumer life-cycle like customer development, customer acquisition, and customer retention. The authors concluded that the availability of data is vital to the development of advanced analysis in each consumer’s stage. However, several organizational issues of analytics for consumer engagement remain, which constitute barriers to implementing analytics for customer engagement. In order to solve the problems of consumer behavior that evolved with time, this research examines the behavioral, demographic segmentation model and identifies customer behavior using model Customer Life Time Value (CLTV) and Recency, Frequency and Monetary (RFM) model.
Customer life time value (CLTV) model
Customer Lifetime Value (CLTV) is an important metric to measure the total worth or profit to a business obtained from a customer over the whole period of their relationship with the retailer [8]. The literature defines the customers churn as the extinction of the contract between the firm and the customer, where customer retention refers to the collection of activities organizations take to reduce the number of customer’s defections.
Churn rate and retention rate critical matrix for any company and considered primary components of the future CLTV. Where CLTV is an estimation of the average profit, a customer is expected to generate before he or she churn [48]. The concept of retention and churn is often correlated with industry life-cycle. When the industry is in the growth phase of its life-cycle, sales increase exponentially. However, customer churn is the most challenging task for the retailer industry. In this perspective, more insight is needed to know the reason for customer churn in a dynamic industry.
The three main components of CLTV are customer acquisition, customer expansion, and customer retention [46]. Nevertheless, it is crucial to consider COGS (Cost of Goods Sold) and acquisition cost to square off the real CLTV. The basic model to calculate CLTV is presented in Equation (1).
The above CLTV formula is more of a proxy for an average customer who stays for X period of time and pays Y total amount of money. The t represents a specific period of time, while (t = 1) represents the first year, and (t = 2) denotes the second year. The n represents the total time period the customer will stay with the retailer before churn occurs. The r represents the month over retention rate. Pt is the profit that the customer/customers will contribute or generate to the Retailer in the Period t, and finally, d refers to the churn rate. Additionally, the customer’s loyalty can be calculated using the Retention Rate formula, as illustrated in Equation (2). Based on the Retention Rate formula, CE denotes to the number of customers at the end of each time period, where, CN is the total number of new customers acquired in the chosen time period, and CS denotes to the number of customers at the start of the time period.
Management of consumer retention requires the tools that allow decision-makers to assess the risk of each consumer to defect and understanding the factors that trigger consumers’ defection [47]. Customer retention strategy also known as a loyalty rate is the collection of activities a retailer uses to maintain on a long-term relationship basis by engaging existing customers to increase profitability by increasing the number of repeat customers. CLTV represents a greater improvement compared to the traditional RFM analysis as the frequency of customer’s purchases, and the amount of customers’ average purchase is used for segmenting customers-base. CLTV matrix classifies customer purchase behavior using different segments, namely Best, Spender, Frequent, and Uncertain classified by Marcus (1998). Table 1 illustrates the criteria of each segment that were classified by Marcus (1998).
Criteria of customers in each segment
RFM is a standard statistical marketing model for customer behavior segmentation assess consumer lifetime value. The model is very popular in the retail industry as it groups customers based on their shopping power history –how recently, how often, and how much did the customer buy. RFM model helps retailers group customers into various segments or categories to identify customers who are more likely to respond to marketing promotions and future customer personalization services [17]. The R symbolizes recency refers to the interval between the time since last purchase the customer made. The F symbolizes the frequency of consumer behavior in a time period, and the M symbolizes monetary referring to the amount of money consumption in a period [18]. Quintiles scoring is the most commonly used scoring in the RFM method in arranging customers in ascending or descending order or (Best to Worst). Customers are grouped into five equal groups where the best group receives the highest score of (5), and the worst receives the lowest score of (1) [1]. The RFM score is the weighted average of its individual components and is calculated as portrayed in equation 3 and 4 to derive a continuous RFM Score. Finally, these scores can be re-scaled to the 0 –1 range [17].
Market segmentation helps to differentiate and customize marketing strategies into segments. Market Segmentation is a significant key in data mining, where data mining is used to interrogate segmentation data to create data-driven behavioral information segments that are applied to detect meaningful patterns and rules underlying consumer behavior [19]. Furthermore, [26] and [27] were among the studies that performed market segmentation using data mining, RFM, CLTV, and clustering technique to form a decision-making system. [28] proposed clustering and profiling of customers using customer relationship management (CRM) and RFM for recommendations were proposed. On the other hand, data mining was conducted on historical data of customer’s sales using the RFM model with K-Means algorithm where results have outlined recommendations to perform customer relationship strategy. Also, f (2016) proposed a three-dimensional market segmentation model based on customer lifetime value, customer activity, and customer satisfaction. For more accuracy, the author grouped customers into several different groups. RFM, Kano, and BG/NBD models obtained the corresponding variables.
Furthermore, the market segmentation model helps enterprises to maximize their profits. In [29–35], customers were classified into various clusters using RFM technique and association rules were mined to identify high-profit customers. RFM statistical Techniques and Clustering methods for Customer Value Analysis were combined in [26] for a company’s online selling. As far as the methodology is concerned, there is no standard convention for measuring customer purchase behavior as each literature differs in examining customer purchase behavior. Nevertheless, the K-Means algorithm is noted as an extensively used clustering algorithm in previous research due to its simplicity and speed in working with a large amount of data [36]. Despite its strength, it has been recorded that the K-Means method uses a random distribution for the seeding positions and does not maintain the same result each time that it is run [37]. New, improved K-means algorithm called K-means++, which uses sophisticated seeding procedure for the initial choice of the center positions and often twice as fast as the standard k-means. Contrastingly, Neha, Kirti, and Kanika (2012) noted that K-means and (EM) Expectation-Maximization algorithms are the two most commonly used based algorithms for the identification of growth patterns. Even though EM is similar to the K-Means algorithm, this algorithm is based on two different steps iterated until there are no more changes in the current hypothesis [29]. Expectation (E) refers to computing the probability that each datum is a member of each class. Maximization (M) refers to altering the parameters of each class to maximize those probabilities. Eventually, they converge, although not necessarily correct. Furthermore, EM algorithm is embedded with a significant feature where it can be applied to problems with observed data that provide “partial” information only [30]. Based on several comparative studies of EM and K-Means methods [31–34], it was observed that EM outperformed K-Means and results were improved when they were hybridized. The current study integrates two dynamics models, namely CLTV and RFM models, with the addition of new RFM variants, i.e., P, Q and T to cater the weakness and inaccuracy of consumer modeling that are caused by the limitations RFM. In addition, this study applies K-means++ and Expectation Maximization (EM) clustering algorithms to offer the retail industry with effective analysis of customer buying behavior through the combination of customer profitability and product profitability in creating a strategic marketing campaign as explained previously in the introduction [38–40].
Mining big data
Data mining is the process of extracting information from large data sets and transform it into an understandable form for further use. Data mining can be used in such a case where the database is large, and the classification of such data is difficult [35]. The term Big data is often used for very large databases whose size in terabytes to many PETA bytes and it is beyond the ability of commonly used Relational Database Management (RDBM) to process the data within a tolerable elapsed time. Patel, Birla, & Nair (2012) have done a lot of experiment on the big data problem. The result was the finding Hadoop Distributed File System (HDFS) for storage and map-reduce method for parallel processing on a large volume of data. However, the research in Big Data analysis using data mining especially with clustering methods is still considered to be young, and therefore attracts many researchers to conduct further research in this potential area [37, 38] proposed a fast-parallel k-means clustering algorithm based on Map Reduce, which has been widely embraced by both academia and industry. They used to speed up, scale-up, and size up to evaluate the performances of their proposed algorithm. Their finding showed that the proposed model could process very large dataset on commodity (Low-cost) hardware effectively.
Hadoop is becoming a commodity for every data-driven organization, where data is larger and comes in many formats, mining and extracting intelligence from data has always been a challenge [39]. The new dynamic in the database has brought new challenges to the current analytical models and traditional databases and emphasize the need for a paradigm shift in data extraction and data analysis. Such challenges are the performance of the data retrieval and the varieties of data sources for which the format of the relational databases may no longer be the best option. [39] stated that Traditional database systems fall short in handling scalability to boost the performance efficiency and dealing with Big Data effectively and thus the adoption of based systems such as Hadoop is increasing. Hadoop is an open-source framework for data-intensive distributed system processing of large-scale data, based on Map Reduce programming model and a distributed file system called Hadoop Distributed File system (HDFS).
Map Reduce programming model is a methodology that deals with implementation and generating large datasets, making Hadoop the preferred as a solution to the problems in the traditional Data Mining [41].
The main components of Hadoop are Hadoop distributed file system (HDFS) a high bandwidth clustered storage allows writing an application that rapidly processes massive data in parallel, which is vital for large files. Map Reduce, is the heart of Hadoop. HDFS is high bandwidth clustered storage, while Map-Reduce processing enormous pieces of data and divide the input dataset into independent smaller pieces and be distributed amongst multiple machines referred to as nodes to parallel process them [42].
Research method
The methodology of this work, which involved Five phases, is outlined in Fig. 1. The first phase focused on the implementation of our POS database on a single node Hadoop distributed file system.
The experiments were performed on the following system: Single node using Java: Hardware: Intel Core i5, 8GB RAM, CPU 2.4 GHz Software: Java with JDK 1.8 Hadoop implementation: Software: Ubuntu 16.10, Java with JDK 1.8, Hadoop 2.7.0. The second phase focused on (ETL) Extract, Transform, and Load involving data preprocessing steps, i.e., data cleansing, features selection, and data transformation. Since the dataset that was used in the current research was different than those in existing literature, a controlled experiment was performed where the work of [20] was replicated as the baseline of this research.
The hybrid approach (RFMPQ & CLTV) was included in the third and fourth phase, where different methods were employed stepwise. As the data was transformed into three different variants, i.e., RFM, PQ, and T, the first processing step differed in one of them.
The classification was used to categorize customer purchase behavior into CLTV matrix based on the RFM and PQ dataset, while modified best-fit regression was performed on the T dataset to find the customer purchase trend (curve). Even though [20] only employed K-means technique, the present experiment was extended to include the utilization of K-means++ and (EM).
Subsequently, the outputs were fed into the clustering algorithms, i.e., K-means++ and EM at the fourth phase for further demographical segmentation. The accuracy of these clustering algorithms was measured during the final phase using the cluster quality assessment that was introduced by Draghici & Kuklin (2003). Additionally, the retention rate was calculated, and human judgment was also included as a measure of the effectiveness of this method for a marketing campaign.
The Methodologies for this research is illustrated in Fig. 1.
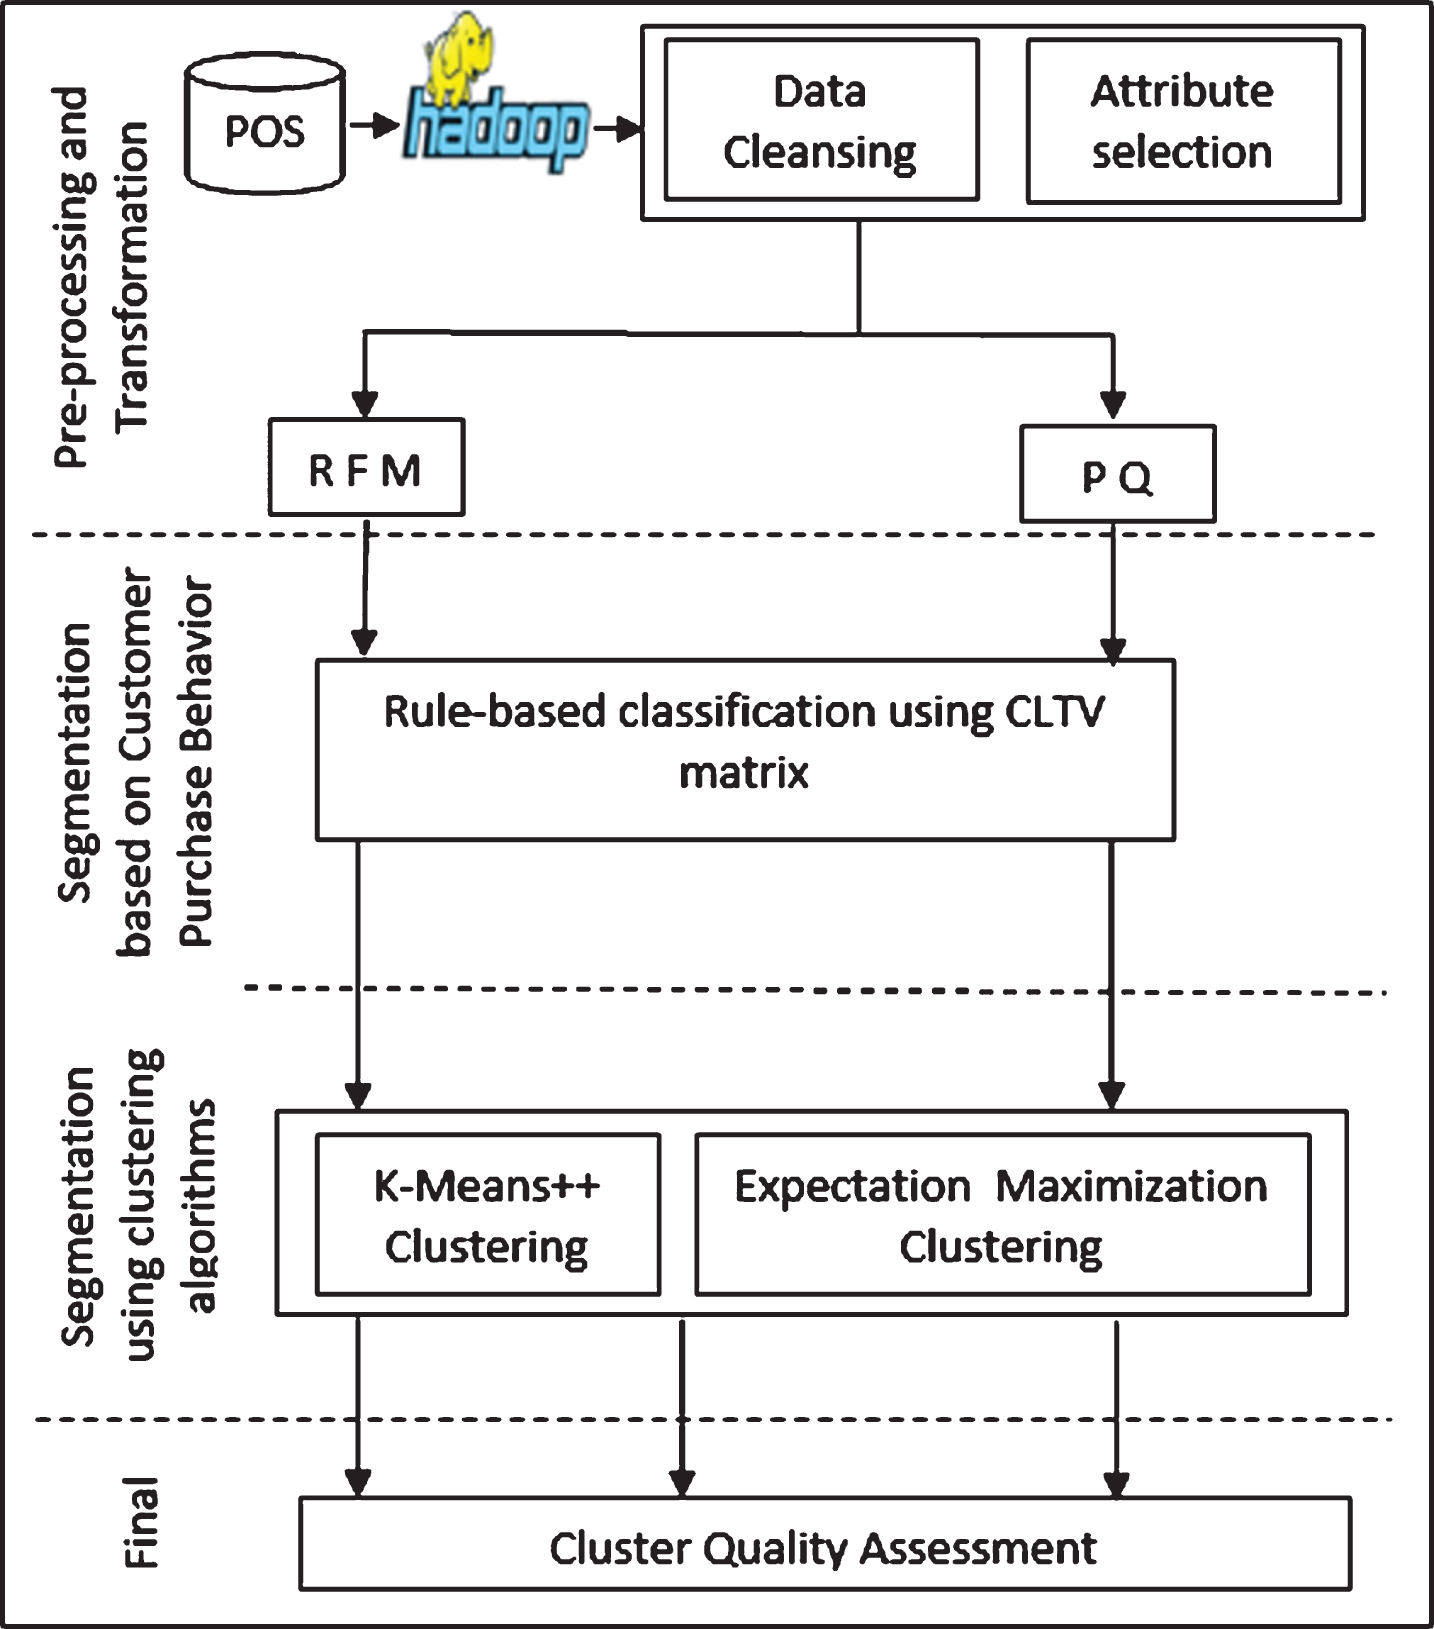
Methodologies for the hybrid of classification and clustering of market segmentation.
In this study we are using Apache Hadoop on single-node Hadoop cluster using Ubuntu Linux 12.04 64 Bits Server Edition was preferred as the operating system and KVM (virtual memory) was selected as virtualization environment. Hadoop (HDFS) node was accessed via Secure Shell (SSH). In this study, no parameter or optimization adjustment was made on the operating system to cause performance improvement. This type of Hadoop implementation serves the purpose and sufficient to have a running Hadoop environment in order to conduct our experiment. The market segmentation model uses retail POS data acquired from a medium-sized retailer from the State of Kuwait. The POS data contains Three years (2012 –2015) of customers initial and repeated purchases who made their purchases at different geographical branches. Each transaction represented a product purchased, with each line consists of a cashier number, store-code, item-code, brand- code, product (quantity) sold, product price, date and time of the transaction, sub-total, grand total as well as the customer’s demographic information. Since the data was in separate compilations based on the stores’ geographic locations, a common data format with consistent definitions for more descriptive keys and fields was developed to merge the information. In this phase, the string variables are converted to numeric variables, and subsequently, missing values were checked and replaced default or mean values manually. In this research, the PQ variants will be used to describe customer’s purchase power in different demographic and behavioral eras and customer’s attractiveness to a specific product and service. For the T variant customers from the best segment are used to identify customer purchase curve, and we calibrate the market segmentation model using repeated transactions for 3220 customers over two years’ period.
The age attribute was grouped into four (i.e., ages from 1–17, ages from 18–24, ages from 25–34, ages from 35–44, ages from 45–54 and ages above 55). The age group analysis was based on the premise that a typical customer’s needs would change as they age. The customer’s age was classified into six categories, where each category was identified using a unique number. Category 1 = (1–17), Category 2 = (18–24), Category 3 = (25–34), Category 4 = (35–44), Category 5 = (45–54), and senior Category 6 = (55 +). The Gender attribute was encoded as 1 for Male customers, 2 for Female customers, and 3 for Companies. Furthermore, the demographic concept hierarchy method such as city and country was replaced by higher-level concept nationality. Citizens of Middle Eastern nationalities, Asian nationalities, USA, and Canada, were assigned unique numeric (binary) value. Other nationalities were grouped based on continents, namely Europeans and Africans. One exception was made for British nationalities due to the high volume of purchases. To ensure the maximum accuracy of RFM scores, the values of five-dimension attributes from the POS Data were necessary.
The attributes are described in Table 2 as follows:
Attributes of RFMPQ
Attributes of RFMPQ
The next step involved the calculation of RFM scores as well as the newly proposed variation PQ and T. The implementation of CLVT, retention rate, and RFMPQ and T are developed using advanced PL/SQL programming language. It must be noted that the RFMPQ score refers to the weighted average of its individual components in which the scoring analysis typically involves grouping customers into equal buckets (quantiles) sizes. As far as this study is concerned, the grouping procedure was applied independently to the five RFMPQ component measures.
Customers were grouped according to the respective measure into classes of equal sizes. The derived R, F, M, P, and Q groups became the components for the RFMPQ cell assignment. RFMPQ groups are aggregated, with appropriate client-defined weights, and the scores were the weighted average of its components.
The next step involved where values and scores of RFMPQ variables were determined and used as inputs of clustering algorithms. According to this research and the client’s requests, RFMPQ variables had equal weights (1:1:1).
The second variant proposed in this research was T variable, which represented the trend of customer purchase behavior using change rate. This study proposes a combination of two analytical data mining steps. For finding T, the change in consumer purchase behavior trend, it uses an enhanced best-fit regression algorithm. Then T dataset is then put into the unsupervised clustering algorithms, to split the consumers into different groups based on patterns dissimilarities. The variable T should answer a very important question if the consumer is at high risk of shifting his or her service to another retailer. One of the most common indicators of high-risk consumers is a drop off in purchase power and a decrease of visits. One of the most common indicators of high-risk consumers is a drop off in purchase power and a decrease of visits. Major limitations of market segmentation and RFM models is ignoring the behavioral changes of consumers during the time period of analysis. Although the recency variable acted as one of the indicators of such consumer behavior, it was affected by customers’ transient behavior, and it was only based on the last purchase date. Therefore, introducing a new analysis variable was essential for the retailer to narrow down high-risk consumers.
Based on the perspective of a retailer, average values change according to customers’ purchase and their satisfaction with the retailer in terms of price and services. If these average purchase amounts of a customer decrease continuously, it could be concluded that this customer is or was on the verge of shifting his business to another retailer. A similar conclusion can also be derived from a customer who had an increased average purchase value, showing that the customer was very profitable and should be ranked accordingly. Therefore, these customers with a variety must be treated accordingly. A computable parameter was developed through the introduction of some advanced programming. Firstly, the purchase amounts of all customers in each selected time period of analysis were required.
The drawback of the classic k-means algorithm is that the user needs to define the centroid point and offers no accuracy guarantees. This has become more critical when clustering documentation because each center point is represented by a word and the distance calculation between words is not a trivial task. To overcome this problem, a k-means++ was introduced in order to find a good initial center point. K-means++ is a simple probabilistic means of initializing k-means clustering that not only has the best known theoretical guarantees on the expected outcome quality but works very well in practice. According to [43–51] k-means++ algorithm is another variation of the k-means algorithm, a new approach to select initial cluster centers by random starting centers with specific probabilities are used. The steps used in this algorithm are described below. In this regard, the essential component required is the preservation of the diversity of seeds while ensuring that the outliers remain robust. The primary concern of the k-means problem is to identify cluster centers that minimize intra-class variance by reducing the distances from each clustered data point. This can be achieved through an effective and well-designed cluster-initialization technique. k-means++ was proposed in 2007 by [42] for choosing initial values (seeds) for the classic k-means clustering algorithm to avoid poor results found by the k-means clustering algorithm. K-means++ algorithm initializes means more intelligently so that there is a distribution of cluster means that is roughly even relative to the data. K-means++ accomplishes this by selecting the first cluster center at random and then drawing the next sample from a distribution that puts a heavy probability weight where there are data and no close-by cluster center. The execution of K-Means++ and EM algorithms is carried out using WEKA tools, then the generated results are exported into excel for easy comparative analysis. We evaluate the performance of the market basket based on the mean calculated across three years forecast customers’ sales transaction. The K-means++ algorithm equation’s method is explained below. The K-means++ algorithm comes with a theoretical guarantee to find a solution that is O (log k) competitive to the optimal k-means solution. It is also fairly simple to describe and implement.
Expectation-maximization (EM) algorithm is an iterative estimation algorithm, a method similar to the K-Means algorithm introduced by Dempster, Laird, & Rubin (1977). The Expectation-Maximization algorithm is an important tool of a statistical and powerful method for obtaining the maximum likelihood estimation of the parameters of an underlying distribution when data contains null and missing values to generate an accurate hypothesis. There are three steps involved in EM technique, and the first was the EM clustering initialization. Every class j, of M classes (clusters), is formed by a vector parameter (θ), composed by two parameters the mean (μj) and the covariance matrix (Pj) which defined the Gaussian probability normal distribution as features used to describe or classify the observed and unobserved entities of the data set x. The Expectation Maximization (EM) algorithm was aimed to approximate the parameter vector (θ) of the real distribution. Cluster Convergence was the third step in M-step. After every iteration was performed, a convergence inspection was conducted to verify whether the difference of the attributes vector of an iteration to the previous iteration was smaller than an acceptable error tolerance given by parameter.
Quality assessment
One type of cluster quality assessment as suggested in [41] was performed in this study is to compare between the size (diameter) of the clusters versus the distance to the nearest cluster, the inter-cluster distance versus the size of the cluster is conducted in this study. This process can also be understood in terms of the distance between members of each cluster and the center of the cluster, and the diameter (size) of the smallest sphere containing the cluster. If the inter-cluster distance was much larger than the size of the clusters, then the clustering algorithm is considered to be trustworthy. The formula is explained as; min (Dij)/max (di) where Dij was the distance between cluster I and cluster j, where both i and j were from (1 to 6) and di is the diameter.
Figure 2 shows the quality can be assessed simply by looking at the cluster diameter. Therefore, the cluster can be formed by heuristic even when there is no similarity between clustered patterns. This is occurring because the algorithm forces K clusters to be created.
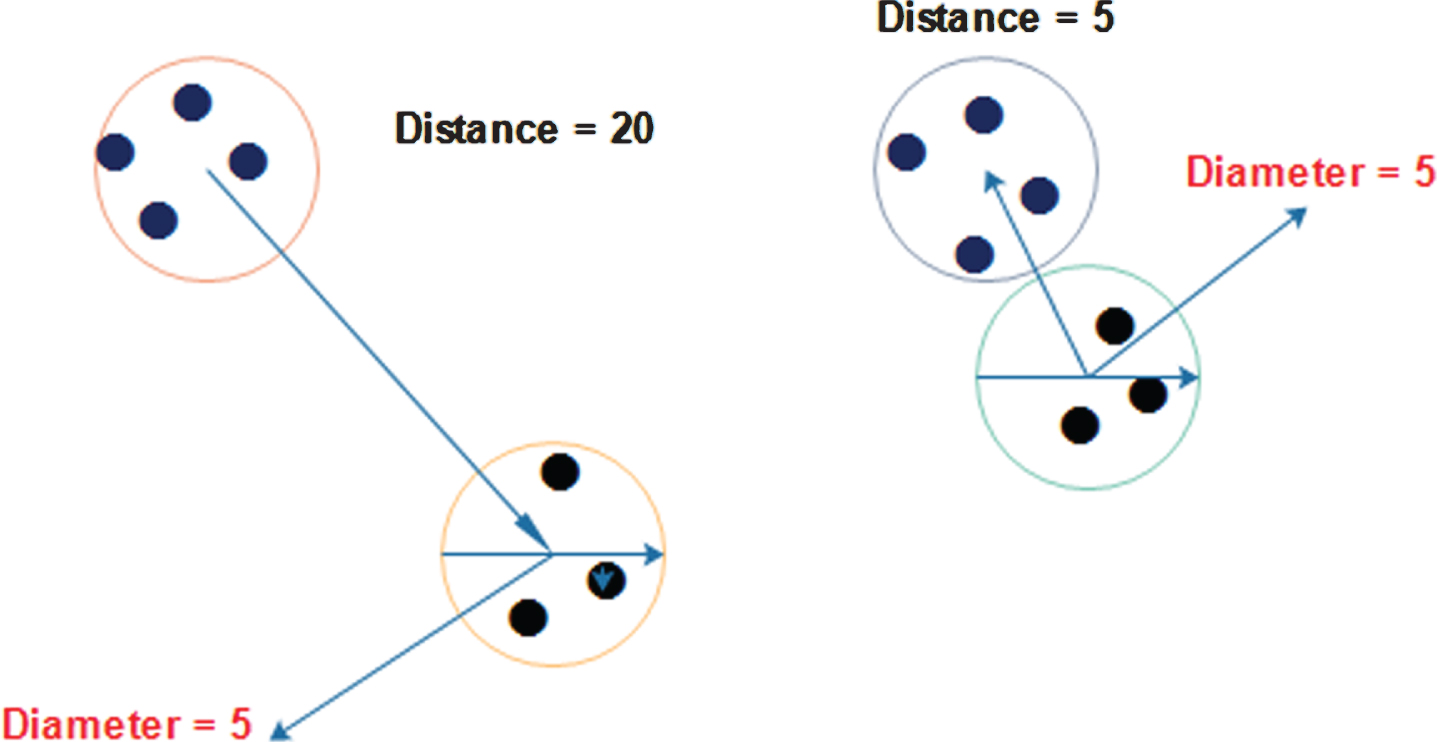
Cluster quality accessed by ratio of distance to the nearest cluster and cluster diameter: source (Draghici, 2003).
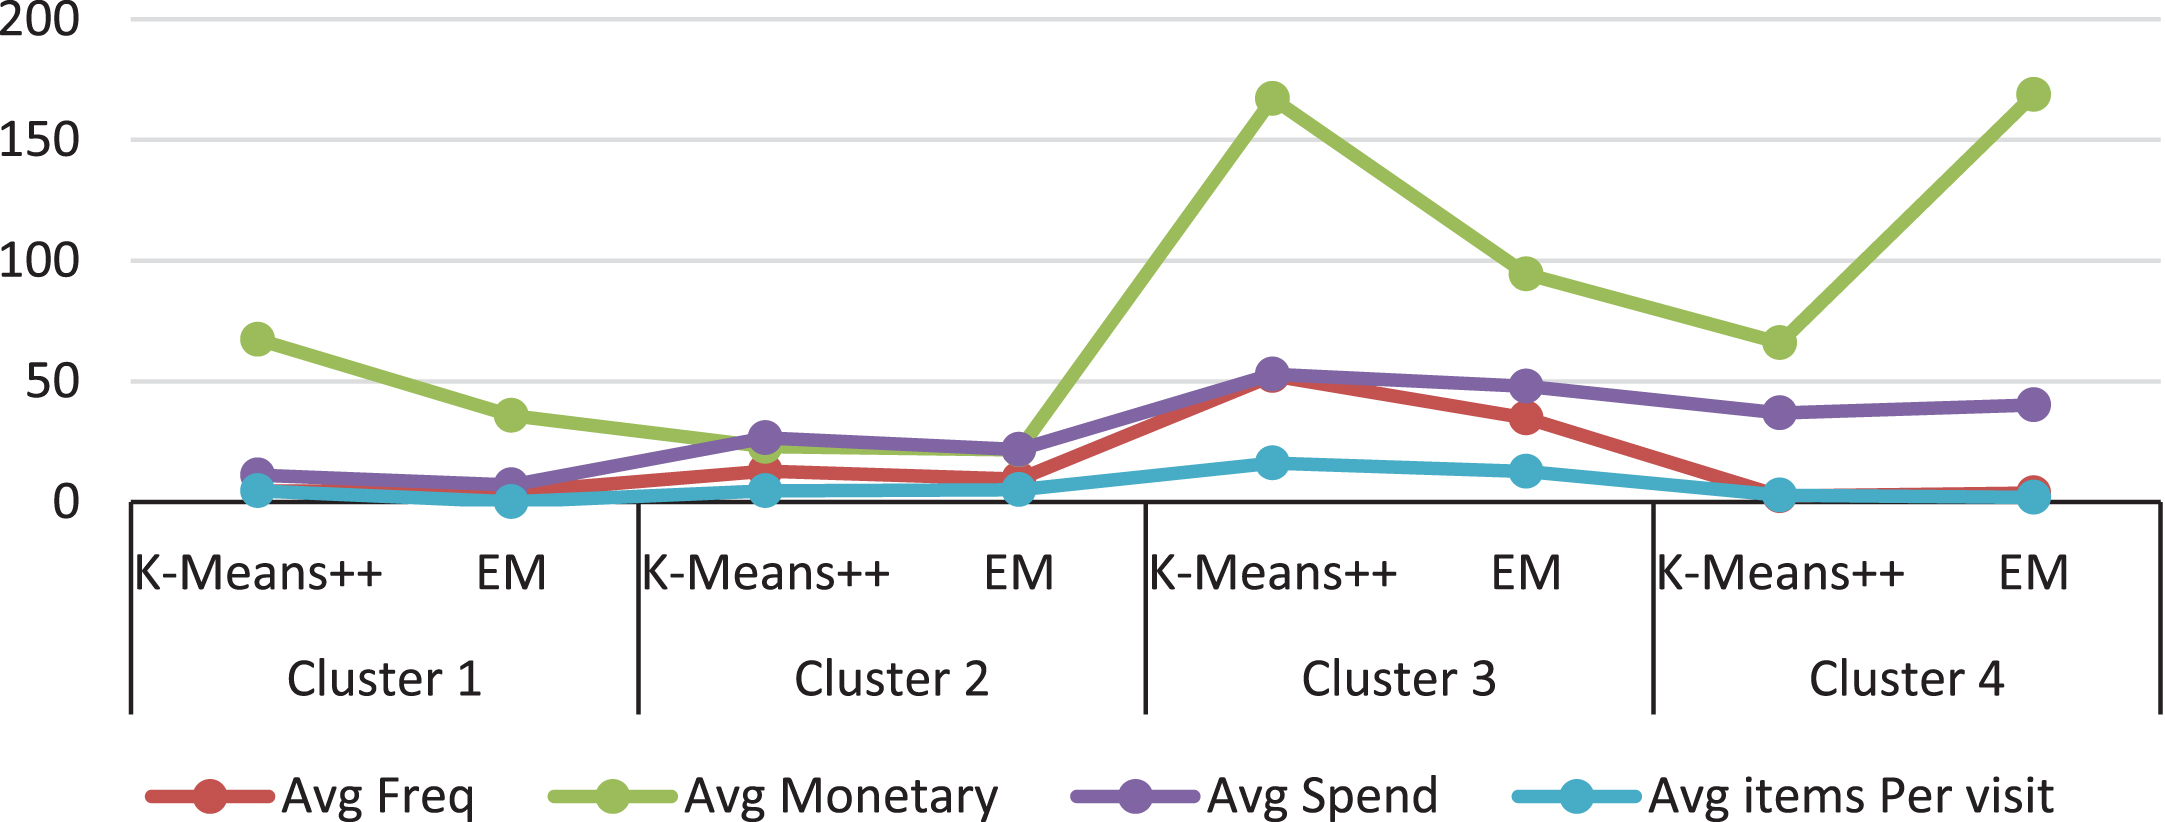
The main objective driven by the customer pyramid classification is to determine the segment in which customers spend more with the retailer over a period of time and also the segment that is less costly to maintain. The distribution of customers after using CLTV matrix on the RFMPQ dataset is illustrated in Fig. 3 with respect to their frequency and average monetary values. The findings generated by customer value matrix classification revealed that there were 7024 customers from who were categorized under the Best segment, 25153 customers fell under the Spender segment, 39107 customers were grouped in the Frequent segment, and 39624 customers were classified in the Uncertain segment. These findings indicated that most customers were shoppers with a limited and high budget.
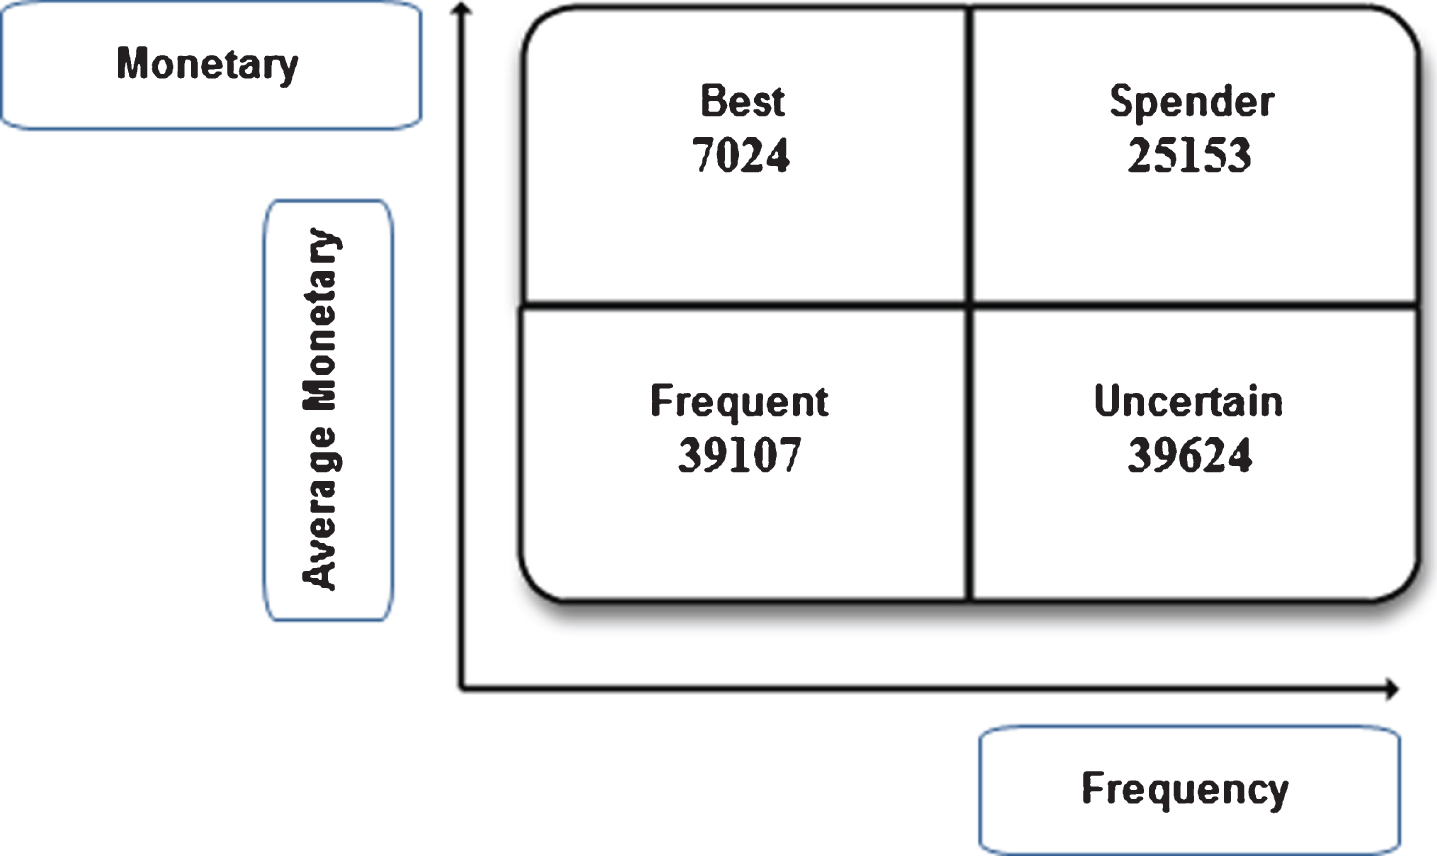
Effective customer pyramid classification.
Based on the results in Fig. 4, it can be observed that the analysis of K-means++ and EM clustering algorithms illustrated that both algorithms are agreeable on the gender and age segments. Cluster 1 is the most beneficial segment of customers. The best spenders in cluster 1 are predominantly females from the age group (25–34) and (35–44). The cluster quality assessment of RFM dataset is shown in Table 3, clearly shows the K-means++ algorithm with the size of cluster 328.4529657 compare with the EM algorithm 271.6329114 is far more accurate, because it’s largest value of inter-cluster distance divided by the size of the cluster.
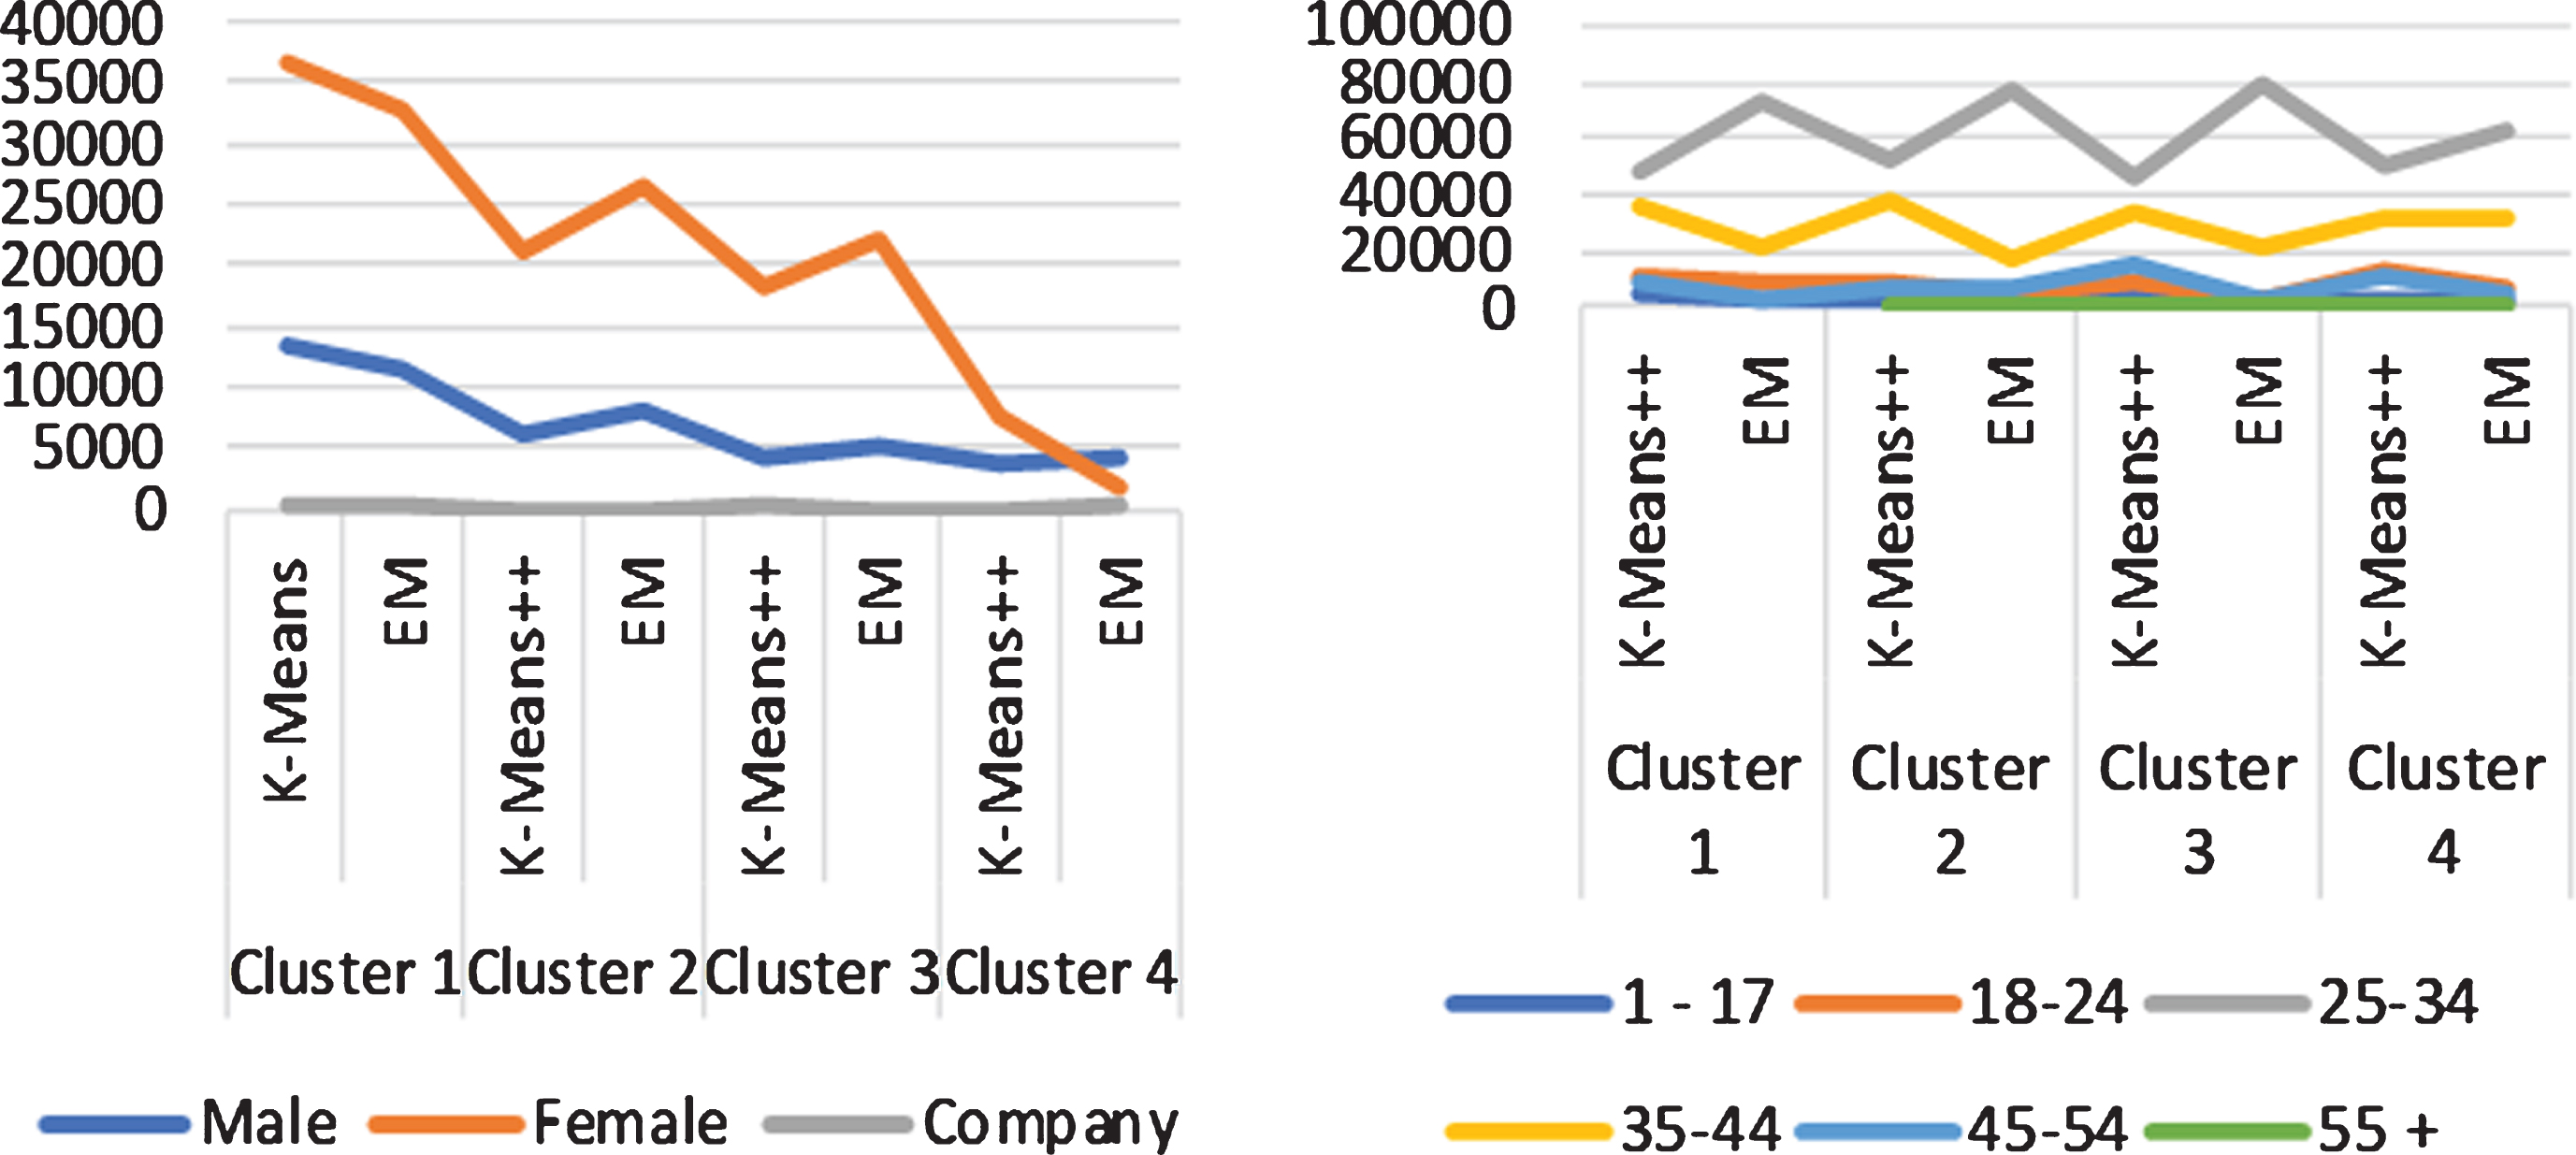
The average of four clusters generated by the K-means++ algorithm and EM algorithm for gender and age.
Since classification, according to the CLTV matrix was already applied prior to clustering, discussion on the results of this experiment is divided into subsection according to the quadrant of the CLTV matrix. The first section will elaborate on the demographic clustering for gender and age, where summaries for both gender and age are provided for each segment. The following section will discuss the cluster average shopping (visits) frequency, the cluster average monetary, and the cluster average spending per visit.
Results in Fig. 5. shows the summary for all four segments, namely best, spender, frequent and uncertain where most customers were females and their average age according to the cluster. In general, K-means++ is seen as the best clustering method except in the Best segment; the accuracy is very close due to the less number of customers. Each cluster will be discussed in further details with respect to the nationality in the following sections.
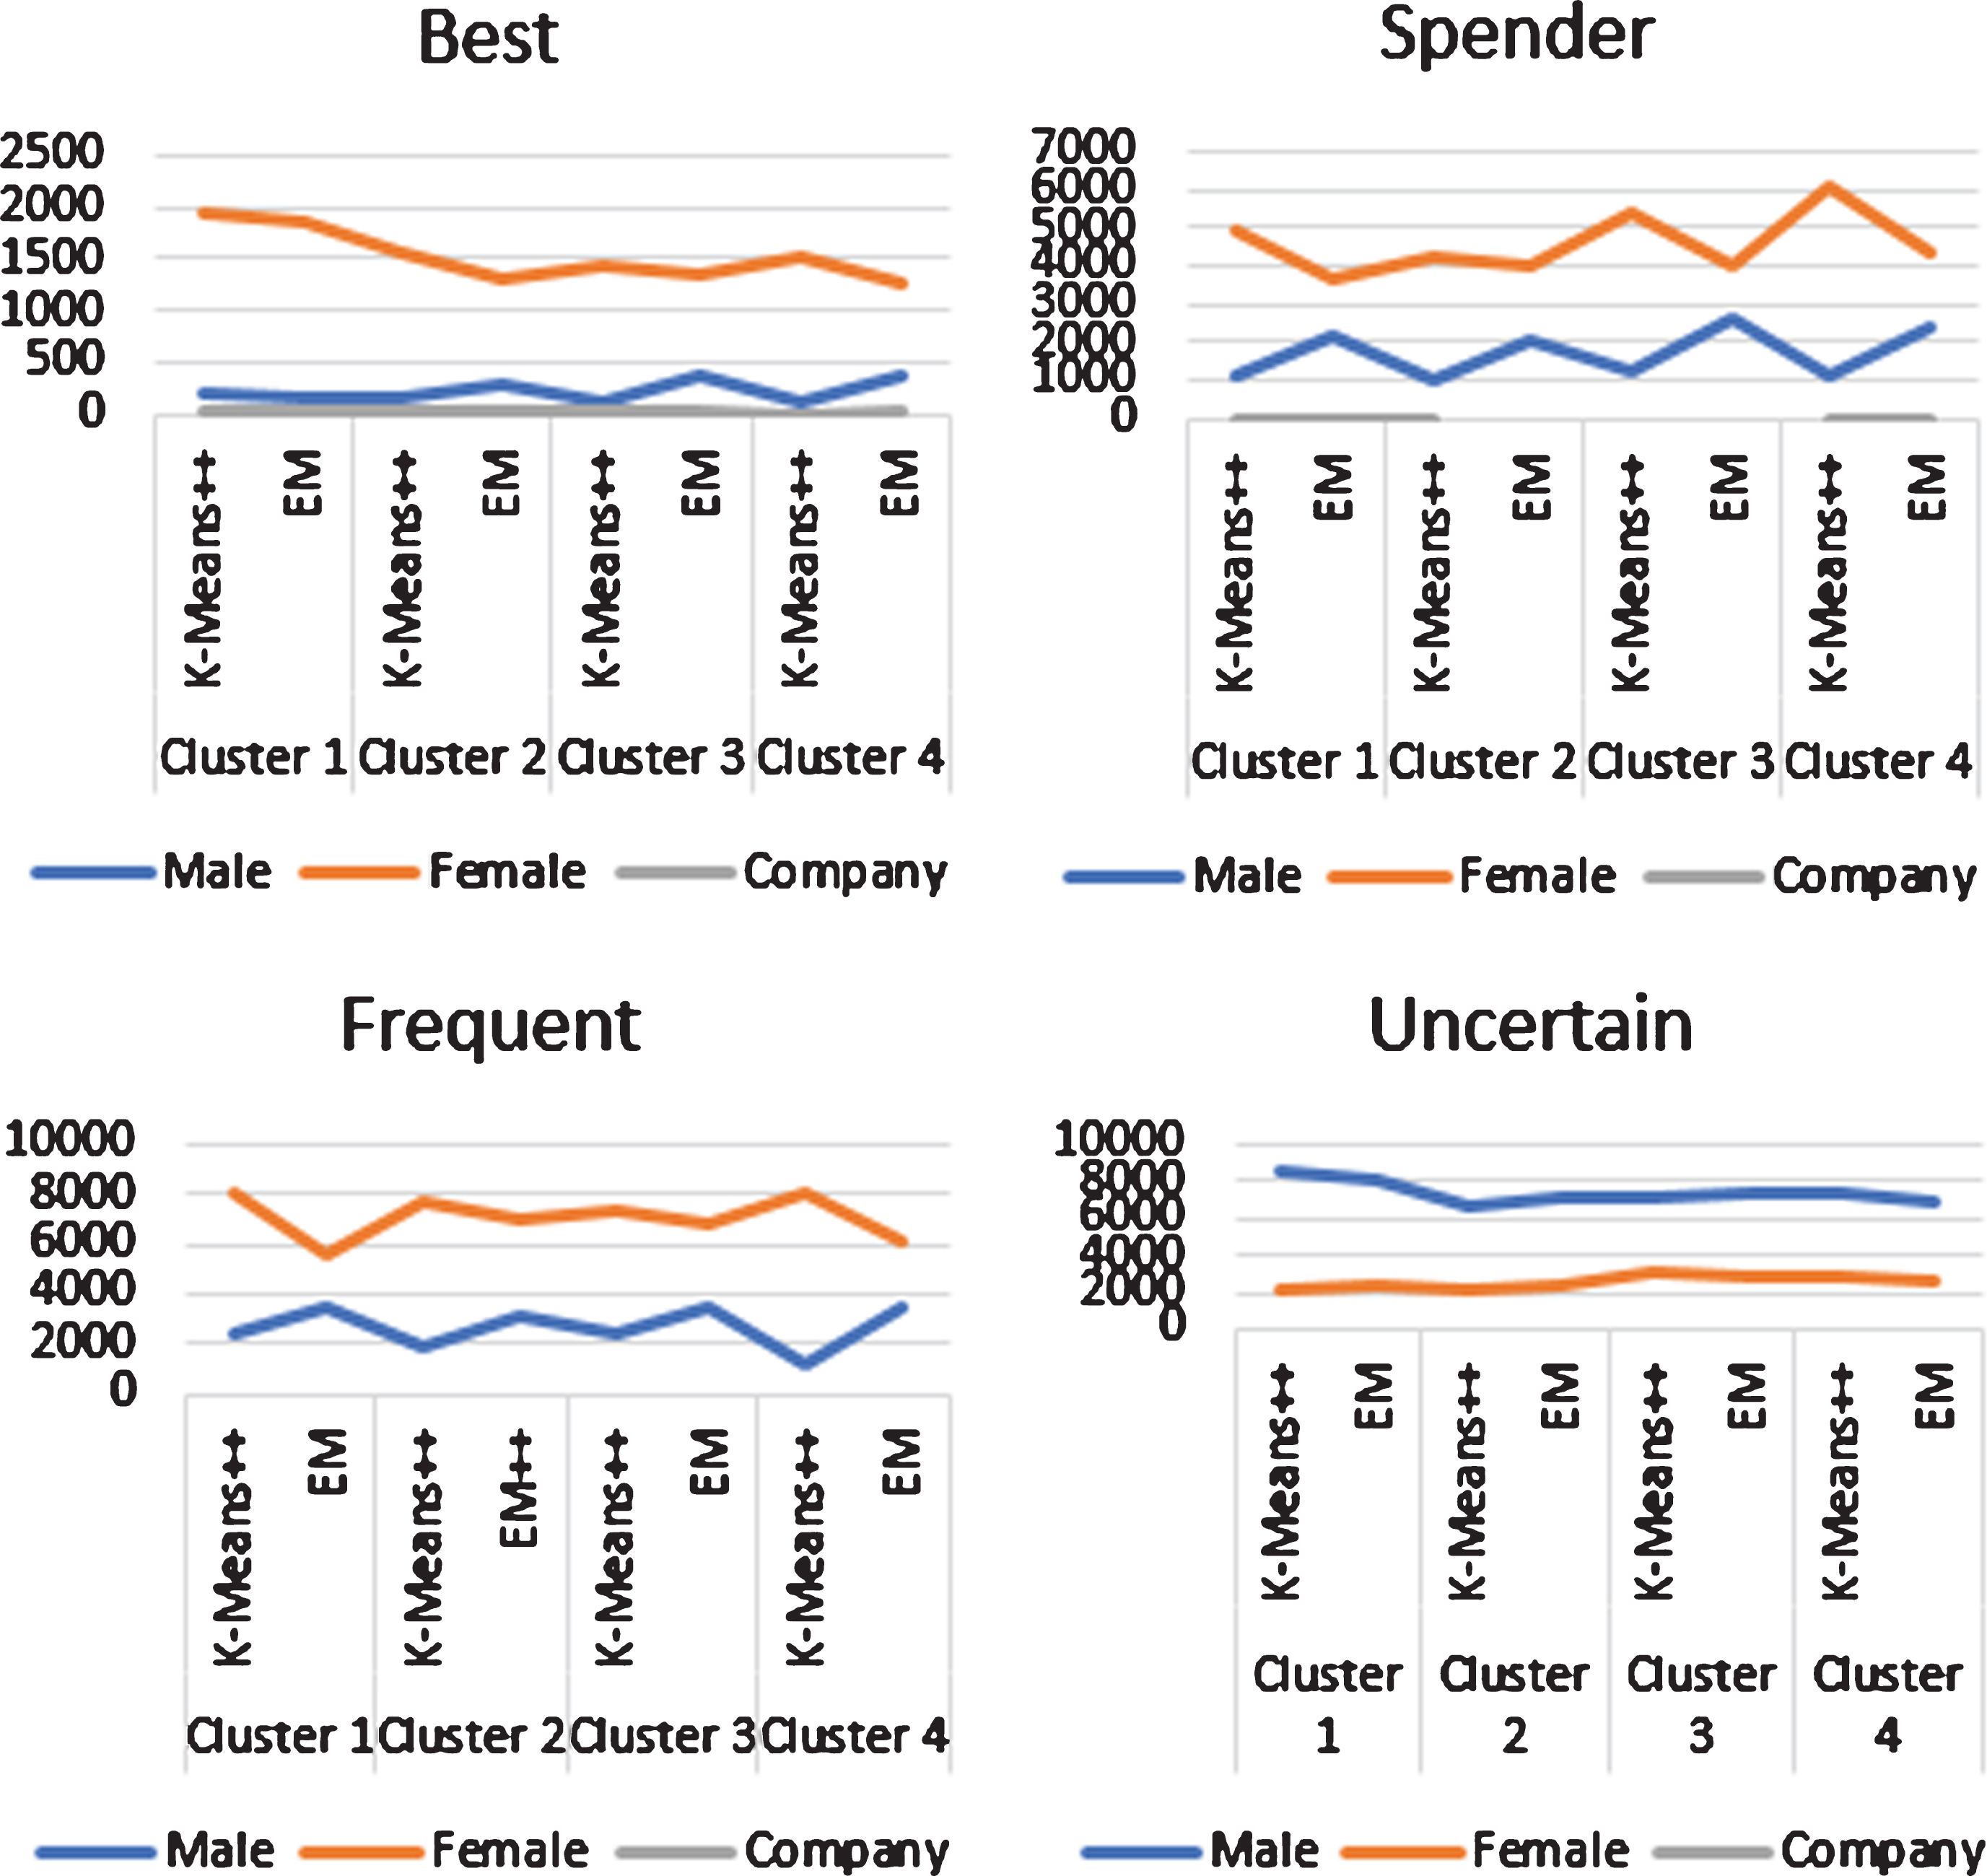
Summary for all segments in demographic clustering (Gender).
Figure 6 shows the four clusters for Uncertain segment as generated by K-means++ and EM Clustering. Total customers in this segment are 39624. The analysis in both clustering algorithms showed that cluster 1 was the most beneficial cluster (segment) because it was more superior to the other clusters in terms of the demographic variables.
Four clusters generated by K-Means++ and EM clustering for uncertain segment.
Average age results portrayed that customers were between the age of (45–54) are the most beneficial customers, and the average gender indicated most customers were male customers. In terms of the average nationality, citizens of the Philippines were considered as the best customers in average monetary when using K-Means++ and citizens of India were the best customers based on EM Clustering.
With regards to the Market Segmentation on RFMPQ dataset, it can be summarized that Best segment was the most profitable segment with its Total Average Spending Per Segment of (1109.37) compared to other segments. Cluster 2 was the most profitable cluster in the Best segment with most female customers and the age groups of (25–34) and (35–44). Meanwhile, the result for average nationality portrayed that citizens of Kuwait and UAE were the best customers in average monetary and it was discovered that both K-means++ and EM showed similar accuracy. The Spender segment was the second most profitable segment with the Total Average Spending Per Segment of (834.01). Cluster 4 of this segment was the most profitable cluster with an average monetary of (924.19).
Females customers, those between the ages of (25–34) and (35–44) as well as the citizens of Kuwait and Qatar were the best customers, and it was also shown that K-Means++ algorithm was the most accurate. Next, the Frequent segment was the third most profitable segment with the Total Average Spending Per Segment of (349.57), and it was noted that cluster 1 was the most profitable cluster with an average monetary of (397.81). Female customers, the age group of (35–44) and citizens of the UAE and Bahrain were the best customers. K-means++ algorithm was regarded as the most accurate algorithm for this cluster in Frequent segment.
The Uncertain segment was the least profitable segment with its Total Average Spending Per Segment (168.59). Cluster 1 was the least profitable cluster with an average monetary of (239.14). Female customers, those in the age group of (45–44) and citizens of the Philippines and some Arab nationalities were the best customers, and K-means++ algorithm was the most accurate algorithm for this cluster in Uncertain segment. Based on the comprehensive information extracted from the RFMPQ dataset, it is concluded that (a) the newly proposed PQ method can fulfill both robust classification and robust segmentation for market segmentation model, even in the dataset that has noisy data. Also, it is noted that (b) The (PQ) is the most important variable, and it has also been proven as a crucial parameter for clustering.
Predictive customer lifetime value
Predictive CLTV Matrix projects the new customers’ expenses over their entire lifetime with the retailer. Most retailers measure CLTV in dollars or based on the retailer’s local currency spent by the customer over their entire relationship with the retailer, i.e., from the first to last transaction. Nevertheless, it is essential to consider COGS (Cost of Goods Sold) and acquisition cost to square off the real CLTV. Predictive Customer Lifetime Value (CLTV): Estimation of the customer’s future value also considers the customers’ expected lifetime and potential monetary value from new purchases. Furthermore, based on the clients’ request, the static discount rate is set 25% in, of which 25% is minced from the total sales. The acquisition cost, which is also set based on clients’ request, which is 400 becomes the estimated figure or percentage of how much is spent to attract new customers.
Customer lifetime value ranking matrix
CLTV ranking groups customers into quadrants according to their profitability and retention propensity. CLTV ranking can assist marketers in performing more effective market segmentation [17]. This is accomplished through the incorporation of RFMPQ and RFMT values with the CLTV to rank the total sales quarterly and yearly using the ranking matrix analytical function, as shown in Fig. 7.
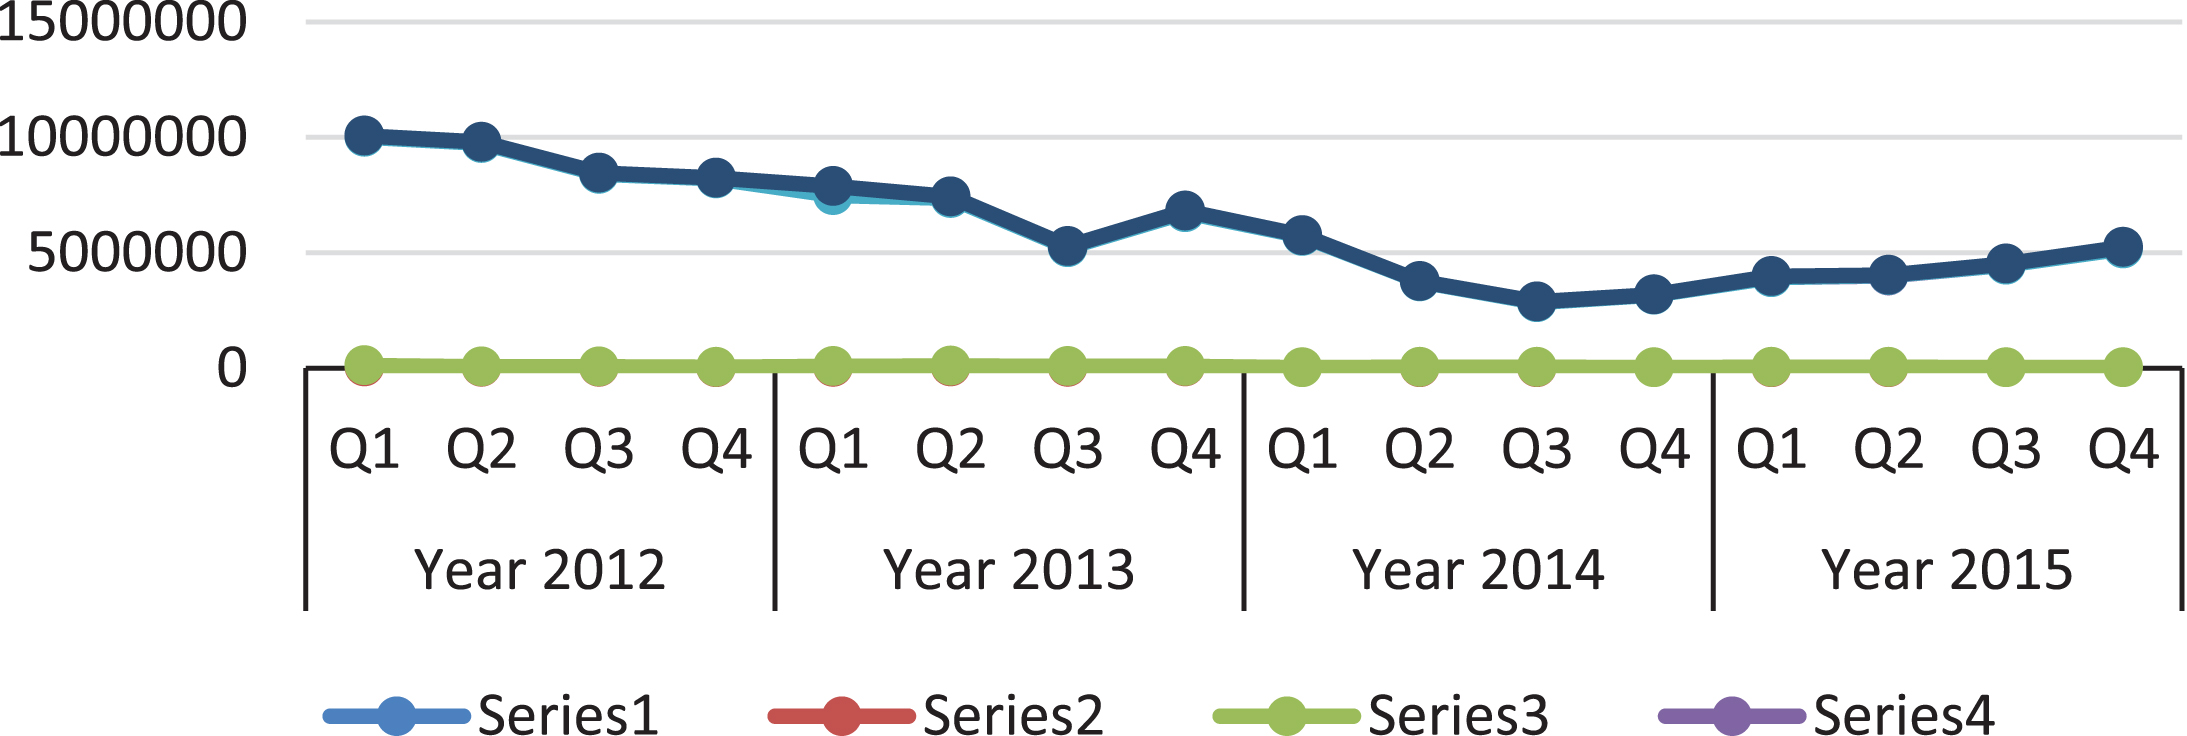
The result from the strategies implemented using ranking matrix.
Experimental results on CLTV using Ranking Matrix, which is presented in Fig. 7 reflects the success of the implementation of the market segmentation data mining model. Important to note, the test POS dataset is from 2012 to 2015. The client noticed a drop in sales and a decline in foot traffic in the second half of 2011. However, the development of our Market Segmentation model started in 2013, and our market segmentation model was implemented in the fourth quarter of 2014. The analysis indicated that the client had lost customers and sales immediately dropped in quarter 1 of 2015 as a direct result from the shift of mass marketing strategy to target marketing strategy using market segmentation methods. This is considered as a healthy result due to the shifting from mass marketing to more customized market segmentation. Nonetheless, in quarter 2 and onwards, the client has gained a small increase in sales, and a new group of customers has been retained. Results also revealed that the retailer started to turn profitable, starting with quarter 3 and big growth in quarter 4 of 2015.
A consistent result was observed from each quarter in 2015. Thus, the client strengthened its market position and made slow the effects of a rapidly weakening overall retail market. It is generally portrayed that the average lifetime of the customer is only two years, and the churn rate is 52% (see Table 6), resulting in the development of a comprehensive marketing strategy. Results have shown that the incorporation of RFMPQ model and CLTV.
Matrix was the best method to categories and classified different consumer segments and different potential consumer segments by long term profitability. Each of the market segments will be further investigated and analyzed to provide specific characterizations, better understanding and identification of opportunities, as well as the profitability and the existence of risks as each segment no longer encompasses the entire market. Based on the segments identified, the retailer should create a tailored campaign for each segment and offer separate services that distinguish these segments to maximize responses according to each segment’s behavior. Finally, based on the experiment results, it can be positively concluded that the newly proposed RFM (PQ) and (T) were far more efficient than the traditional RFM in classifying and clustering the segmentation of customer value via RFM attributes. Kindly note that the implementation of this work was done in 2015; however, for some circumstances, our documentation and publication process was delayed for quite some time.
This study has introduced a new technique of CLTV and proposed three new RFM variations P, Q, and T. Firstly, the new RFM variations P, Q, and T, which have some advantages over the standard RFM model. The advantage of these newly proposed methods is that the RFMPQ method takes into consideration the changes in the customer’s average shopping power over time as well as the average purchase power of products purchased over time by a given customer. “The new proposed PQ provided key attributes describing customer’s purchase behavior in different demographic eras. The P variant helped to identify which segment of customers spends more over a period of time and costs less to maintain. The Q variant helped to identify customer’s attractiveness to a specific product and service, and also helped to identify best-selling products, which resulted in increase of sales potential in terms of number of units of best-selling products that can be sold.” The market segments were constructed through several clustering algorithms such as K-Means++ and EM. To convert this idea into a computable dynamic parameter, newly modified best-fit regression algorithm and RFMT variable were proposed. The new modified regression algorithm demonstrated a high degree of accuracy in strengthening and reinforcing the effect of the customer’s most recent T purchase while justifying the importance of previous consumer’s purchase. However, more modified regression algorithm can be further extended to highlight key customer’s trends using new demographic variables, like profession, income level, spending methods, and online spending. Results of the application of the new RFM PQ T variations have reflected their effectiveness for market segmentation and their ability to offer the retail industry with intelligent analysis to combine customer and product profitability. This type of analysis can also identify the area in which marketers should focus their attention to as well as ensuring the highest level of quality and customer service. Additionally, these models help retailers identify VIP consumers who are on the verge of shifting taken their business to another competitor. Products that are highly profitable and purchased by the most profitable segments can also be easily identified. Results of the analysis results as well as the marketing experts have agreed that the classification of customer purchase behavior using CLTV matrix against RFMPQ dataset revealed the most accurate and crucial information about customer purchase behavior.
Furthermore, results have also indicated that age and gender variables provided an accurate result with an estimated analysis accuracy of 75%. Nevertheless, the nationality variable presented a low percentage of accuracy in both algorithms, possibly due to the missing and noisy data related to these variables. The results of applying the new RFM PQ and T variations have portrayed their effectiveness which resulted in the sales growth rate of up to 6% for market segmentation and their ability to offer the SMR industry with intelligent analysis to combine customer and product profitability.
Secondly, the retail is data-driven industry and process large POS transactions Increase in the collection of data is often seen as bottlenecks for Big Data analysis. Many retailers face the challenge of keeping data on a platform, which gives them a single consistent view. Although Hadoop is not the main focus of this study, however, in this study, the capabilities of Hadoop was investigated. Hadoop implementation provided a highly scalable data distribution and lighting data analysis performance.
Finally, it has been proven that sophisticated statistical modeling methods can provide useful information for experts, but at the same time they are costly and complex to implement and are likely to present a challenge to the implementation of marketing strategies. This study proposed a simple yet powerful approach to market segmentation. The results have shown the model provides easy to implement and affordable market segmentation methodologies that deliver substantial value relative to the amount of effort involved. The analysis results discovered from the (Best, Spender, Frequent, and Uncertain) provided the client a guided vision on how to calculate customer lifetime value and retention.
Further search recommendation is to examine the implementation of large POS dataset on multiple clusters and scaling the cluster by adding extra nodes across several inexpensive servers. Finally, ignoring consumer behavior purchase behavior trends can be disastrous. Further research is needed for more Explanatory data mining model like Market Basket Analysis to help to identify what the profile of the future customer might look like from a product perspective.
Funding
This research received no external funding.
Footnotes
Acknowledgments
We are grateful for the support given by the University Sains Malaysia where Y.A.F completed his Masters on this research, under the supervision of N.H.A.H.M.