
Abstract
Intelligent lesion detection system for medical ultrasound images are aimed at reducing physicians’ effort during cancer diagnosis process. Automatic separation and classification of tumours in ultrasound images is challenging owing to the low contrast and noisy behavior of the image. A Computer aided detection (CAD) system that automatically segment and classify breast tumours in ultrasound (US) images is proposed in this paper. The proposed method is invariant to scale changes and does not require an operator defined initial region of interest. Wavelet modulus maxima points of the US image are analyzed to extract the tumour seed point. The lesions segmented using a region-based approach are classified using a support vector machine (SVM) classifier. Evaluation of various performance measures show that the performance of the proposed CAD system is promising.
Introduction
Breast cancer is a major cause of mortality among women all over the world [1]. Detection of breast cancer in its initial stage is very important to reduce the death rate. Early detection of the disease needs a reliable diagnosis which can accurately discriminate between benign and malignant tumours. Though mammography is a widely used imaging modality for breast cancer detection, it has certain drawbacks. Due to the low contrast nature of the mammogram, it is hard to determine the presence of a tumour in dense breasts with mammography alone [2]. There is a high risk of radiation and false positive rate in diagnosis with mammography [3]. In addition, it is very difficult to discriminate between solid and cystic masses from a mammogram. Using ultrasound images cystic and solid masses can be easily distinguished. Therefore, breast ultrasound is often suggested as an adjunct to X-ray mammography when breast cancer is suspected [4]. Presence of a lump or mass is an important symptom associated with most breast cancer cases. The benign or malignant nature of a breast tumour can be deduced from the geometric features associated with the tumour such as tumour boundary, shape and margin [5]. Texture characteristics also provide useful information regarding the tumour class [6]. Because of the noise and low contrast nature of ultrasound images accurate visual interpretations about the nature of abnormality associated with a breast lesion is difficult [7]. Computer-aided detection (CAD) system for breast cancer is aimed at characterizing the disease from features extracted from images of a breast. A CAD system, which can automatically detect and classify breast cancer using breast images can greatly reduce the efforts of radiologists, especially during a breast cancer screening process. The ultrasound image is often contaminated with speckle noise which makes accurate delineation of tumour boundary and other geometrical features difficult [8]. In CAD systems segmentation of the tumour is very critical as the correctness of features derived from it and the accuracy of the final classifier stage greatly depend on it [9]. Therefore, the segmentation of the tumour is still a challenging task in many CAD systems employing ultrasound images.
A novel method for automatic detection of breast lesions in ultrasound images is proposed in this paper. The multiscale modulus maxima analysis of the wavelet transform coefficients of the image is employed to detect tumour seed points in ultrasound images. The tumour segmentation is then performed by region growing on the automatically detected tumour seed point. The proposed method is scale invariant and does not require manual initialization of a region for the segmentation process. Another contribution of this study is the identification of a set of BUS image features that can provide better classification accuracy with a parameter optimized SVM classifier.
Related works
Methods to segment tumours in 2D breast ultrasound images based on histogram thresholding [10], region growing [11, 12], neural network [13], level set [14] have been reported. Separation of breast tumour from the surrounding regions by optimizing an average radial gradient index for regions grown from the detected points, is reported with a sensitivity of 94% [11]. A CAD system that utilizes texture features and an SVM classifier to differentiate breast tumours has been proposed in [15]. Sehgal [16] investigated the use of quantitative margin features distinguishing malignant and benign breast lumps in breast ultrasound images. Segyeong [17] presented a CAD tool to identify the malignancy associated with a breast mass using sonographic features and artificial neural network. This model which used various sonographic features such as the shape, edge characteristics and intensity of a tumour reported a sensitivity of 99.3%. Woo Kyung Moon proposed a CAD system for breast cancer detection using dominant sonographic characteristics including tumour shape, orientation, margins, echo pattern, and posterior acoustic features and reported a sensitivity of 90% [18]. A CAD system employing the principle of blob detection using Hessian analysis to detect the tumours in ultrasound images was proposed in [19].
Many current approaches to tumour segmentation in BUS images are model-based methods such as level set, active contours [19, 20] and Markov random fields (MRF) [21]. In many of these model-based approaches, tumour separation is based on optimizing an energy function. A manually initialized Region of Interest (ROI) is required in many of these model-based approaches of breast tumour segmentation.
Method
In the proposed CAD system for breast cancer, the breast ultrasound images are first preprocessed to suppress the speckle noise. From the preprocessed image, homogeneous regions which possibly contain a tumour are extracted by means of filtering and morphological operations. A set of candidate seeds for region growing are identified by analyzing the wavelet modulus maxima points in the extracted region. Criteria were formulated to identify the correct seed from the candidate seeds. The tumour area is then separated from the background by employing region growing on the detected seed point. Finally, segmented tumours are classified using an optimal SVM classifier trained by appropriately identified feature set. A data set consisting of 170 BUS images (96 benign cases and 74 malignant cases) acquired from http://onlinemedicalimages.com is employed to evaluate the algorithm. The algorithm was also tested on 70 images supplied by the Lakeshore Hospital, Kochi, India. The flowchart for the tumour detection algorithm is shown in Fig. 1.

Flow chart of the algorithm for tumour identification in BUS images.
Ultrasound images are contaminated by speckle noise which is multiplicative in nature. The speckle noise commonly appears as a granular pattern superimposed over the ultrasound image. Speckles are formed in an ultrasound image due to the interference of the reflected waves from scatterers that are typically much smaller than wavelength of the ultrasound wave. Speckle noise affects the accurate evaluation of the tumour boundary and margin which are crucial features in deciding the nature of the breast lesion. Image preprocessing is intended to remove the speckle noise without affecting the significant image features. Pre-processing steps in the proposed work involve speckle suppression by means of shearlet transform and contrast enhancement using histogram equalization.
Shearlet transform
Shearlet transform is an effective tool for multiscale and multidirectional image analysis and processing [22]. The basis functions of the shearlet transform are distributed at various scales, locations, and orientations. Due to the high directional sensitivity property, shearlets can easily capture anisotropic edge features in an image. Shearlets are well localized and can provide an optimally sparse representation of a given image [23]. The shearlet transform is characterized by three parameters viz. the scale a, the orientation s and the location t.
The shearlet transform of a function f with respect to the shearlet φ
ast
is defined as
The factored form of the matrix M is given by
In the proposed work, despeckling is implemented by decomposing the speckled ultrasound image with the shearlet transform and the subsequent modification of the sub-band coefficients speckle suppression. This is achieved without affecting the important edge information in the image. A logarithmic compression is first applied on the speckled BUS image to convert the multiplicative speckle to an additive form of noise. In order to suppress the noise effectively, a multi-level decomposition using shearlet transform is performed on the BUS image. The discrete shearlet transform applied to the speckled image decomposes the image into various sub-bands. Subsequent level dependent hard thresholding on the sub-band coefficients eliminate the noise components without affecting the significant image features. The limit for hard thresholding at each level m is chosen as
Segmentation of tumour area from the background region involves four major steps viz, extraction of suspicious tumour regions from the US image, identification of a set of candidate tumour seed points [26], selection of an appropriate single tumour seed point from the candidate seeds and finally a region growing process to separate the tumour from the background region.
Extraction of suspicious tumour regions
In ultrasound images, tumours can be considered as homogeneous regions having some form of similarity in intensity or texture variations [19]. In the proposed method, the first step in the segmentation process is to identify the homogeneous regions which have high probability of containing a tumour. Once such homogeneous regions are identified further search for a tumour candidate can be confined to within that region.
The homogeneous regions in the BUS image are obtained using the SUSAN (Smallest Univalue Segment Assimilating Nucleus) filter [24]. Homogeneous regions in images are characterized by pixels having very similar intensity. SUSAN filter identifies these regions by moving a circular mask over the whole image. When the mask is moved over the image, the image pixel which comes at the center of the circular mask is called the nucleus and the local circular area of the image inside the circular mask is called Univalue Segment Assimilating Nucleus (USAN). The SUSAN filter response is given by
The output image of the SUSAN filter represents the homogeneous areas in terms of pixel intensity similarities, which include the tumour as well as other uniform intensity areas in the breast ultrasound (BUS) image. In many cases the individual regions are connected and in certain cases peaks and dark regions within the tumour may cause unconnected areas inside the tumour region itself. This necessitates additional morphological processing to extract exact region containing the tumour [26]. Morphological thinning is used to eliminate unwanted connections between distinct homogeneous regions. To prevent vital data loss when tumour candidates are of very small size, small relevant regions (size < 50 pixels) are saved before performing the thinning operation. After performing morphological operations on the remaining relatively large regions, the preserved small regions are added back to it. As the BUS images are captured by manually positioning the probes, it is usually assumed that in the ultrasound frame, tumours occupy regions near the center of the image rather than the outer boundary portions. Hence a boundary constraint is also applied on the SUSAN output to remove the regions touching the boundaries. A tumour located at the center rarely extends upto the boundary. In order to retain such extended tumours a central ROI is defined before applying the boundary constraint. All regions touching the boundary extending into this central portion, are retained to obtain a modified SUSAN output. The ROI for further processing is extracted by masking the BUS image with the modified SUSAN output.
The wavelet transform of a function f (x) with respect to the mother wavelet Ψ is given by
In the continuous wavelet transform (CWT), the parameters a and b are continuous, whereas the discrete wavelet transform (DWT) is based on dyadic scaling and translation. The space-scale representation of signals using wavelet analysis has found extensive use in signal and image processing applications. Due to the constraints on the scale and location parameters, 2-D DWT has some limitations in detecting all the features in image processing applications. However, due to the increased flexibility in the scaling and translation operations, a 2-D CWT can extract more features of an image compared to DWT [28]. An analyzing wavelet which is rotation invariant or isotropic can detect singularities in all directions in images. The Mexican hat wavelet is one such rotation invariant wavelet given by
Mexican hat wavelet which acts as a second order operator in all directions can capture coarse structures in images at higher scales and fine details at lower scales. In this study, we explore multiscale analysis using Mexican hat wavelet to detect tumour seed point in breast ultrasound images.
Tumours in BUS images are nearly blob like structures [19]. Damerval [29] presented a method to identify blobs in 2D images using connected curves of modulus maxima at different scales. The concept of blob detection using scale space analysis is extended for tumour detection in BUS images. Multiscale analysis of the image is performed using continuous wavelet transform. The principle behind using wavelet modulus maxima for blob detection is that the wavelet transform outputs a low response where the image is smooth and a high response where there are singularities such as boundaries, edges or isolated regions. Hence by locating modulus maxima we can identify the singularities present in the image. At the finest scale the modulus maxima arise from isolated singularities present in the image. At coarser scales these modulus maxima are due to several singularities, as translated and dilated wavelets cover a wider area. Modulus maxima at a scale can be related to the presence of a significant object. The computation of this characteristic scale and its localization are needed to detect blobs in scale space. For this we determine modulus maxima in scale space. The connected modulus maxima in the three-dimensional scale space is called a maxima line. A modulus maximum propagates from one scale to the next higher scale if their positions across the scales are close and if they have the same sign at these scales.
Tumour in a breast ultrasound image represent a significant structure, but in many cases, it is not identical to an exact blob. The shape of the tumour may differ from a blob, based on the nature of the malignancy associated with it. Hence blob detection method mentioned in [29] is not suitable for segmenting tumours of various shapes found in BUS images. Therefore, we focus on locating the tumour seed point by analyzing the wavelet modulus maxima points of the image at various scales of the wavelet function. The Mexican hat wavelet is chosen to perform the continuous wavelet transform for an integer scale varying from 5 (finest) to 100 (coarsest).
The modulus maxima at a scale indicates the presence of all significant structures corresponding to that scale. To obtain modulus maxima at each scale, the modulus image is divided into 3×3 blocks and the highest modulus value in each block is determined. The maxima lines (ML) are formed by connecting the modulus maxima points across the scales. The maxima lines for which there is sign change across the scales and whose maxima values increase or decrease on average with scales are discarded as they do not belong to a significant structure. For each of the remaining MLs the global maximum is evaluated and the corresponding scale and spatial coordinates are identified. The MLs which have their global maximum in the same scale and spatially close coordinates belong to the same structure. This grouping of MLs is done keeping in view of the formation of seed points rather than characteristic scale computation for blob detection. Maxima lines corresponding to a significant structure like tumour will merge at a particular scale after which the spatial coordinates corresponding to the global maximum will be the same for all MLs in that group. By identifying such merging MLs and corresponding spatial coordinates we can locate the tumour and extract the corresponding seed point. To do this, for each ML, a count is kept at the spatial co-ordinate corresponding to its global maximum, i.e. a count of modulus maxima at spatial co-ordinates are obtained. All co-ordinates with a modulus maxima count less than a pre-defined threshold (in this work 20) are discarded. Following this, a circular region with an arbitrary small radius r is grown over the remaining co-ordinates. Some of the grown regions may overlap. The centroids of the regions thus obtained are evaluated to form the candidate tumour seeds.
In order to retain the appropriate single seed representing the tumour, a seed selection criterion is applied over the set of candidate seeds as follows. To reduce the number of seed points, the seed points are grouped based on the Euclidean distance and the nearby seeds are replaced with a single seed. A mathematical score is then evaluated on each candidate seed point with the intensity and closeness of the seed point to the center of the image as the parameters. The closeness score of a candidate seed is unity if it is located exactly at the center of the image. The score value diminishes to zero for candidate seeds located at boundary.
In ultrasound images tumour regions are darker compared to the surrounding regions. Hence the intensities are grouped into two gray level regions with intensities 0– 75 & 76– 255 indicating tumour and non tumour regions respectively. The average intensity of a 16×16 neighborhood around each seed is considered for the computation of the score. All seed points with the score value below a threshold are eliminated. Out of the remaining seed points the one with maximum energy (using GLCM feature of the 16×16 neighbourhood) is selected as the final seed for segmentation.
A region growing algorithm based on intensity and entropy of the nearby pixels is employed to segment the tumour from the background region. After identifying the co-ordinates of the seed point, the mean intensity and entropy of a 4×4 neighbourhood are evaluated. The neighbouring pixels are checked and added to the region if the pixel intensity and entropy are close to the seed point. The region growing is continued until the region does not change further.
Features for tumour classification
In breast ultrasound images, tumour characteristics such as texture, boundary, shape and margin are decisive factors in classifying tumour as benign or malignant [5]. Due to the inherent limitations of the US image acquisition device, the captured images are of low contrast and noisy, which makes automatic detection of lesions as well as its classification very tough [8]. Hence it is essential to search a feature set which characterises the breast tumours in a better manner. In medical ultrasound images, textures are regional pixel intensity variations which characterize the scattering behaviour of the reflected ultrasound signals. Texture features derived from the ultrasound images are very effective in differentiating the tumour characteristics [9]. However, in ultrasound images, textural characteristics depend on device settings. The morphological features derived from the tumour characteristics such as lesion size, shape and margin are machine independent [14].
A set of five texture features from spatial domain as well as from the shearlet domain and seven morphological features from the segmented tumour area are investigated in this study to select an optimum feature set to characterize the breast tumour. Individual performance of the morphological, spatial and shearlet domain features as well as their combined performance are assessed to differentiate between benign and malignant breast tumours.
The features investigated for tumour classification in this study contain texture features extracted from the spatial and shearlet domains termed respectively as F
spatial
and F
shearlet
. Each of these feature set contains five GLCM features, viz. energy, entropy, correlation, contrast and homogeneity. A set of morphological features termed as F
morphological
extracted from the local characteristics of the lesion is also explored in the classification process. The seven morphological features that are computed to describe the tumour are.
The above four features are defined with respect to the tumour area. Considering an ellipse which encloses the tumour region the following morphological features are defined Orientation: – It is the angle that the major axis of the ellipse made with the horizontal x-axis. Eccentricity: – It is the ratio of the distance between the foci of the ellipse to its major axis length. LS
ratio
: – It is the ratio of the length of the major axis to the length of the minor axis of the ellipse
A support vector machine (SVM) separates the two classes of data by finding an optimum hyper plane that provide maximum margin between the two classes [31].
Consider a set of training vectors from separate classes given by (p1, q1) , (p2, q2) , (p3, q3) … … (pl, ql) where
We evaluated the performance of the tumour seed point detection, tumour segmentation and classification methods using the database containing 170 breast ultrasound images with a single tumour per image. The performance of the algorithm is evaluated by comparing the result obtained with the ground truth provided in the database which provides information about the type of lesion. The ground truth also includes manually marked tumour boundaries. For the seed detection process, the result obtained with an image is considered as true positive if the detected seed point is inside the tumour area. The result obtained is counted as false positive if the detected seed point is outside the lesion area.
To evaluate the effectiveness of the segmentation algorithm, the tumour area segmented from the BUS images are compared with the ground truth data. Quantitative evaluation of the segmentation is obtained using the area error metrics [33] which give a measure of the overlap between tumour region in the ground truth data and the tumour area separated by the proposed algorithm. The true positive area ratio (T
PAR
), the false positive area ratio (F
PAR
), and the Similarity Index (SI) are obtained as given below.
To assess the performance of the classification stage a p-fold cross validation is done by dividing the entire image set into p segments. The classifier is tested p times using each of these individual segments employing the remaining p-1 segments for training. The quantitative evaluation of the ability of the classifier to discriminate the benign and malignant cases is obtained in terms of accuracy, sensitivity and specificity which are defined as follows [33]:
The results obtained at various stages of the automatic tumour segmentation process are illustrated in Figs. (2–4). Out of the 170 images, in 168 cases the seed detection algorithm detected the seed point inside the tumour area of ground truth image. The method is also compared with a method [34], based on an iterative thresholding scheme to identify the regions of interest (ROI). Tumour seed is then detected by applying ranking criteria based on the region area, pixel variance and distance of regions from the center of the image. The method is implemented on our dataset of 170 images. The result achieved for tumor seed detection process are provided in Table 1. The evaluation of the tumor segmentation algorithm demonstrated a true positive area ratio of 90.1% and a similarity index of 85%. The performance comparison of the segmentation algorithm with earlier methods is provided in Table 2.
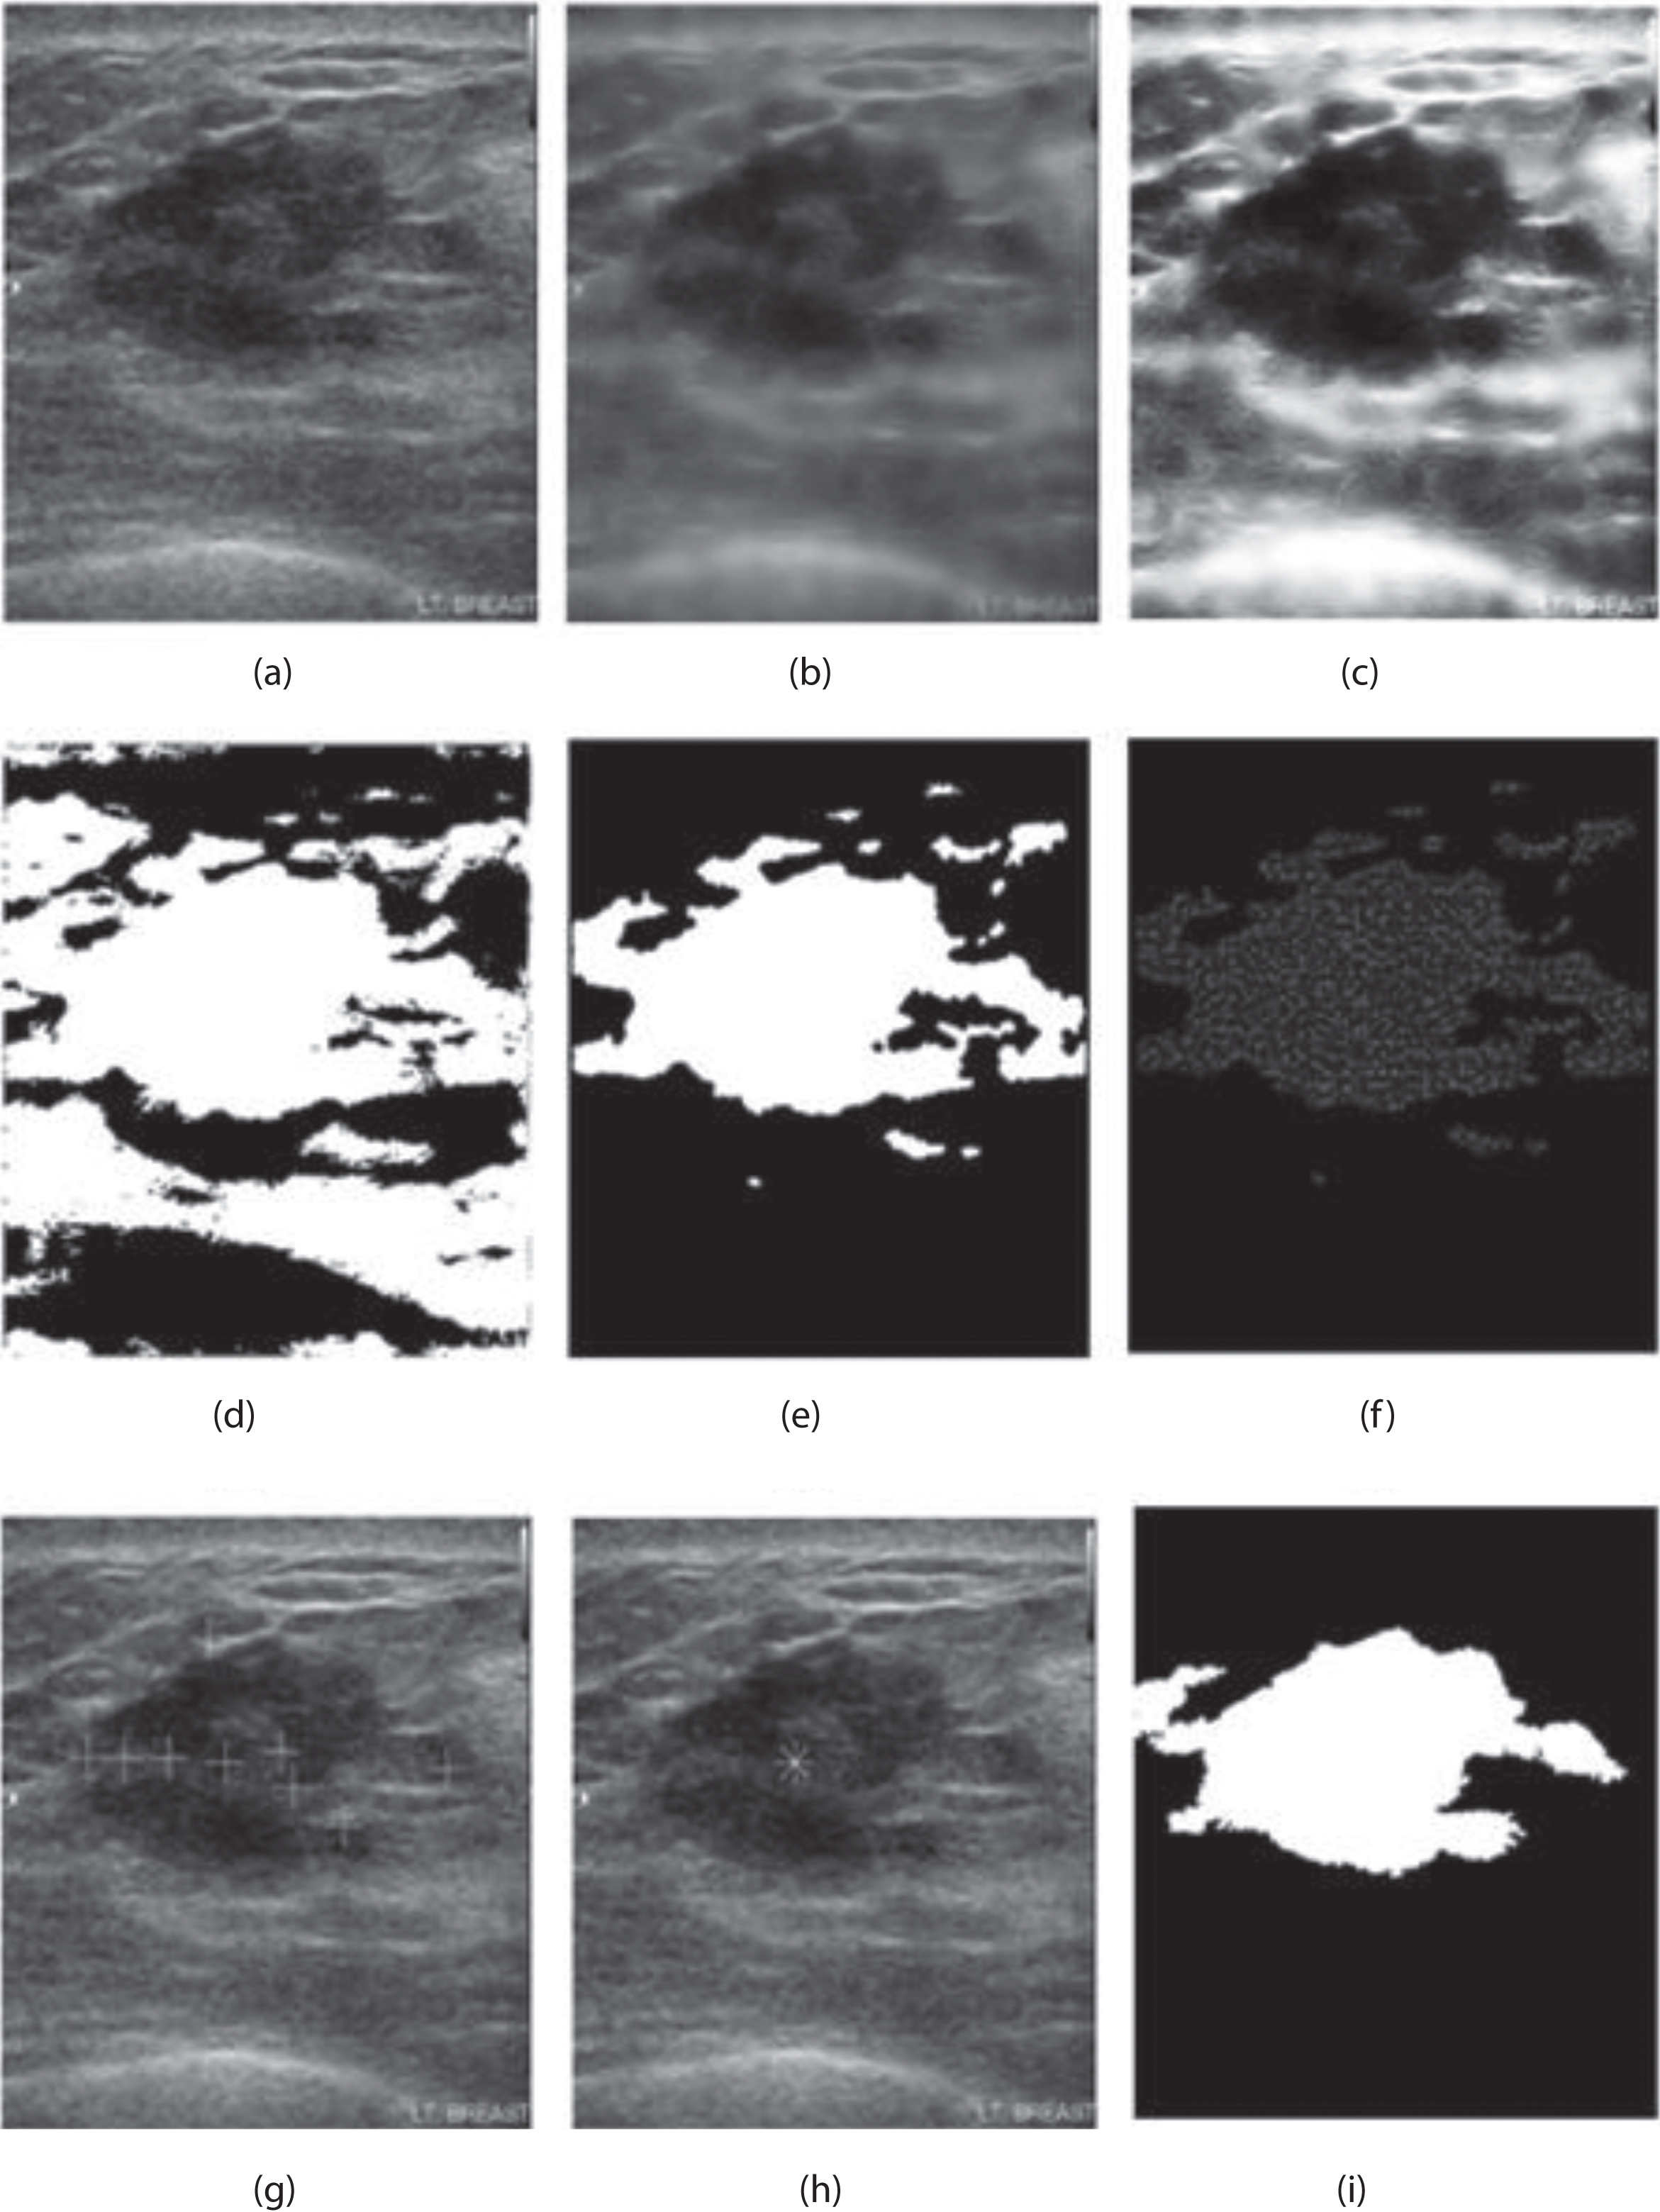
Results obtained at various stages of segmentation of a breast tumour in US image (a) Noisy US image (b) Despeckled image(c) Contrast enhanced image (d) Extracted homogeneous regions using SUSAN filter (e) Suspicious tumour regions (f) Wavelet modulus maxima points in the suspicious tumour region (g) Candidate tumour seeds (h) Final tumour seed (i) Segmented tumour region.
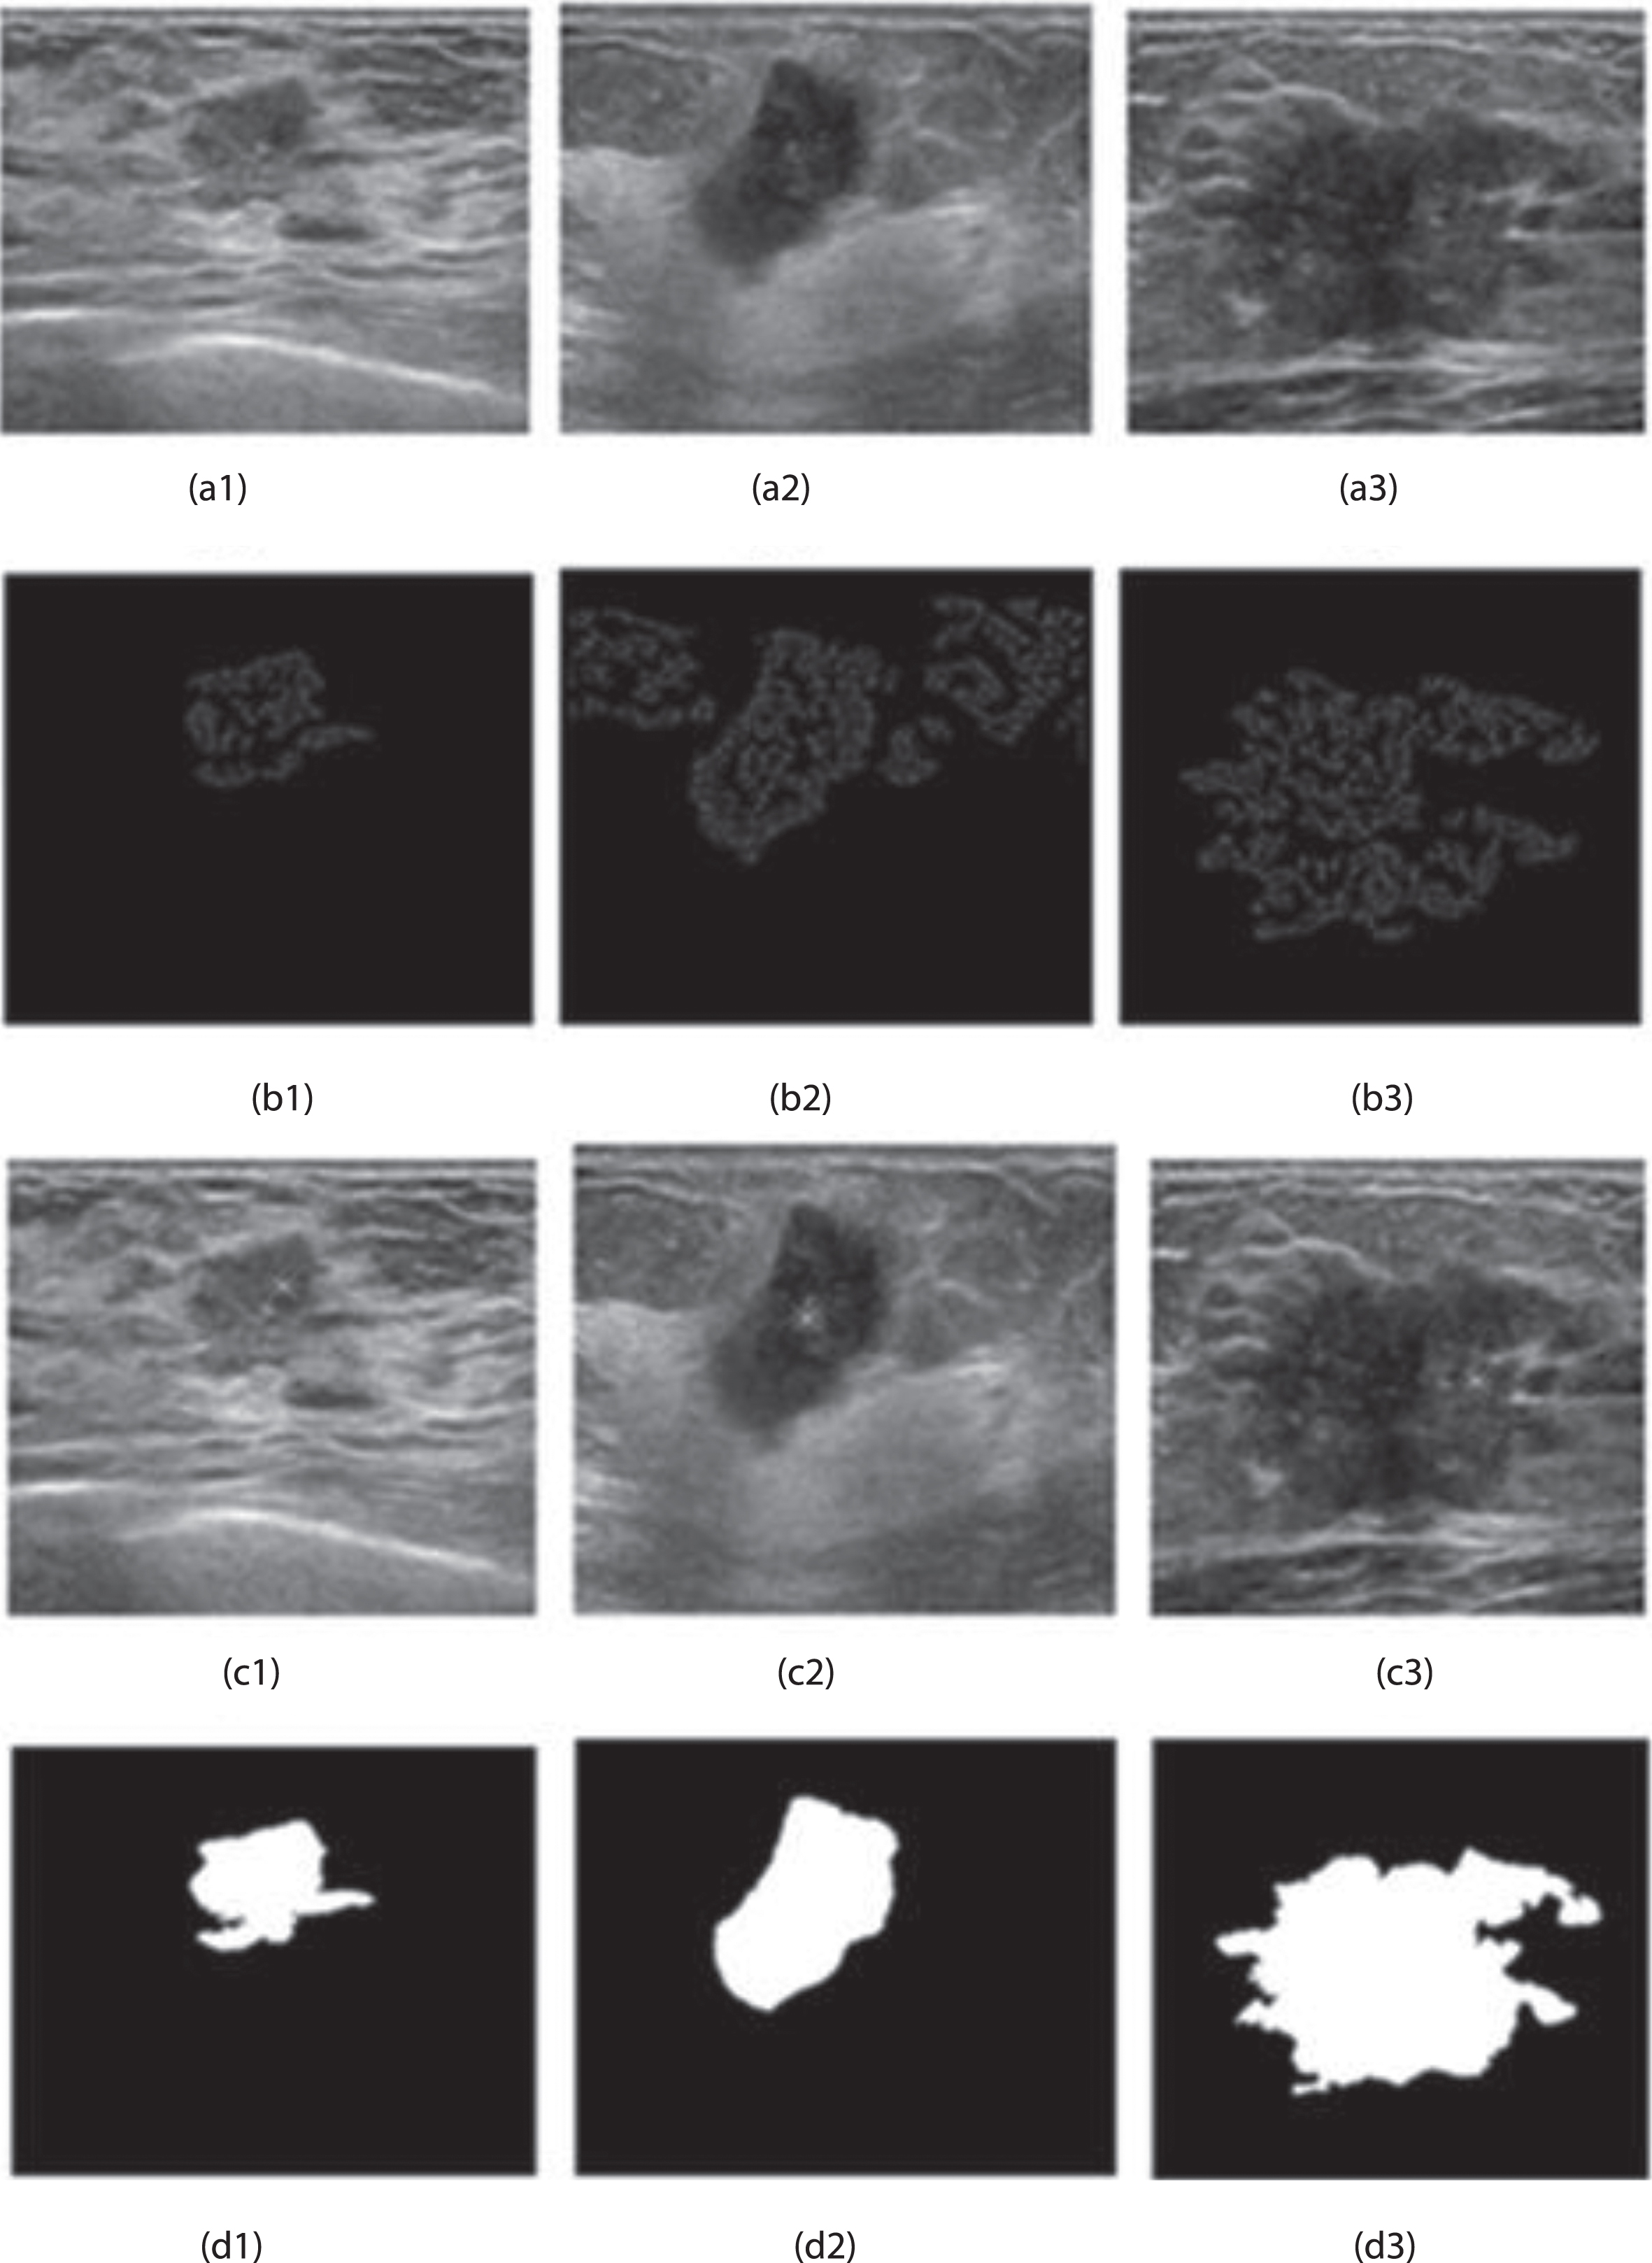
Tumour detection on different US images. (a1– a3) Input US images (b1– b3) Wavelet modulus maxima points in the suspicious tumour regions (c1– c3) Tumour seed points (d1– d3) Segmented tumour regions.
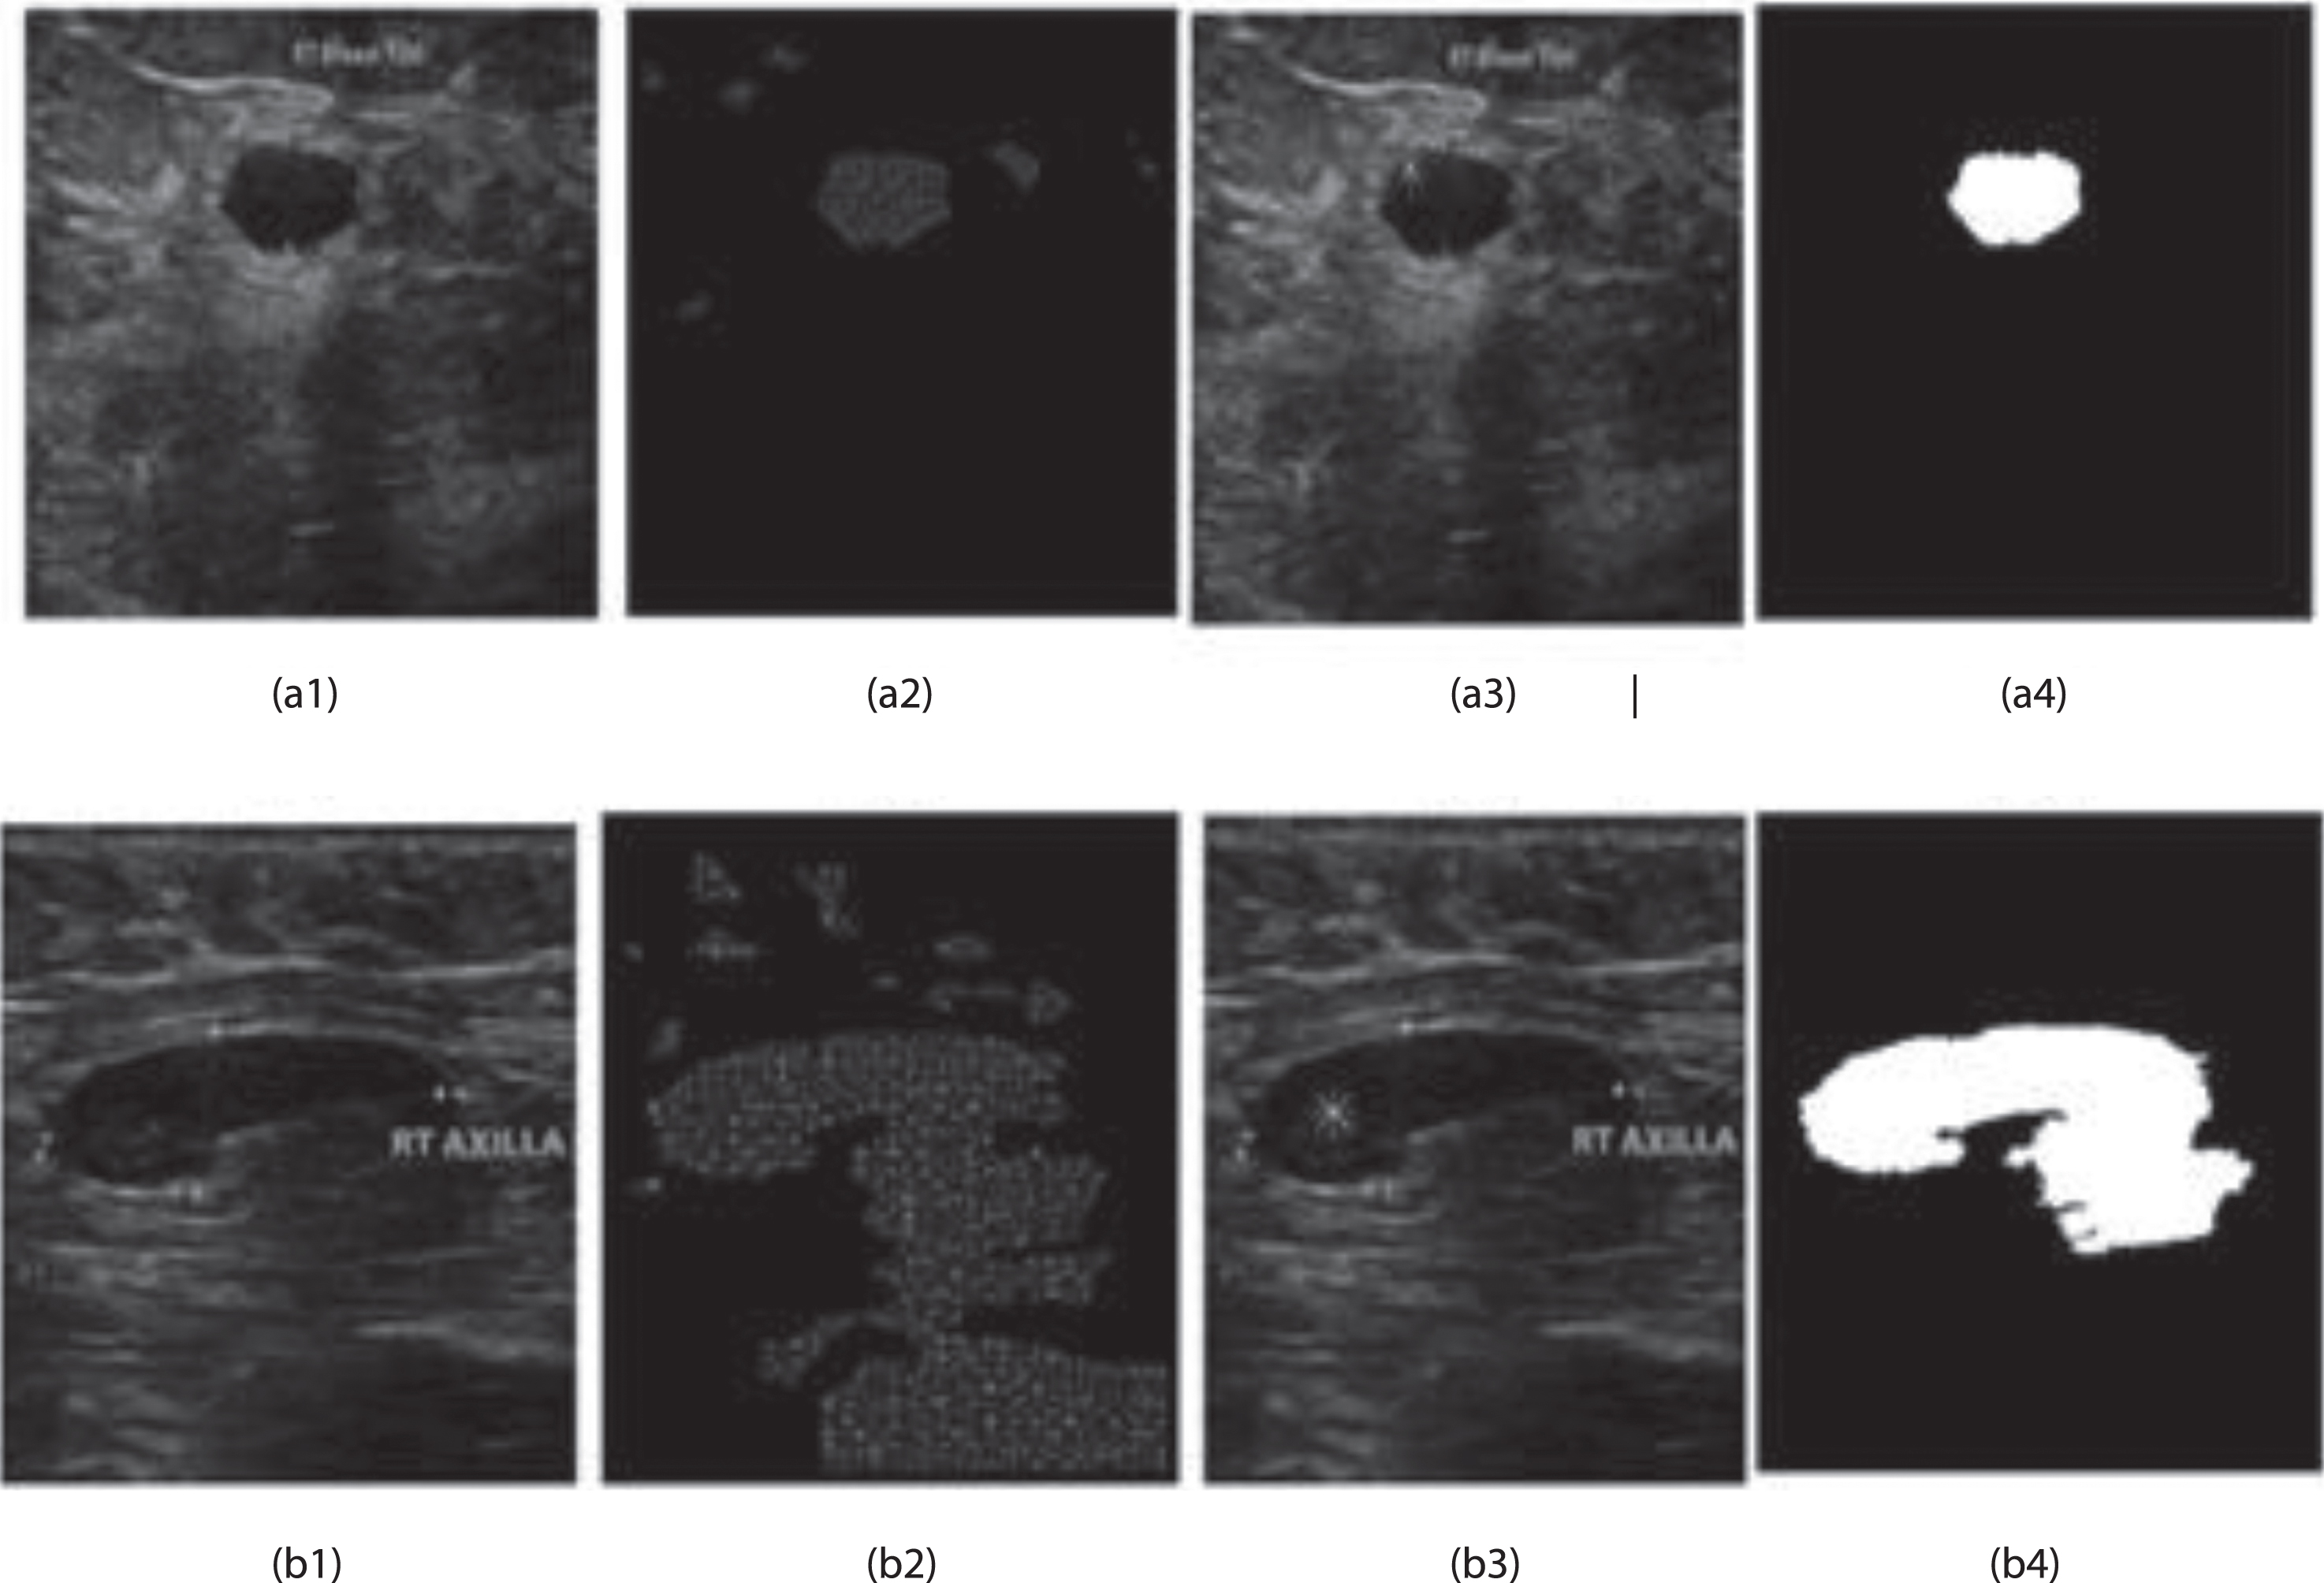
Tumour segmentation on images from lakeshore hospital: (a1, b1) input images (a2, b2) wavelet modulus maxima points (a3, a4) Tumor seed point (a4, b4) segmented tumour.
Performance of seed detection algorithm
Performance of tumor segmentation algorithm
The performance of the classifier is evaluated using the individual subset features as well as using the combinations of morphological and texture features. Using individual subsets the highest classification rate is achieved for shearlet texture features. The classification results for individual subset features are shown in Table 3. The morphological features demonstrate better performance compared to spatial texture features. Since morphological features are independent of the ultrasound machine, we combined it with texture features for the second set of evaluations. These results are tabulated in Table 4. The results demonstrate a better classification rate when oriented shearlet texture features are combined with morphological features. As the next step, using the best performing features we optimized the parameters of SVM employing Cuckoo search. Optimization of regularization and kernel parameters of SVM resulted in better classification rate in terms of accuracy, sensitivity, and specificity
Performance of individual subset features F spatial , F morphological and F shearlet in the classification of breast lesions
Combined performance of subset features in breast lesion classification
The performance of tumour classification method is compared with a method [30] which employed eight features from different shearlet sub bands to form feature vectors to train the SVM. The same procedure is implemented and evaluated on our data set and the results are tabulated in Table 5. The combination of shearlet and morphological feature set demonstrates better performance with SVM in breast tumour classification. The accuracy, sensitivity and specificity are improved further when CS optimized SVM is used for classification.
Performance evaluation and comparison of the SVM classifier for breast lesions
A novel intelligent method for automatic detection of breast tumor in ultrasound images is presented. The proposed CAD system can automatically detect the tumours in noisy and low-contrast breast ultrasound images. The algorithm, when evaluated on 170 BUS images, obtained seed selection accuracy of 98.8% and a segmentation accuracy of 90.1% with a similarity index of 0.85. The various experimental results demonstrate that CS-optimized SVM trained with morphological and shearlet texture features significantly improved the performance of the CAD system for breast cancer.