
Abstract
Over the last few years, road accidents in developing countries are increasing at an alarming rate. In India, almost 3% of GDP is getting wasted in road accidents, which not only cause social problems but, also, imposes a huge burden on the Indian economy. Various researches have been done to analyze this situation using different methods and techniques on different stretches and intersections. This paper makes one of the first attempts to develop an Accident Prediction Model (APM) in the Indian State of Haryana. This study describes the procedure for collection and analysis of accident data, as well as the detailed methodology used to develop APMs. The Models were developed using one of the most common algorithms of machine learning i.e. linear regression technique. Results obtained from APM of Haryana State were compared with the results given by some of the highly successful APMs like Smeed’s Model, Valli’s Model and their comparisons were discussed to find the most efficient model. It was observed that the proposed model shows highly accurate results in predicting road accidents in Haryana. The output of this work can be used for theoretical as well as practical applications like road safety management for improving existing conditions of the road network in Haryana and to regulate new traffic safety policies in the future.
Introduction
Accident Prediction Models (APMs) are very powerful tools that are being used widely for determining the factors associated with road accidents, and their patterns over a period of time [1]. As the prediction of a road accident is a complex phenomenon, it gives serious challenges to the road safety management team, planners and engineers as well. The present investigation was carried out in Haryana, a Northern state of India, lying on the fringe of the national capital area, New Delhi. Over the recent two decades, (1991–2011), the street crashes in Haryana have expanded six times, while the fatalities in the street have increased 11 times [2]. Although, the geographical area of Haryana is 1.34% of India and the population of the state is 2.2% of the country, but the contribution of the state in fatalities and road accidents is 3.5% and 2.2% respectively making the state in top 13 unsafe state of India (MORTH, 2016). Fig. 1 shows that the values for all Road-Safety-Indicators in the state are more terrible than the national average. Fig. 1 also shows the value of Accident Severity Index (ASI) for the country. ASI is defined as the Index which defines the seriousness of the accident. Higher the value of ASI, more dangerous the accident is. Due to the heterogeneity nature of traffic in Haryana, the scenario of road accident prediction has grown more complex.
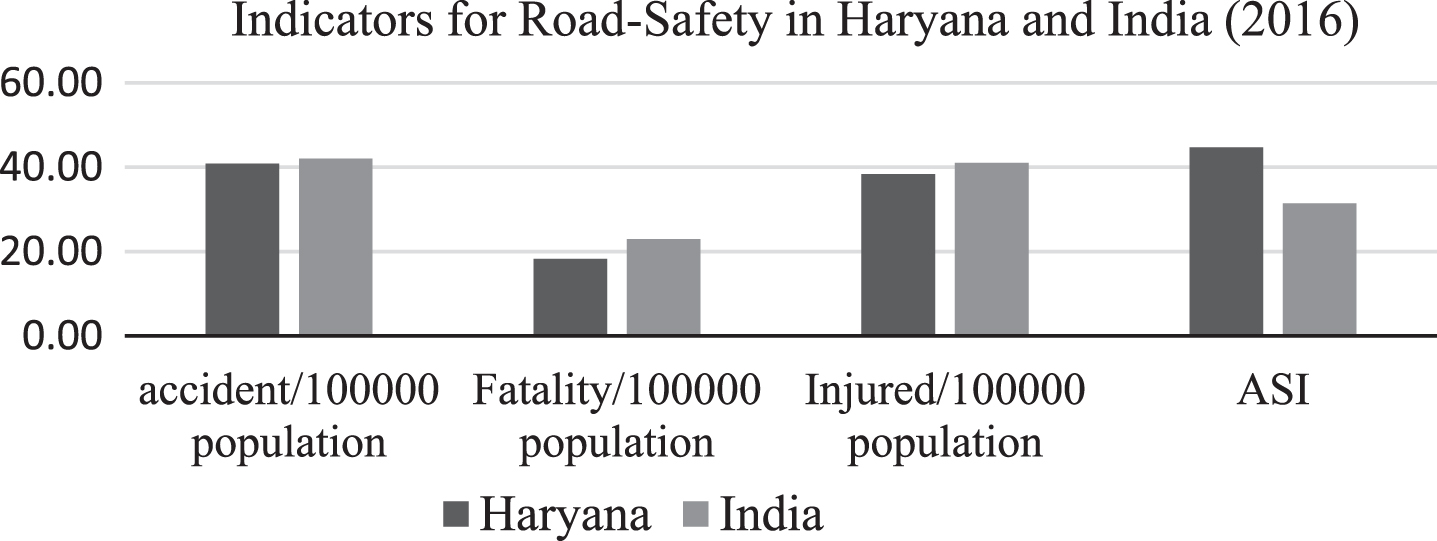
Road safety indicators in Haryana 2016.
Haryana has been experiencing a very fast and unprecedented growth of the road network and the vehicles [3]. In the last five years, the growth rate of registered motor vehicles in Haryana has been above 10%. For meeting this demand, constant up-gradation, construction, and widening of the existing road are being done but still after all these efforts, traffic accidents are not decreasing. As per the long profile of accidents in Haryana, during the period 1996–2016, there was a total 190403 Road Traffic Accident (RTA) in Haryana, out of which 76044 people died in road crashes [4]. The analysis also shows that out of these deaths, 29.6% were female and 70.4% male. During this period motor vehicle occupants i.e. passengers, motorcyclists and drivers accounted for an average of 83% while the contribution of cyclists and pedestrians accounted for 17%. Since the usage of the bicycle is not so common in Haryana, the rate of pedestrians and cyclists fatalities declined from 27% in 1999 to 18% in 2016.
Although, there is no such definite pattern of accidents in Haryana, but overall, it can be seen that an average number of fatalities, accidents, and injuries in the state are 4235, 10299 and 9474 respectively. This is in spite of the fact that Haryana is the primary Indian state to present “Vision Zero” activity on road safety in 2016, an idea adopted by just a couple of developed nations to reduce fatalities on street but still the issue is yet to be resolved.
The world is moving towards the latest and upgraded technology nowadays. With increasing number of road accidents, there is an urgent need to study the factors responsible for this issue and in order to analyze such huge data we definitely need some latest and accurate technique. Machine learning is one of the latest methods for prediction of any kind of data. In brief, its application in civil engineering includes approaches related to hydraulic problems, stability of structure, prediction of strength of concrete, analysis for different kind of loads, determination of energy consumption and carbon emission, design of structures, for construction management and for prediction of road accidents for sustainable road infrastructure. In this study, we primarily focused on application of machine learning techniques for prediction of road accidents using linear regression technique. for this kind of analysis One of the latest computer science technique which is being used by different agencies for advanced and précised results regarding prediction
Linear regression technique
Linear regression is possibly one of the most well-known and well-understood algorithms in machine learning and statistics. This technique is being widely used to develop a relationship between the dependent variable and the independent variables. Some of the basic requirements of a good linear regression model in machine learning are: The dependent variable should have a high correlation coefficient (preferably >0.5) with the independent variable and the independent variables should have low correlation with each other. The goodness of fit, i.e. R2 value should be preferably greater than 0.7. The standard error of estimates should be minimum. The signs of the coefficients should be logical.
In the present study, we used this concept of machine learning for the estimation of road accidents in the state of Haryana.
Objectives of the present study
To identify the factors responsible for the occurrence of accidents in the state of Haryana. To propose an efficient and safe transportation model for reducing the number of road accidents in the state of Haryana. To validate the proposed model. To compare the proposed model with some of the most successful models to find the best one.
Literature review
“The first successful APM was given by Smeed in 1949 for predicting road accidents in 20 developing countries including India. The equation was used for many years by many countries and the same is given in Equation (1) (Table 1)”.
Smeed’s, Andreasen, and Valli’s equation for prediction of road accidents
Smeed’s, Andreasen, and Valli’s equation for prediction of road accidents
In 1991, Andreasen introduced one more independent variable i.e. road length and modified Smeed’s model for the same purpose and the equations given by him are presented in Equations (2–4).
In 1991, “P. Valli further studied various responsible factors for road accidents in 23 large metropolitan cities of India. The author concluded that there is no single model that could predict road accidents in all areas as parameters like population, road length, vehicle density varies from place to place”. The equations given by the author are presented in Equations (5–7).
William et al. (2011) found that traffic flow, length of the segment, junction density, and type of terrain are the significant factors responsible for the occurrence of accidents for two-lane highways in Ashanti region.
S. Jaglan et al. [5] identified the factors responsible for the occurrence of accidents on selected highways of Haryana. The authors found that vulnerable users are more affected in the state and detailed study is required to explore the reason behind the accidents.
Singh et al. (2016) [6] carried out a study to predict road accidents on non-urban sections of Haryana using the M5 regression tree and negative binomial technique. The authors found that minor access to the highways need to be properly designed and service road needs to be made functional.
Singh et al. (2015) studied to identify the factors responsible for accidents on NH-1, SH-11, and SH-20 of Haryana using accidental and traffic volume data. The authors concluded that cars and trucks are the main factors responsible for accidents on the selected stretch and vulnerable users are highly affected in this zone [8].
Mor and Sood (2017) studied to find the correlation between accidents and traffic volume on NH-1 of Haryana and the main conclusion given by the authors was that there is a significant relationship between the two variables.
However, there is no study on predicting road accidents for the state of Haryana. The primary objective of the research is to develop an APM to identify the factors that are likely to affect injuries in the state of Haryana. Furthermore, the models were to be used to identify those significant variables which are affecting the safety of users, i.e. land use, geometry, registered vehicles, etc.
Normally, the criteria for choosing dependent and independent variables are the accessibility and availability of data and those variables which were found significant in the literature (past-studies) [8]. For the present study, population and registered motor vehicles are chosen based on literature as these two variables are found to be significant by most of the researchers [9]. A highly significant APM was introduced by Pramada et al. by adding road length as an additional parameter. Road length has been considered by a lot of researchers thereafter [7, 11] and other parameters are taken as per time availability for collecting data. Based on the previous research five variables were taken as independent variables, whereas, accident frequency in terms of accident/year was taken as a dependent variable.
Dataset
Accidental data covering a period of 21 years (1996–2016 inclusive) for the selected State was obtained from police, traffic department and National Crime Record Beruae (NCRB). Data contained information like the number of people killed, injured and the total number of accidents. Inescapably, the database is liable to some gauge of under-reporting, in any case, since no broad investigations have been completed to evaluate the scale, it will be hard to represent it in any deliberate way in the present examination. Other data included was GDP at current and constant prices (in crores) from the statistical department, road length (in km) from PWD department, population (in thousand), registered vehicles (in thousand) from transport department and employed people(in thousand) from employment exchange department of Haryana. All the data was compiled in Ms-Excel 2013 for further analysis.
Methodology of the research work
For research to be carried out, the available relevant literature was studied to find out the factors responsible for the causation of accidents. After that, data was collected from different departments of Haryana and were compiled in MS-Excel for selecting significant variables, scatters plots were plotted between variables and the number of crashes and values of R2 was calculated. Significant variables with higher R2 values are selected for development of the model. The equations are developed in SPSS software using linear regression algorithm of Machine Learning. A detailed methodology adopted to carry out the research is shown in Fig. 2.
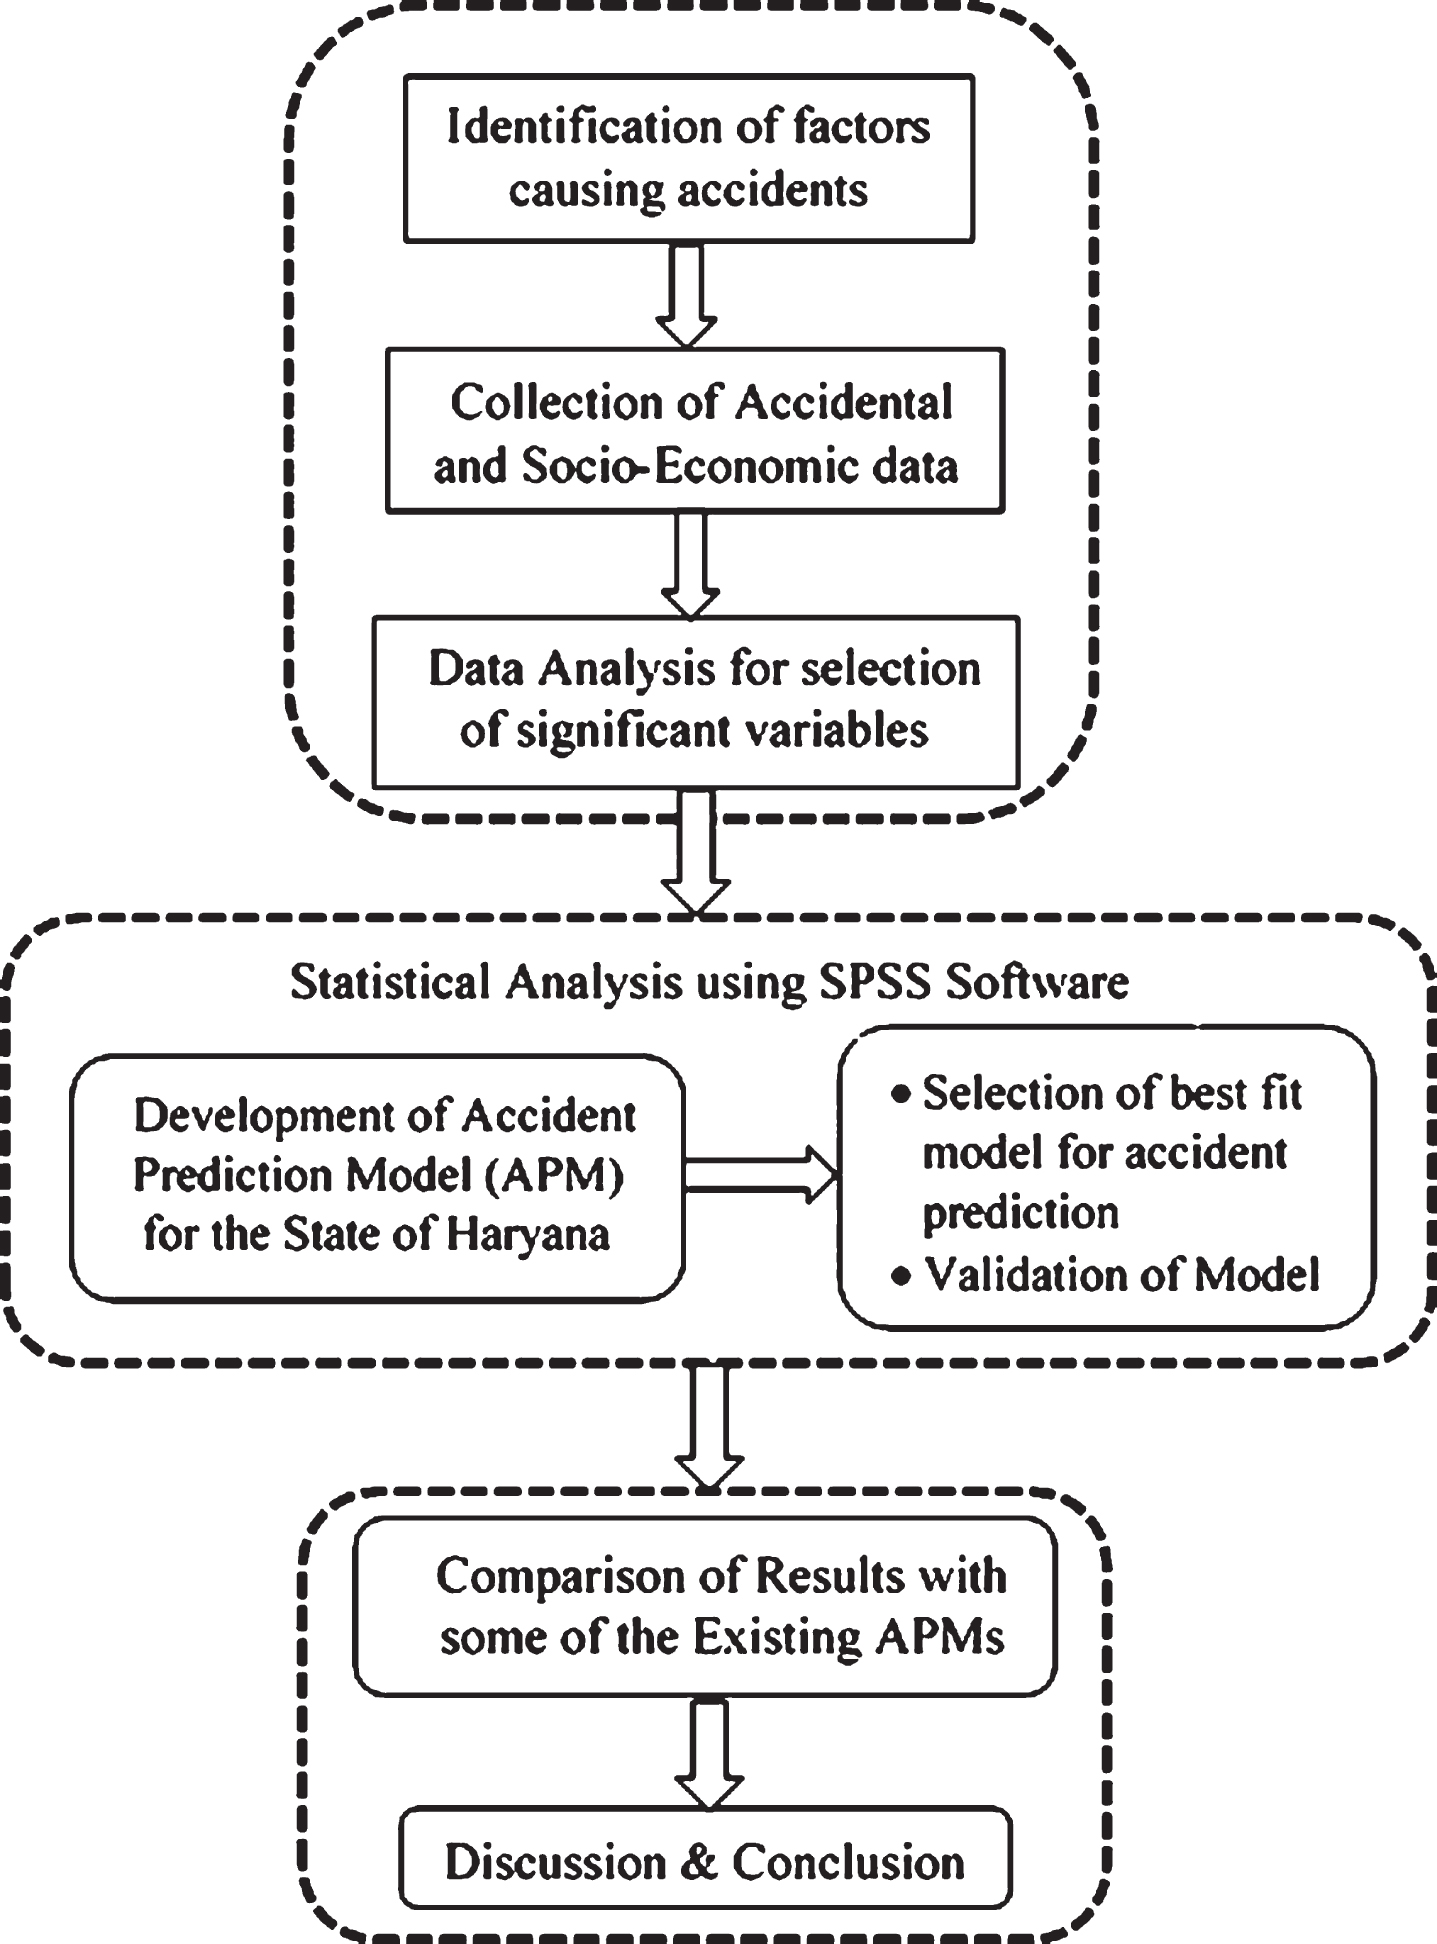
Methodology of the proposed work.
For the development of model, we used a linear regression algorithm of machine learning for predicting accidents, fatalities, and injuries in the state, the data have been split into two parts: training and testing. Training is the part used for the development of the model while the testing part is used to check the predictive power of the model. The data for the year 1996–2015 has been taken for the training of model and the data for the year 2015–2017 have been taken to test the model power. Based on the priority of factors which is depending on the value of R2, one by one, factor has been added in the Statistical Package for the Social Sciences (SPSS) software using linear regression for developing the equation. The value of R2 shows how many percentages of cases are explained by the given data. Significant variables with higher R2 values are selected for development of the model. In the output of the model, if the significance value of each factor is less than 0.05(at 95% confidence level) then the factor is incorporated into the model and if the significance value is greater than 0.05 then the factor was excluded as that factor is not suitable for developing the model. Based on the different number of trials, the equation for predicting the road accident in Haryana is given by Equation 1, Equation 2, and Equation 3.
For the present study, total accident, fatal accidents and injured person are taken as the dependent variable and other parameters like GDP, population, road length, etc. are taken as independent variables. The method of minimum squares and maximum likelihood are used to estimate the variable coefficients. T-test is used to check the distribution of variables (should be normally distributed). Variance-Inflation-Factors (VIF) (Tables 2, 3, 4 column: 10) is used to explain the amount of multi-collinearity (correlation between predictors) present in the regression analysis. While Tolerance factor (Tables 2, 3, 4: column: 9) is checked to measure the effect of one independent variable on all other independent variables. All of the above tests are used to check the significance of the incorporated variables. A detailed value of the significant variables and their coefficients using SPSS software are given in Table 2, Tables 3, and 4.
Significant Coefficients and their values for the Accident Prediction model
Significant Coefficients and their values for the Accident Prediction model
Significant Coefficients and their values for the Fatality Prediction model
Significant Coefficients and their values for Injury Prediction model
Tables 2, 3, and 4 show the effect of each predictor (independent variable) with their weight on the dependent variable (accident). All these variables are significant at the 0.05 confidence level. The common significant variables primarily responsible for the occurrence of an accident in the state are Road length per 1000 registered vehicles, Road length per 1000 population, and registered vehicles per 1000 population. The rest of the significant variable for model 1 is GDP per 1000 population, model 2 is employed persons per 1000 population and model 3 is GDP per 1000 population and employed persons per 1000 population.
Using all these variables and their coefficients, three models were developed using SPSS software for accident prediction in the state and the same are given in Equation 8, Equation 9, and Equation 10.
Where, A/R = Accidents/1000 registered vehicles, F/R = Fatalities/1000 registered vehicles, I/R = Injuries/1000 registered vehicles, L/R = road length/ 1000 motor vehicle, L/P = Road length/ 1000 population, E = number of employed people, R/P = registered vehicle/ 1000 population, G/P = GDP/ 1000 population, E/P = employed person/ 1000 population.
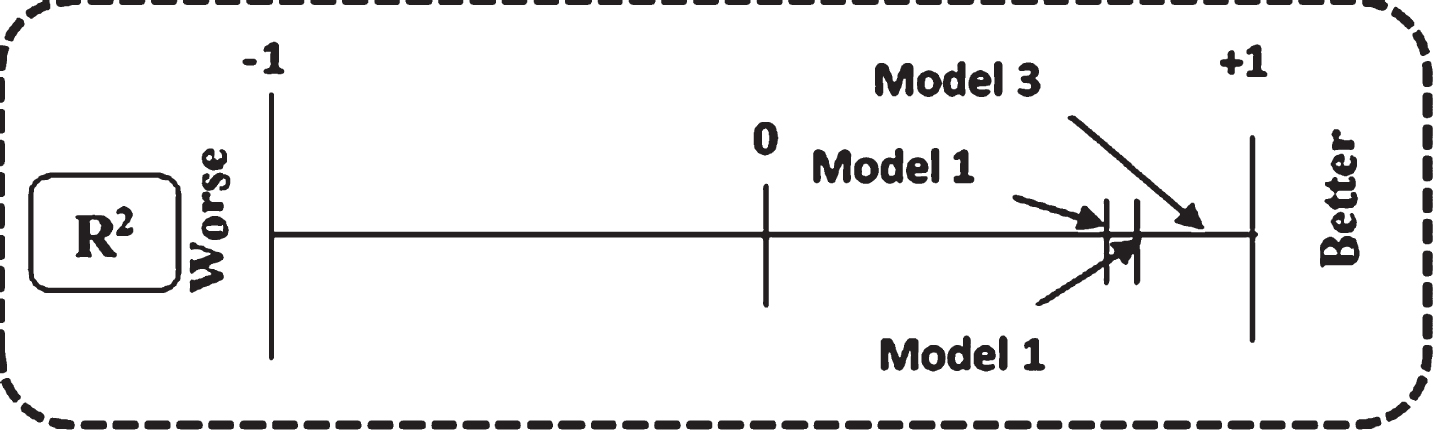
Usually, goodness-of-fit of any model is measured by the coefficient of determination (R2) i.e. explained variation/total variation. Based on Table 5 and Fig. 3, it can be explained that the coefficient of determination, is 0.945, 0.854 and 0.988 for Model 1 (Accident Prediction), Model 2 (Fatalities prediction), and Model 3(Injuries prediction) respectively. Higher the value of R2, the higher will be the predictive power of the model. This shows that the accident can be predicted accurately using 94.5% (for model 1), 85.4% (for model 2), and 98.8% (for model 3) of the independent variables incorporated in the model and the remaining 5.5%, 14.6% and 1.2% is explained by those variables which are not incorporated in the model. Adjusted R2 needs to be check when we have a large number of independent variables. The difference between R2 and adjusted R2 should be minimum. As the difference between R2 and adjusted R2 is very small, it shows that the variables selected for the development of the model are important and significant enough to explain the causes of accidents.
Model Summary
Model Summary
Model summary.
Generally, we find the relationship between the dependent and independent variables but there is a need to check the relationship among independent variables also i.e. how independent variables are affecting each other. In order to check that the Pearson correlation matrix is presented in Table 6. Pearson-correlation coefficient (r) (Table 8, row 2) measures the strength of the relationship between two variables. It varies from -1 to 1. If the value of r is -1, it shows a perfect negative linear relationship between variables, if the value of r is 0, it indicates no linear association between variables, and an r with value 1 indicates a perfect positive linear relationship between variables. Higher the value of Pearson correlation, the higher the dependency of variables. For example, from Table 6, a high relationship can be seen between accident/1000 RV and Registered Vehicle/1000 population and road length/1000 registered vehicles. Parameters with a higher value were considered for the development of the model. N = 21 represents that there were total 21 entries for each parameter in the dataset. For the given dataset, due to the strong correlation among variables, it was expected to estimate the true significant variables.
Pearson-Correlation matrix for the variables in SPSS
Pearson-Correlation matrix for the variables in SPSS
*Here, A = total accidents, FA = Fatal accidents, IP = injured person, RV = Registered vehicles, RL = registered vehicles, P = population, N = values for each parameter, and EP = employed person in Haryana.
Model 1, Model 2 and Model 3 are expected to give almost actual results in order to have maximum efficiency. To adopt the accurate and best model, actual values of accidents/1000 registered vehicles are compared to the predicted values using Smeed equation, Andreessen equation, Valli equation (Equation 1–7) and the proposed model (Equation 8–10) and their difference are noted in Table 7, Table 8, and Table 9. The results show that the predicted accidents by the proposed model are almost near to the actual values of accidents in the state. Hence, the model can be considered in accordance with the existing conditions to predict the actual number of accidents.
Actual and Predicted values of accidents using different models
Actual and Predicted values of accidents using different models
Actual and Predicted values of fatalities using different models
Actual and Predicted values of fatalities using different models
Fig. 4 clearly indicates that Smeed, Valli, and Andreessen equations are not applicable for predicting road accident scenario in the State of Haryana while the proposed model is highly suitable and accurate in predicting accident scenario for the selected State. As the predicted values of the proposed model are following the trend line, it indicates that our predicted values of accidents are approximately near to the actual values of accidents in the State of Haryana.
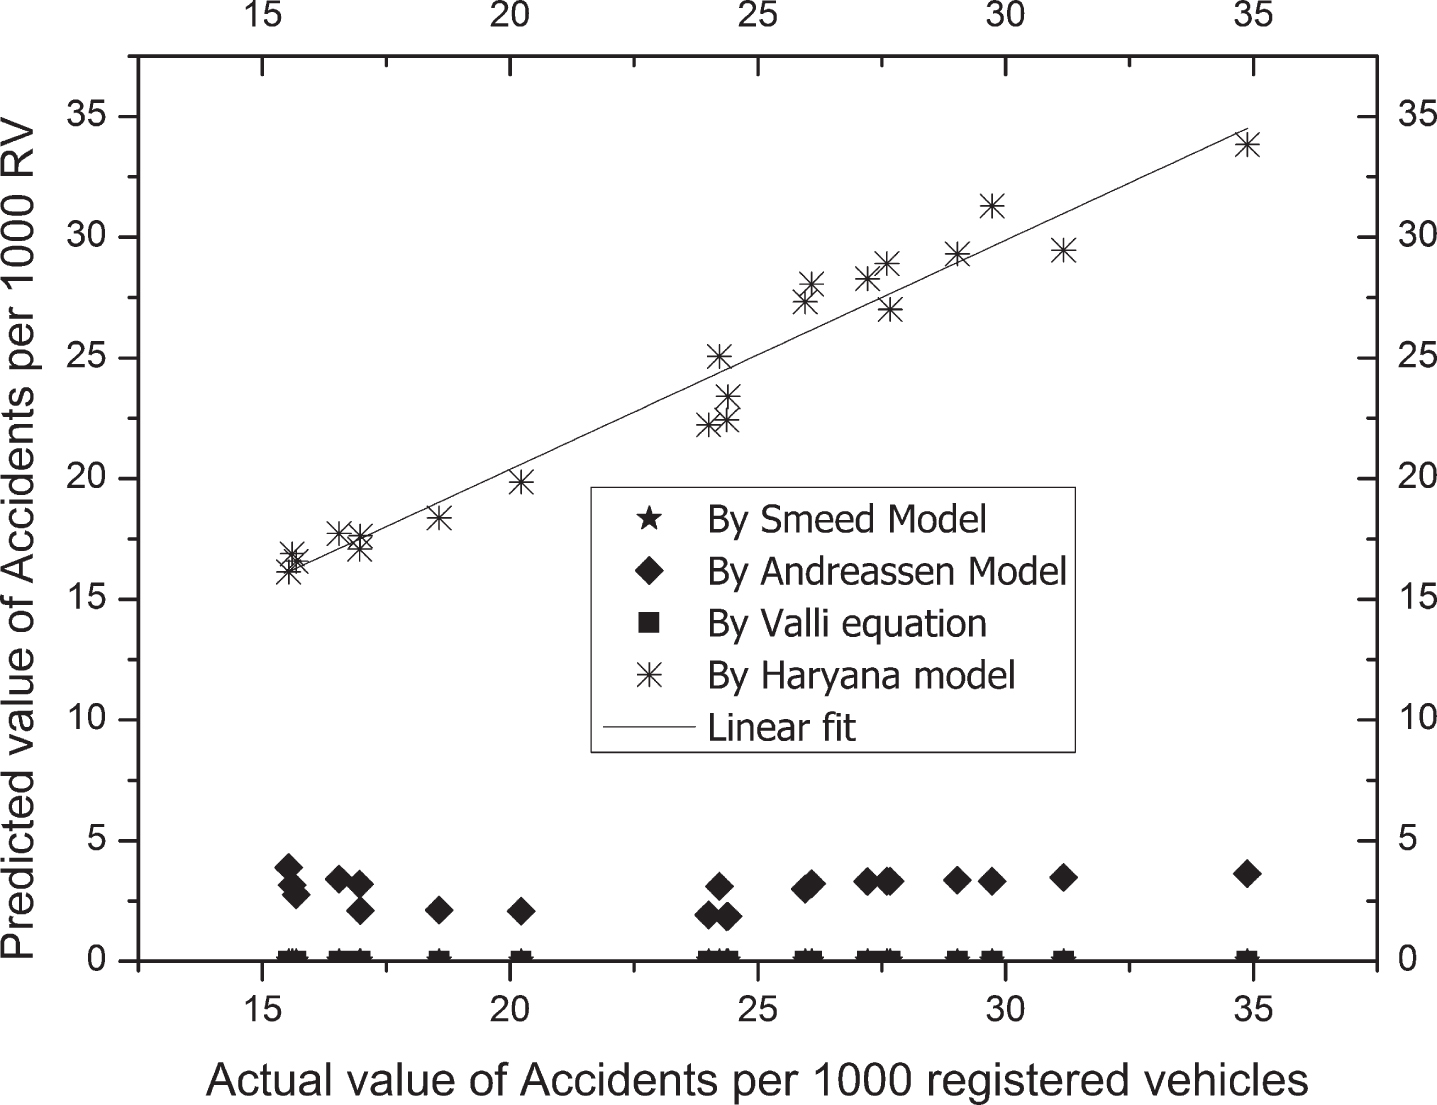
Actual and predicted values of Accidents using different models.
Fig. 5 indicates that the equation given by Andressen is comparatively better than the Smeed and Valli equation for predicting fatalities in Haryana, but, in this case, also, the proposed model shows high accuracy among all four models.
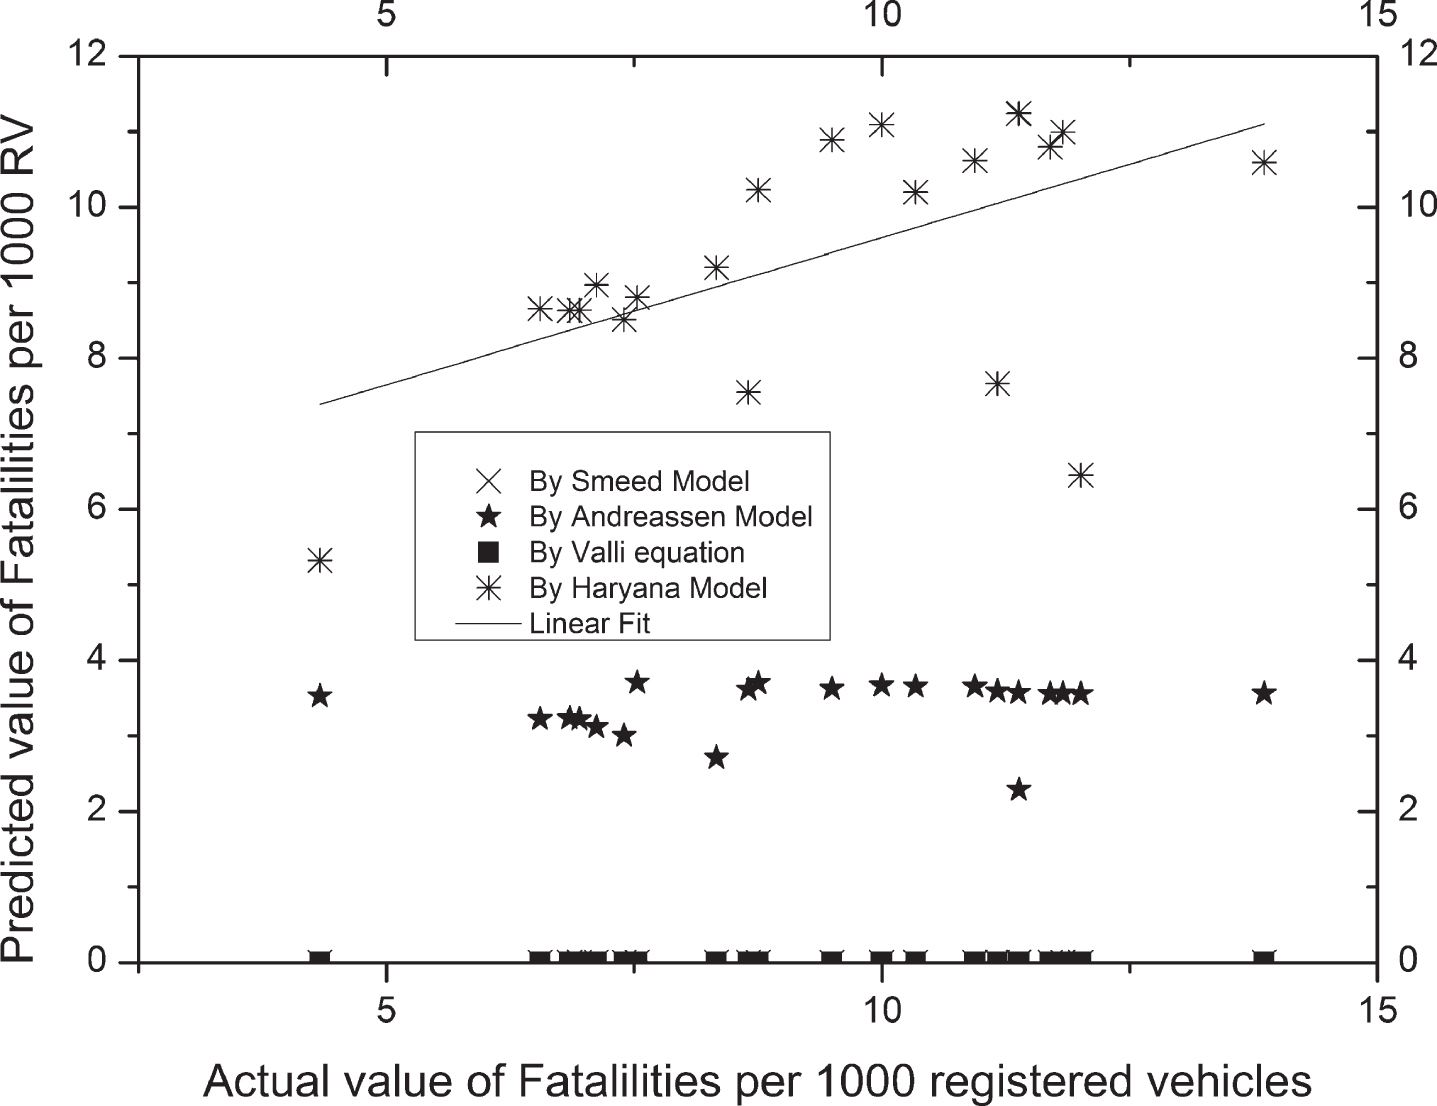
Actual and Predicted values of Fatalities using different models.
Fig. 6 indicates that all three models other than the proposed model are not applicable in predicting injuries in Haryana. While the prediction of injuries by the proposed model is almost equal to the actual scenario of the state. In addition to this, the predicted values, in this case, follow the trend line most accurately among all three cases.

Comparison of Actual and predicted values of Injuries using different models.
In order to assist a sustainable safe transport system, we need a more practical, planning-level-approach to road safety. The primary objective of this study was to provide a proactive, feasible, detailed-planning-level tool that can help in reduction in accidents and better safety of the road users, complementing the traditional road safety methods. The kind of model is the first successful model that we have given for the state of Haryana. After analysis, the results show that it is possible to develop a relationship between characteristics pertaining to accidents and the crashes on a macro level using machine learning techniques.
The study confirmed the status of RTAs as a major and increasing cause of social, health and economic problems in Haryana. From the data analysis and observation of road accidents in the state of Haryana, several conclusions can be made:
1. The models for predicting road accidents in the state are formulated as:
2. Smeed model, Andreessen equation and Valli equation show poor results in predicting road accidents in Haryana hence, these equations cannot be used to predict road accidents scenario in the state while the proposed model shows highly accurate results. So, the proposed model can be used for theoretical as well as practical applications like road safety management for Haryana state as well as for any state with similar accidental and socio-economic conditions.
3. The main factors responsible for the occurrence of accidents in the state are population, road length and registered vehicles but employment and GDP are also contributing significantly. The reason behind this may be due to the high purchasing capability of vehicles by the people as GDP and employment rate of Haryana is very high.
4. Accidents can be reduced by imposing strict traffic rules and there is a need to introduce some new policies regarding encouragement for the use of public transport vehicles and simultaneously to reduce the growth of personalized vehicles.
5. Apart from the engineering efforts, it is also a public duty to promote and contribute to safe road transportation system by educating other people regarding road safety in terms of use of seat belts, helmets, following traffic rules.
6. The use of computer science techniques like machine learning for prediction of road accidents is found to be most effective and highly accurate, hence, these techniques can be used in the planning phase for improving road safety.