
Abstract
In the analysis of the dimension of economic development, the clustering method has a strong dependence on the selection of the central point. However, the random selection of the central point by the traditional K-means clustering method involves the most sensitive central point selection problem of the clustering method. In order to improve the economic development dimension analysis, this paper improves the initial center selection method based on the traditional K-means clustering method, so that the traditional K-means clustering method is no longer a random selection of initial center, and the problem of local optimal solution is also solved. At the same time, the system operation reduces the number of clustering and iterations and improves the efficiency of the algorithm. In addition, this article uses an example to perform algorithm performance analysis. The results show that the proposed algorithm has certain effects and can provide theoretical reference for subsequent related research.
Keywords
Introduction
In recent years, China’s financial system has developed rapidly, and agglomeration has gradually become an important organizational form of the financial industry. Financial gatherings enable economies of scale to achieve economies of scale in information dissemination, business cooperation, and shared infrastructure. This kind of economies of scale will speed up the dissemination of information between enterprises and intensify competition among enterprises. Moreover, the motives of enterprise innovation will be continuously strengthened in this fierce competition, and the speed of application of enterprise innovation results will continue to accelerate [1]. Through the convenience of collecting information provided by financial agglomeration, financial institutions can give innovative activities sufficient funds to improve their innovation ability by identifying entrepreneurs or enterprises that are most likely to succeed in developing new products and developing new technologies, which promotes economic growth while reducing risks. However, this kind of economic growth is inevitably accompanied by the problem of uneven regional economic development.
Regarding the study of economic imbalances, it is generally believed that the problem of unequal opportunities brought by regional imbalances will have many adverse effects on the healthy and stable development of the national economy. As a premise to solve the imbalance of regional economic development, it is first necessary to classify each region according to economic conditions [2]. Considering that the level of economic development in each region is not maintained in a certain constant state and the economic development level in different regions or even different regions in the same region will vary, it is obviously not scientific to evaluate the level of economic development over a period of time based on only one clustering result. How to obtain the clustering changes of the regional economic development level in a certain period of time and how to predict the clustering results in the future period is the problem studied in this paper.
Related work
The most direct and fundamental theoretical basis for the coordinated development of regional economy is the synergistic theory first proposed and systematically discussed by Beugelsdijk S [3] in the 1970s. Synergetics is an interdisciplinary study that studies the synergy between the internal subsystems of an open system to form an ordered structure mechanism and law. Foreign scholars have adopted a variety of methods for conducting research on regional cooperation. For example, Bürcher [4] studied the trade effects of the four organizations (EU, NAFTA, MERCOSUR and ASEAN Free Trade Area) between member states and non-member countries. The fixed effect model and panel cointegration analysis of the gravitational model show that the trade creation effect of the guilds of EU member states is almost six times that of the countries outside the guild,and the exports of non-members of the NAFTA are very fragmented, but the MERCOSUR agreement does not have a significant effect on member countries’ trade, and the North American Free Trade Agreement relies heavily on non-members’ imports. Joan R [5] used the super-logarithmic equation of gross national product to study the structural changes of endogenous decisions and found that Canada had a long transitional period before the implementation of the US-Canada trade agreement. This result raises questions about the effects of the North American Free Trade Agreement. At the same time, the United States has undergone structural changes in the year following the North American Free Trade Agreement. The author believes that this has changed the perception that smaller economies will benefit from larger economies, and in fact smaller economies face more complex adjustment processes. Wu M [6] studied the spatial structure and spatial spillover effects of China’s provincial economic growth from 1998 to 2008 and used the Moran index to measure the spatial autocorrelation of Chinese provinces. Moreover, they established a new economic geography model and researched that market potential has a major impact on economic growth. Finally, they conclude that for every 10% increase in market potential, the regional GDP will rise by 3.5%. Xu Y [7] used the urban and rural communities of Australia as an example to construct a social capital dynamics model of community interaction. The results show that the interaction between rural communities and urban areas can upset the original provisions for resolving local conflicts, which can explain many unsatisfactory realities in rural and urban dual societies.
Foreign studies on regional synergies involve synergistic mechanisms, synergies between subsystems within the region, and measurement of regional synergies. For example, None [8] studied the synergy mechanism of the BRIC countries: the four-nation summit, ministerial dialogue, unofficial cooperation platform, practical work areas and specific cooperation, and adopting the method of “enriching bilateral relations by using versatile relationships”. Although these mechanisms lack formal statutes and basic objectives, and the development direction, methods of operation and standards bodies are still unclear, the BRIC countries will undoubtedly form an institutionalized cooperation mechanism in the future, which will further promote the development of the four countries and the global economy. Rabe N S et al. [9] used the vector error correction model and JJ cointegration test to study the dynamic synergy between the agricultural sector and economic growth in Malaysia from 1970 to 2010. The study found that there is no causal relationship between agricultural output and economic growth in the short term, but there is a two-way causal relationship between the two in the long run. Kuko M H et al. [10] used entropy statistics to study the regional innovation system in Hungary and measured the synergy of the system from three aspects: knowledge exploration, utilization and organizational control. The study believes that at the national level, the government has not played a role in promoting synergy. Nizhegorodtsev R M [11] analyzed the synergistic effects of the interaction information of Swedish companies in the three dimensions of geography, technology and organization distribution from the national and regional levels. The study found that 48.5% of regional synergies are provided by the three metropolitan areas of Stockholm, Gothenburg and Malmö, and Sweden can be considered a centralized hierarchical organization system. Li C et al. [12] designed indicators to measure the degree of economic synergy in East Asian countries, and these indicators cover trade, investment, financial assets and civil exchanges. The study found that in recent years, with the advancement of time, various Asian groups, especially 16 Asian countries that are integrated, trade dependence, direct investment, capital flows and other forms of social and economic exchanges are constantly aligning with the EU level. However, official cooperation in Asia is still insufficient, and formal regional institutions are relatively underdeveloped. In order to further analyze the reasons for this difference, the article conducts an empirical analysis. It is found that Asian countries are at a relatively low level in political and cultural proximity, and the diversity of political interests and cultural values may hinder the further coordinated development of Asian countries. However, if the regional economic and social links are further strengthened, the requirements for joint decision-making will be expanded, and the possibility of official cooperation will be further enhanced.
K-means clustering method based on uniform initialization method
The method of randomly selecting the center point will lead to the local optimization of the final clustering result, and the different ways of randomly selecting the initial value will also result in different results for each analysis [13]. The traditional K-means clustering method needs to go through numerous iterations and update the cluster center after randomly selecting the center point to finally reach the principle of the smallest distance within the cluster. This algorithm is quite cumbersome and time consuming, so this paper improves the traditional K-means clustering method. The improved clustering method is mainly from the initial center, and the center point is selected according to the principle of minimum difference (i.e., the minimum distance). The basic idea of center point selection is to select the data with the smallest object value in the dataset as the fixed point and calculate the distance between the remaining object points and the fixed point. Then, the calculated distance is sorted up and down, and then the initial object of each group is calculated according to a certain principle, and the initial center value is calculated after each object in the data set is grouped.
Input: Data set D ={ x1, ⋯ , x n } consisting of n data points, number of clusters k
Output: k initial center points
Method:
(1) The n data in D are sorted in ascending order, that is
(2) The distance from the data in D to x1 is calculated, that is
As assumed by Equation (1),
(3) From n data, k points are uniformly selected as the initial value of the center point of the class.
(4) The distance from x
i
, i = 1, 2, ⋯ n to
(5) The elements of the jth class are averaged to get the updated class center point, which is recorded as
(6) Step (5), (6) is repeatedly calculated to obtain
We assume that there are 10,000 data, that is n = 10000.
The following is a list of the initial values of n class center points when the number of classes k takes different values.
Based on the K-means clustering method based on uniform initialization method, the K-means clustering method based on optimal initialization method is obtained. The feature of this method is that it can avoid the problem that the traditional K-means clustering method randomly selects the initial center point. Secondly, compared with the K-means clustering method based on uniform initialization method, it pays more attention to the density and association of sample data in the selection of the initial center point, and can further reduce the number of iterations, increase the computational efficiency, and is more suitable and convenient for large-capacity data samples [14].
Input: Data set D ={ x1, ⋯ , x n } consisting of n data points, number of clusters k
Output: k number initial center point
Method:
(1) We assume n sets of data
∥ (a, b, c)∥ is defined as 为
(2) The distance between the two data in D is calculated
(3) d
i
is sorted in ascending order and re-represented as
The largest k-1-number distance
(4) The mean value of the elements in each class is taken as the initial value of the center point of the class and is recorded as
(5) The distance from χ
i
, i = 1, 2, ⋯ , n to
(6) The elements of the j-th class are averaged to get the updated class center point, which is recorded as
(7) Step (5), (6) is repeatedly calculated to obtain
The initial cluster center point is calculated based on the basic steps of the improved cluster analysis. The case when the number of categories of clusters is 2, 3, 4, and 5 is as shown in Table 1:
Clustering initial cluster center points for each category
According to the classification results of the above categories. Moreover, according to the ratio between the sum of squares between groups and the sum of squares in the cluster analysis results, the optimal number of cluster categories is selected [15]. K-means clustering is performed using the initial cluster center points in Table 1 above. The ratio of the sum of squares between groups, the sum of squares in the group, the sum of squares, and the sum of squares of the groups to the sum of squares of the clustering results of the final analysis are shown in Table 2 below:
The square between the group, the square within the group, and the total square corresponding to the number of cluster groups
Similarly, according to the traditional K-means clustering method, the clustering group number is selected. After considering the inter-group gap and the intra-group gap of the clustering result, the number of clustering categories should also consider the difference between the clustering groups. When the number of cluster groups does not exceed 4, each time a group clustering result is added, the sum of squares between groups is increased faster. However, when the clustering group exceeds 4 groups, the increase in the square sum of the clustering results is not obvious. It shows that when the group does not exceed 4 groups, each time a group is added, the gap between each group is relatively large. When the grouping group is above 4 groups, each time a group is added, the difference between the groups is not obvious [16]. Therefore, 4 groups of packets are finally selected as the group number of the best grouping.
Finally, the number of cluster groups determined was 4 groups. According to the results of clustering, the number of samples in the first group is 36, the number of samples in the second group is 1, the number of samples in the third group is 72, and the number of samples in the fourth group is 2.
Table 3 reflects the center points of the clusters of each category. Since the three indicators have been standardized before, we can consider the average value of each indicator to be 0. Therefore, the indicator above the average value of 0 indicates that the indicator is above the average level. If the indicator is less than 0, the indicator is lower than the average. The mean values corresponding to the center points of the four categories are now explained.
Cluster center points of each group of the final cluster
The position of the center point corresponding to the first category is (–0.06068, 0.228536, 1.144119). The value of this category of companies in terms of economic growth is –0.06068, which is not much different from the average. The solvency value is 0.228536, which is a little above the average solvency level. The profitability indicator is 1.144119, which is significantly above average. This shows that companies in this category maintain a normal level of economic growth and have a large advantage in terms of profitability. This type of company has strong capital and enters a stable stage of development. Although economic growth occasionally fluctuates, the company is profitable in the long run.
The position of the center point of the second category is (1.78881, –7.98419, 1.11384). That is, the value of Z1 corresponds to 1.78881, which is greater than 0, indicating that the companies in these categories are superior to the average of all companies in terms of economic growth characteristics. The coordinate point on Z2 is –7.98419, which is significantly less than 0, indicating that the solvency of this category of companies is low and significantly lower than the average of all companies. 这 The corresponding center point of the category on the Z3 coordinates is 1.111384, which is greater than 0, indicating that companies in this category are above average in terms of profitability. Companies in this category perform better than the average of all companies in terms of economic growth and profitability, but solvency is clearly below average. It states that this type of company is in the stage of making up the deficit. Although the economy is growing and is in the profit stage, most of the funds are used to make up for the previous deficit.
The center position of the company in the third category is (–0.18439, –0.02051, –0.57377). The value of this category of companies in economic growth is –0.18439, which is lower than the average of other companies, indicating that such companies are not good at economic growth. The solvency value is –0.02051, which is slightly lower than the average of the companies. The profitability value is –0.57377, which is lower than the average value of 0, indicating that the companies in this category also have corresponding problems in terms of profitability. Companies in this category have experienced some financial quality conditions, economic growth is below average, and there are corresponding problems in profitability.
The central position of the category in the cluster analysis is (6.835655, 0.61691, –0.49533). The central value of this category of companies in terms of economic growth is 6.835655, which is far higher than the average of each company, indicating that such companies are in the period of rising economic growth. The central value of solvency corresponds to 0.61691, which is higher than the average of each company. The corresponding value of profitability is –0.49533, which is lower than the average level of 0. From the description of these three characteristics, companies in this category are in the process of rising development. As the company is just in its infancy and the initial investment is too large, it is still in the non-profit period at this stage.
The above-mentioned enterprise classification shows that the first type of company has better solvency and economic growth ability. However, the profitability is poor. This type of company is classified as “low-profit”. For this type of company, the company should find the main projects of the company’s economic growth and profitability and carry out corresponding improvement development [17]. The second type of company is a “medium” company, which has good profitability and solvency, but economic growth is in a downhill phase. Therefore, the company’s internal problems should be discovered in a timely manner and handled in a proper manner. The third type of corporate is characterized by poor profitability, solvency, and economic growth, which are “risk-type” companies. This type of enterprise should pay more attention to the management of asset structure and profit in the future development and strengthen reform and innovation to get the company out of the current predicament. The fourth type of company has better profitability and economic growth, but its solvency is poor. This type of company is a “development” company, and the company’s development is in a rising stage. However, due to the excessive investment, the current profit is still unable to fill the previous investment and the solvency is poor.
In order to facilitate the final comparison, this section uses the number of optimal clustering categories selected by the previous cluster analysis method to classify the financial quality of the enterprise. According to the results of clustering, the number of samples in the first group is 13, the number of samples in the second group is 2, the number of samples in the third group is 58, and the number of samples in the fourth group is 38.
Table 3 reflects the center points of the clusters of each category. Since the three indicators have been standardized before, we can consider the average value of each indicator to be 0. Therefore, the indicator above the average value of 0 indicates that the indicator is above the average level. If the indicator is less than 0, the indicator is lower than the average. The mean values corresponding to the center points of the four categories are now explained.
The position of the center point corresponding to the first category is (–0.156425, –1.697095, –0.292518). The value of this category of companies in economic growth is –0.156425, which is lower than the average of other companies, indicating poor economic growth. The solvency value is –1.697095, which is far below the average of the companies. The profitability value is –0.292518, which is lower than the average value of 0, indicating that the companies in this category also have corresponding problems in terms of profitability. Companies in this category have experienced some financial quality conditions, economic growth is below average, and there are corresponding problems in profitability.
The position of the center point of the second category is (6.835655, 0.616910, –0.495330). The central value of this category of companies in terms of economic growth is 6.835655, which is far from the average of each company, indicating that such companies are in the period of economic growth. The central value of solvency corresponds to 0.61691, which is higher than the average of each company. The corresponding value of profitability is –0.49533, which is lower than the average level of 0. From the description of these three characteristics, companies in this category are in the process of rising development. As the company is in its infancy, and the initial investment is too large, it is still in the non-profit period at this stage.
The center positions of the companies in the third category are (–0.155983, 0.220738, –0.636708). The value of this category of companies in terms of economic growth is –0.155983, which is lower than the average of other companies, indicating poor economic growth. The solvency value is 0.220738, which is higher than the average of the companies. The value of profitability is –0.636708 below the average of 0, indicating that companies in this category have problems in terms of economic growth and profitability. However, the company’s high solvency indicates that this type of company has strong capital, but recently there has been a poor profit.
The centers of the fourth category of companies in the cluster analysis are (–0.068179, 0.211201, 1.097959). The value of this category of companies in terms of economic growth is –0.068179, which is not much different from the average. The solvency value is 0.211201, which is higher than the average solvency level. The profitability indicator is 1.097959, which is significantly above average. This shows that companies in this category maintain a normal level of economic growth and have a large advantage in terms of profitability. This type of company has strong capital and enters a stable stage of development. Although economic growth occasionally fluctuates, the company is profitable in the long run.
According to the above-mentioned enterprise classification, the first type of company’s corporate profitability, solvency and economic growth ability are both poor, so it is a “risk type” enterprise. In the future development of this type of enterprise, we should pay more attention to the management of asset structure and profit and strengthen reform and innovation to make the company out of the current predicament. The second type of company has better profitability and economic growth, but its solvency is poor. This type of company is a “development” company, and the company’s development is in a rising stage. However, due to the excessive investment, the current profit still cannot fill the previous investment and the solvency is poor. This type of company should plan for future development. Due to the rapid development, each stage will face different problems. Therefore, it should be well prepared for future development. The third type of company has poor profitability and economic ability but better solvency. This type of company is a “loss-making” company. The company’s funds are strong, but the company is in a state of loss recently. The fourth type of company has better solvency and economic growth, but its profitability is poor. This type of company is classified as “low profitable”. This type of company should find the main projects of the company’s economic growth and profitability and carry out corresponding improvement development.
Figure 1 is the effect diagram of the K-means clustering analysis result of the optimal initialization method. It can be seen from the figure that the number of categories of the final clustering analysis is 4, the effect of the classification is obvious, and the different colors represent different categories. The figure shows that the number of different groups has significant differences in different dimensions. From the perspective of graphical visualization, it is obvious that the analysis is more effective. Cluster center points of each group as show in Table 4.
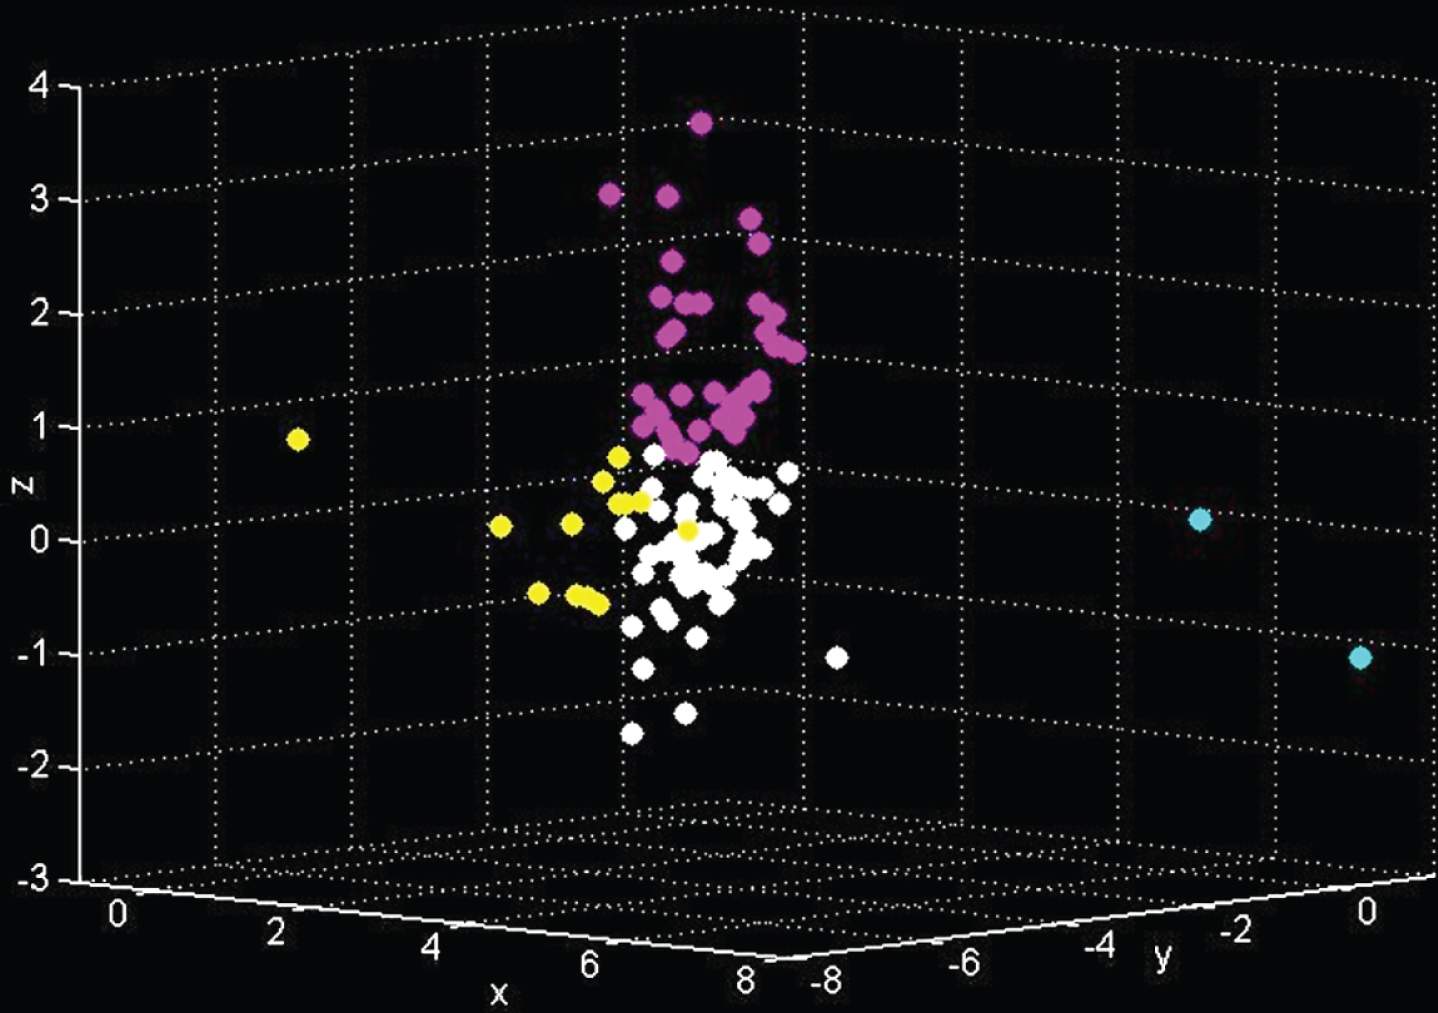
Effect diagram of K-means clustering analysis results of optimal initialization method.
Cluster center points of each group of the final cluster
To evaluate the level of regional economic development, a scientific evaluation index system must be established. The level of economic development reflects the state of a region in terms of economic aggregates and growth rates. However, in a broad sense, the evaluation of the level of economic development in a region should not be limited to its economic performance but should also consider its social and environmental levels. Therefore, this paper screens indicators from the economic, social and environmental levels.
As can be seen from Table 5, the indicator system contains a total of 14 economic indicators, and covers the economic, social and environmental indicators. The selected indicators are expressed in relative numbers. In addition to the lack of some indicators, the data can be obtained through official channels such as statistical yearbooks. Therefore, the indicator system basically follows the above criteria. On the whole, the established indicator system is scientific.
Evaluation index system of china’s economic development level
Evaluation index system of china’s economic development level
In this study, the top 10 influencing factors were selected as the research objects. First, the icons of the statistical charts of each region were specified. The results are shown in Fig. 2.
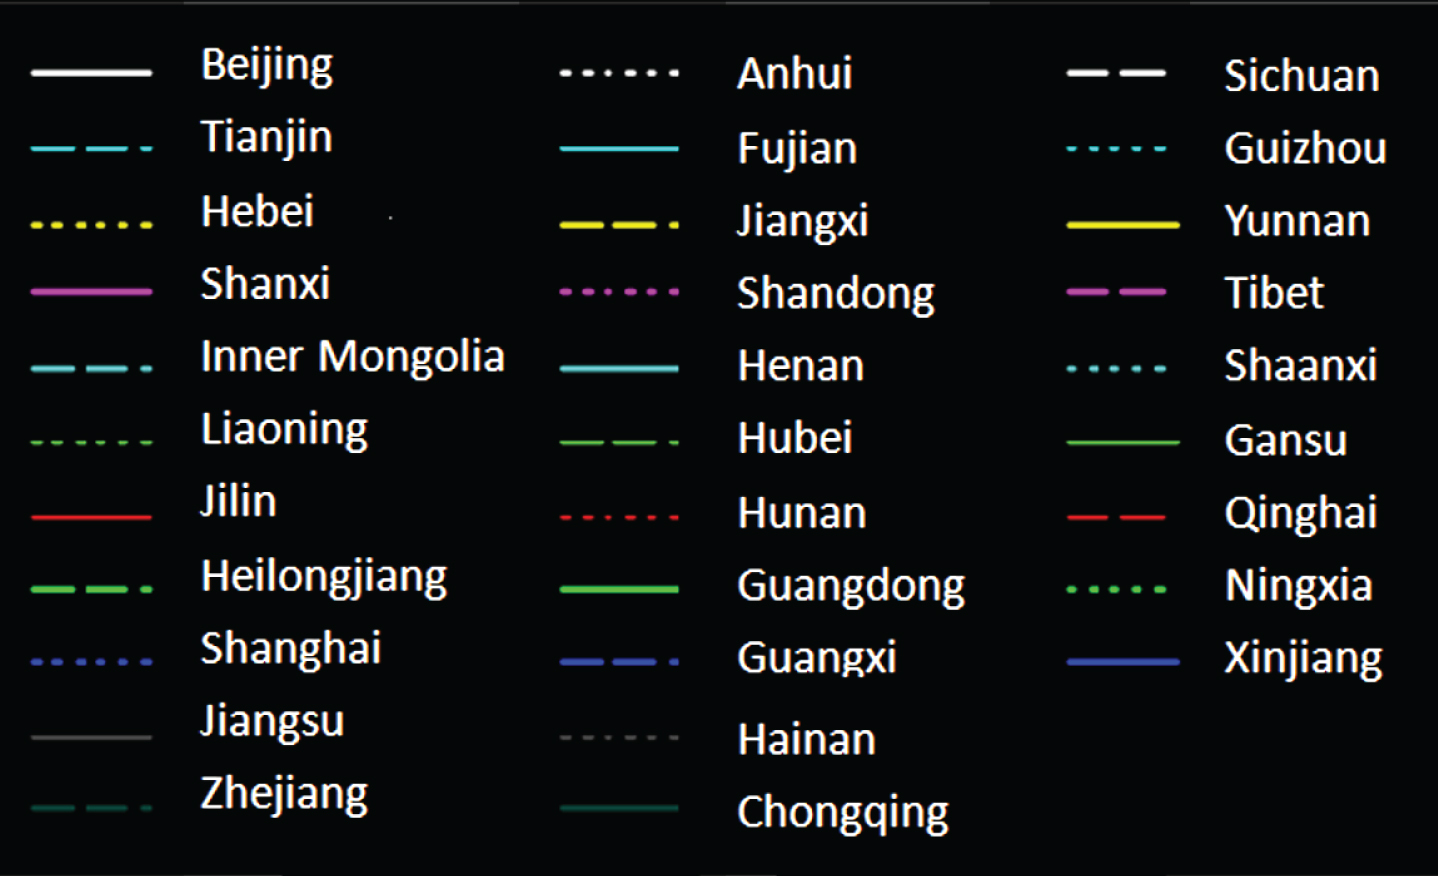
Display icon in the area statistics chart.
The X1–X3 indicator trend change graph obtained on this basis is shown in Figs. 3–5.
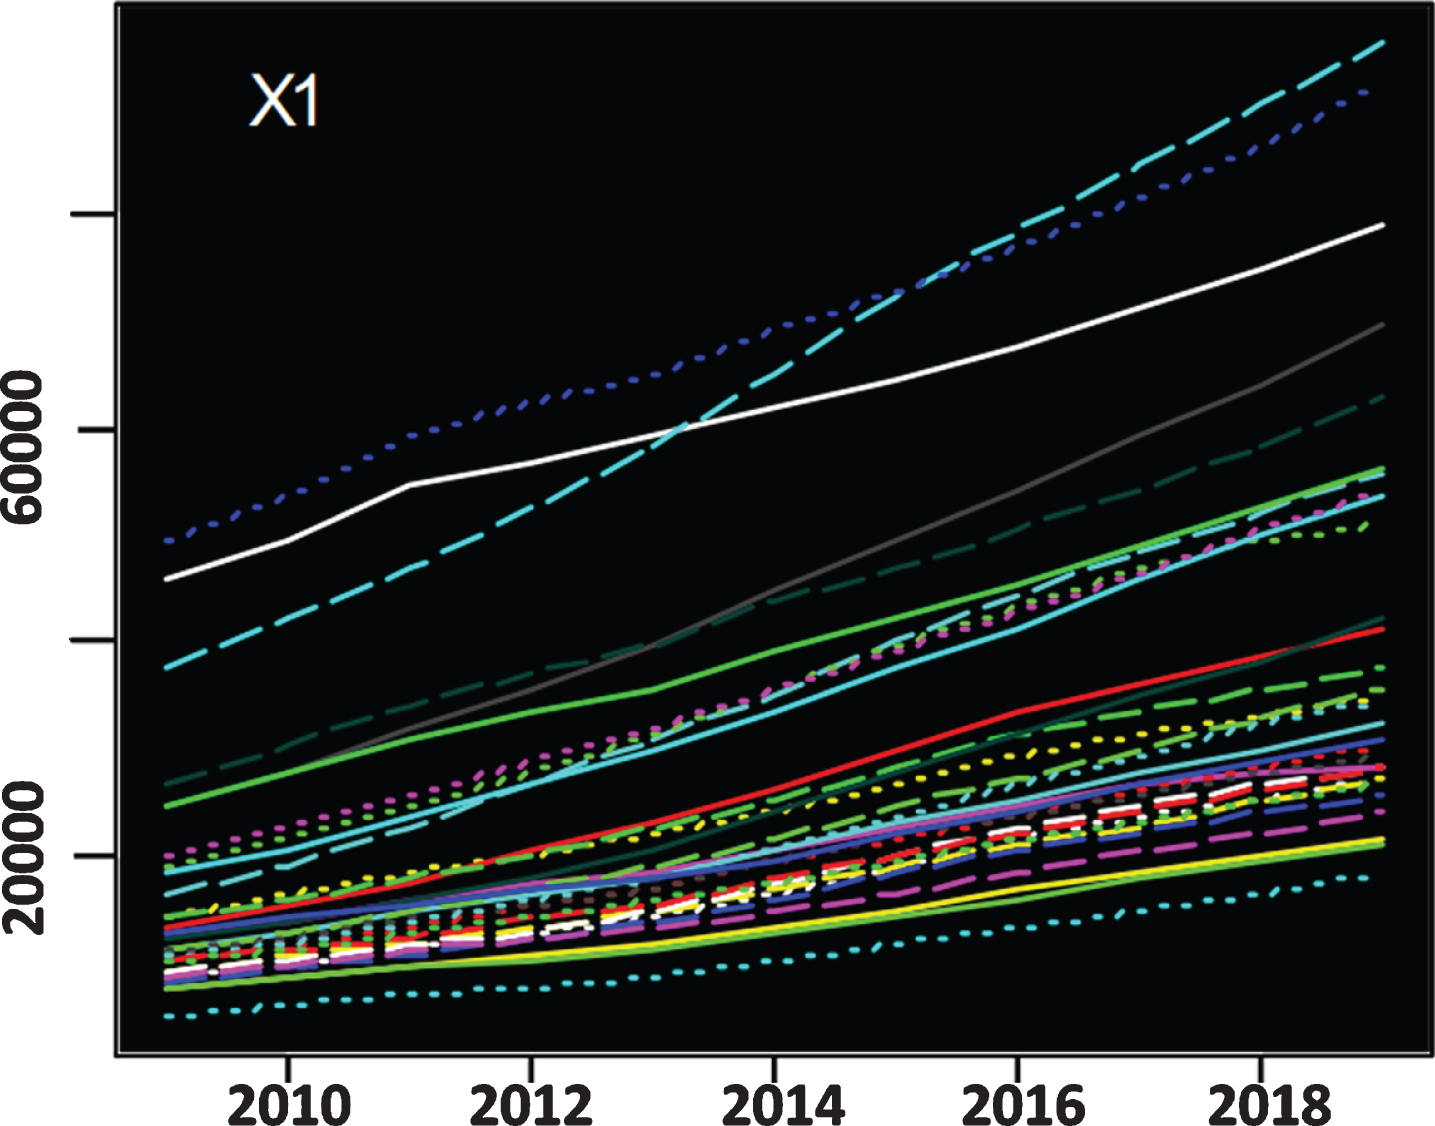
Trend change chart of indicator X1.
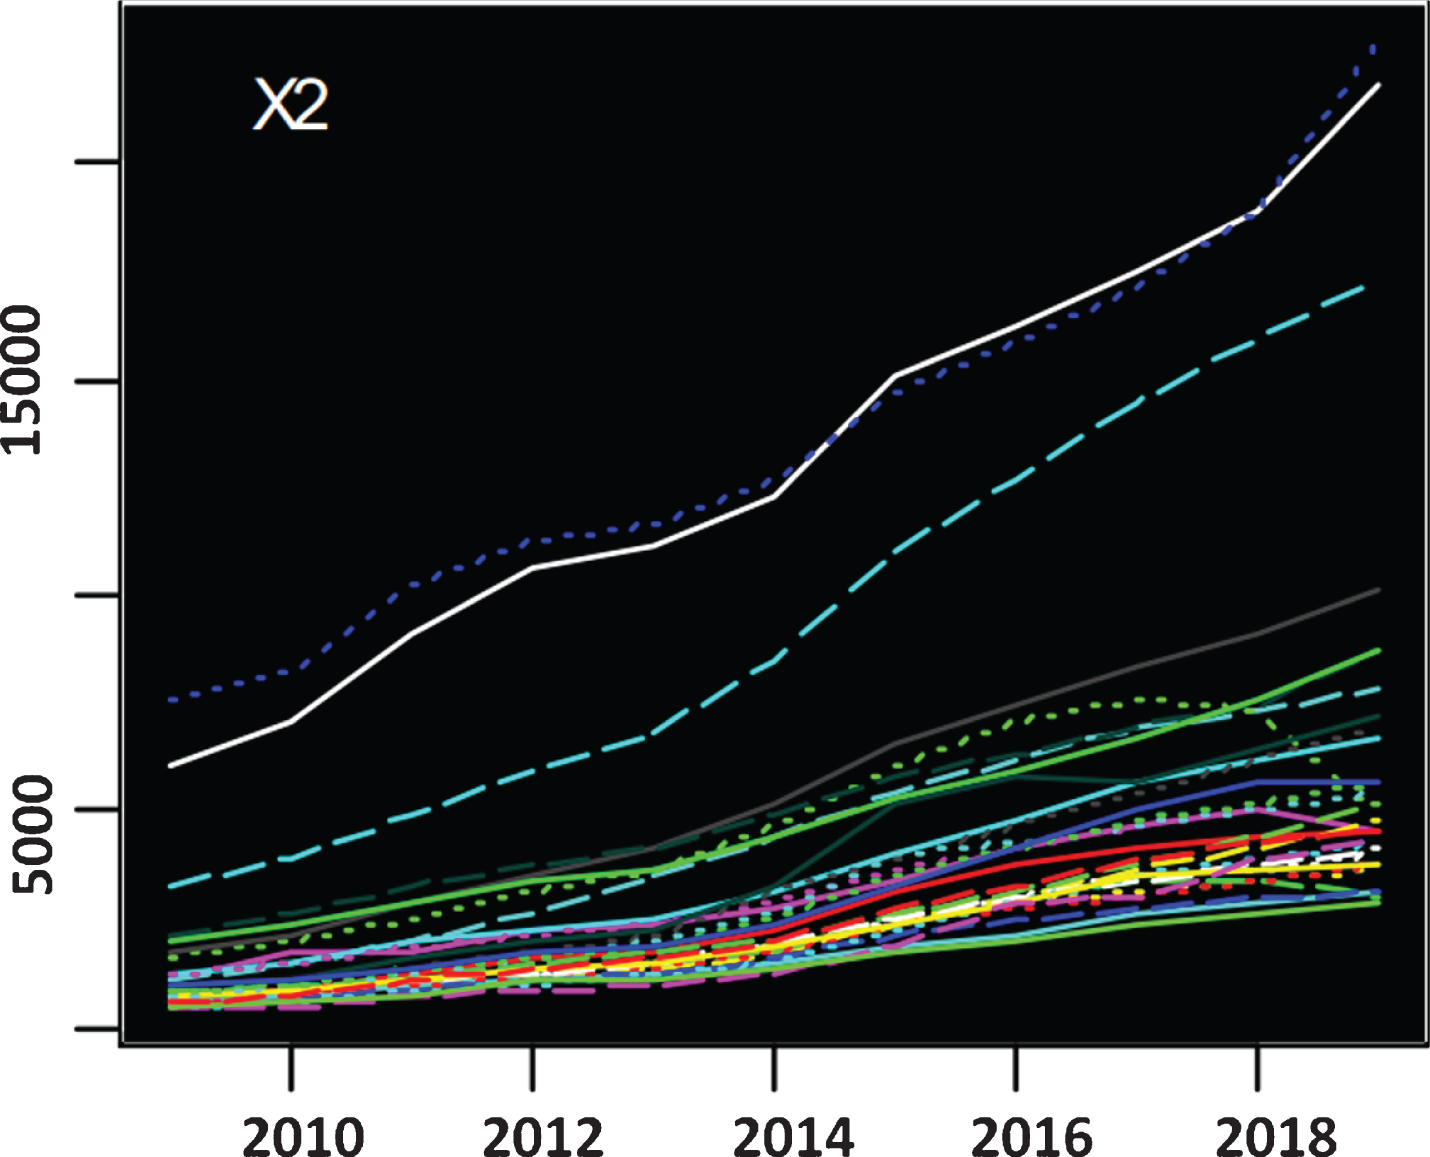
Trend change chart of indicator X2.
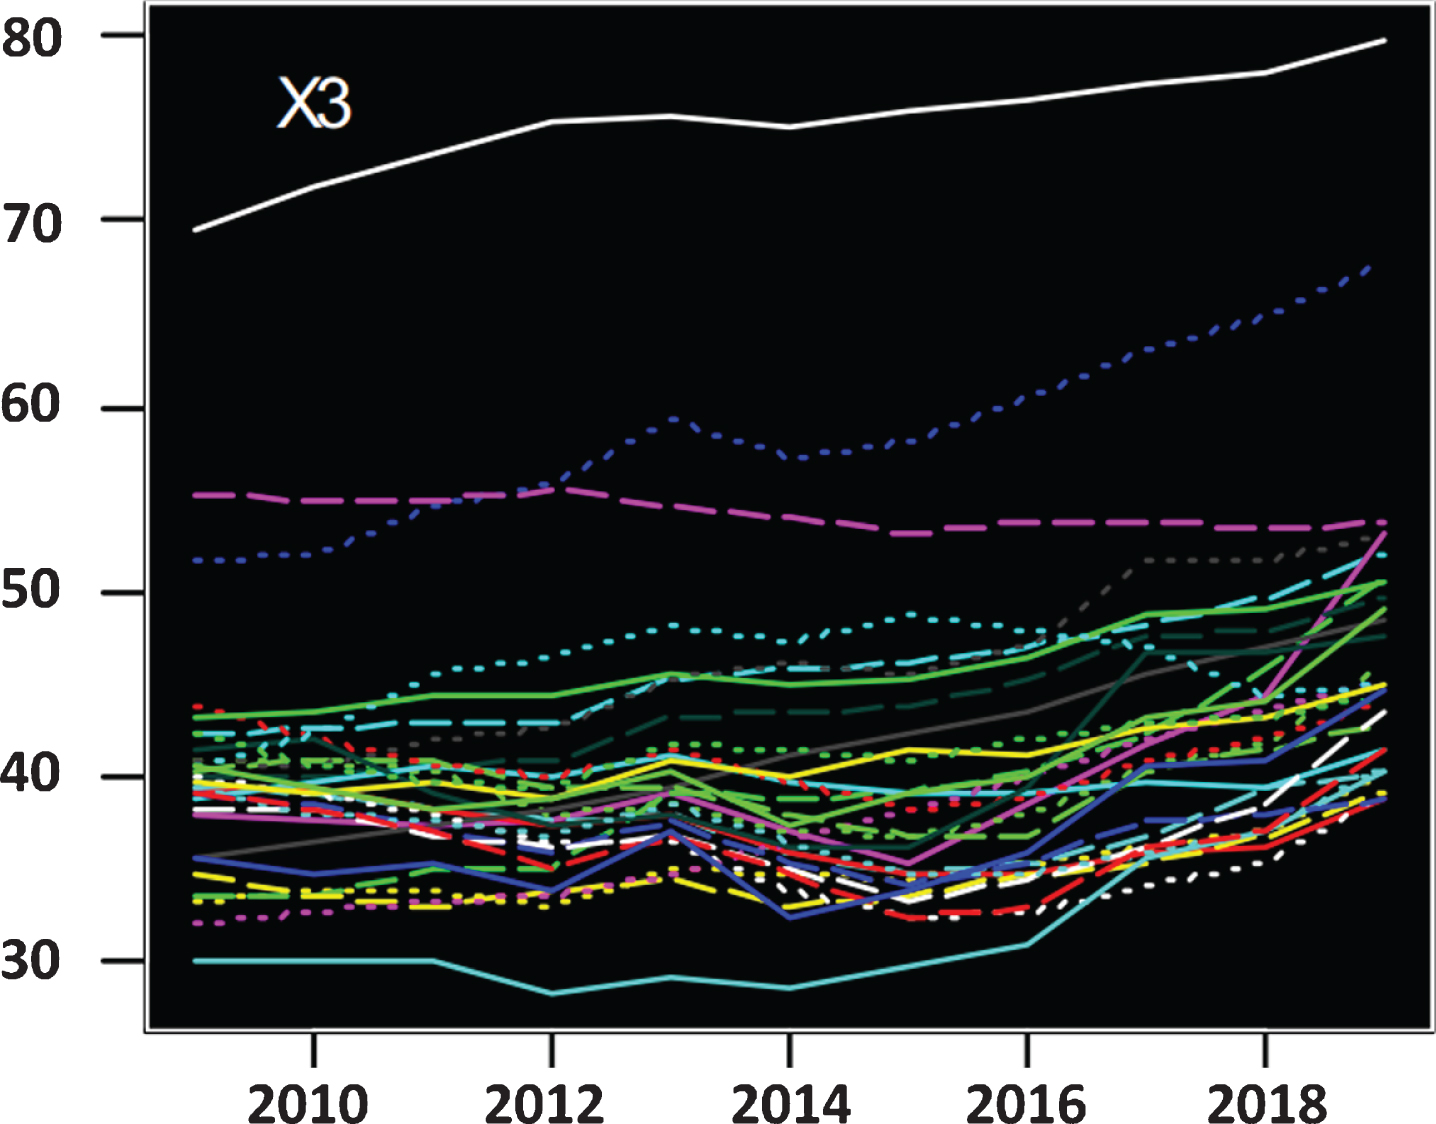
Trend change chart of indicator X3.
From the perspective of change trend, the proportion of the tertiary industry structure in most regions of China has a “U” change, and the lowest point appears between 2014 and 2015, after which the curve begins to rise. The increase in Shanxi is the most significant, and Tibet and Fujian have basically maintained a stable state, while the proportion of tertiary industry in Guizhou has declined. The performance of China’s various regions in terms of trade openness indicators shows a clear trend of descending from coastal to inland. Shanghai and Guangdong have the highest degree of openness to the outside world, followed by Jiangsu, Zhejiang, and Tianjin, and the remote openness of the northwest and other remote inland areas is extremely low, which is also a very important factor restricting local economic development. From the perspective of index increment, due to the impact of economic transformation, demand structure adjustment and financial crisis, the trade openness indicators of most provinces and cities showed a slow downward trend. However, since 2014, Chongqing has rapidly increased its openness to the outside world, and it has basically reached the standards of coastal cities such as Hainan and Shandong.
Figures 6–9 shows the trend change of the X4–X7 indicator.
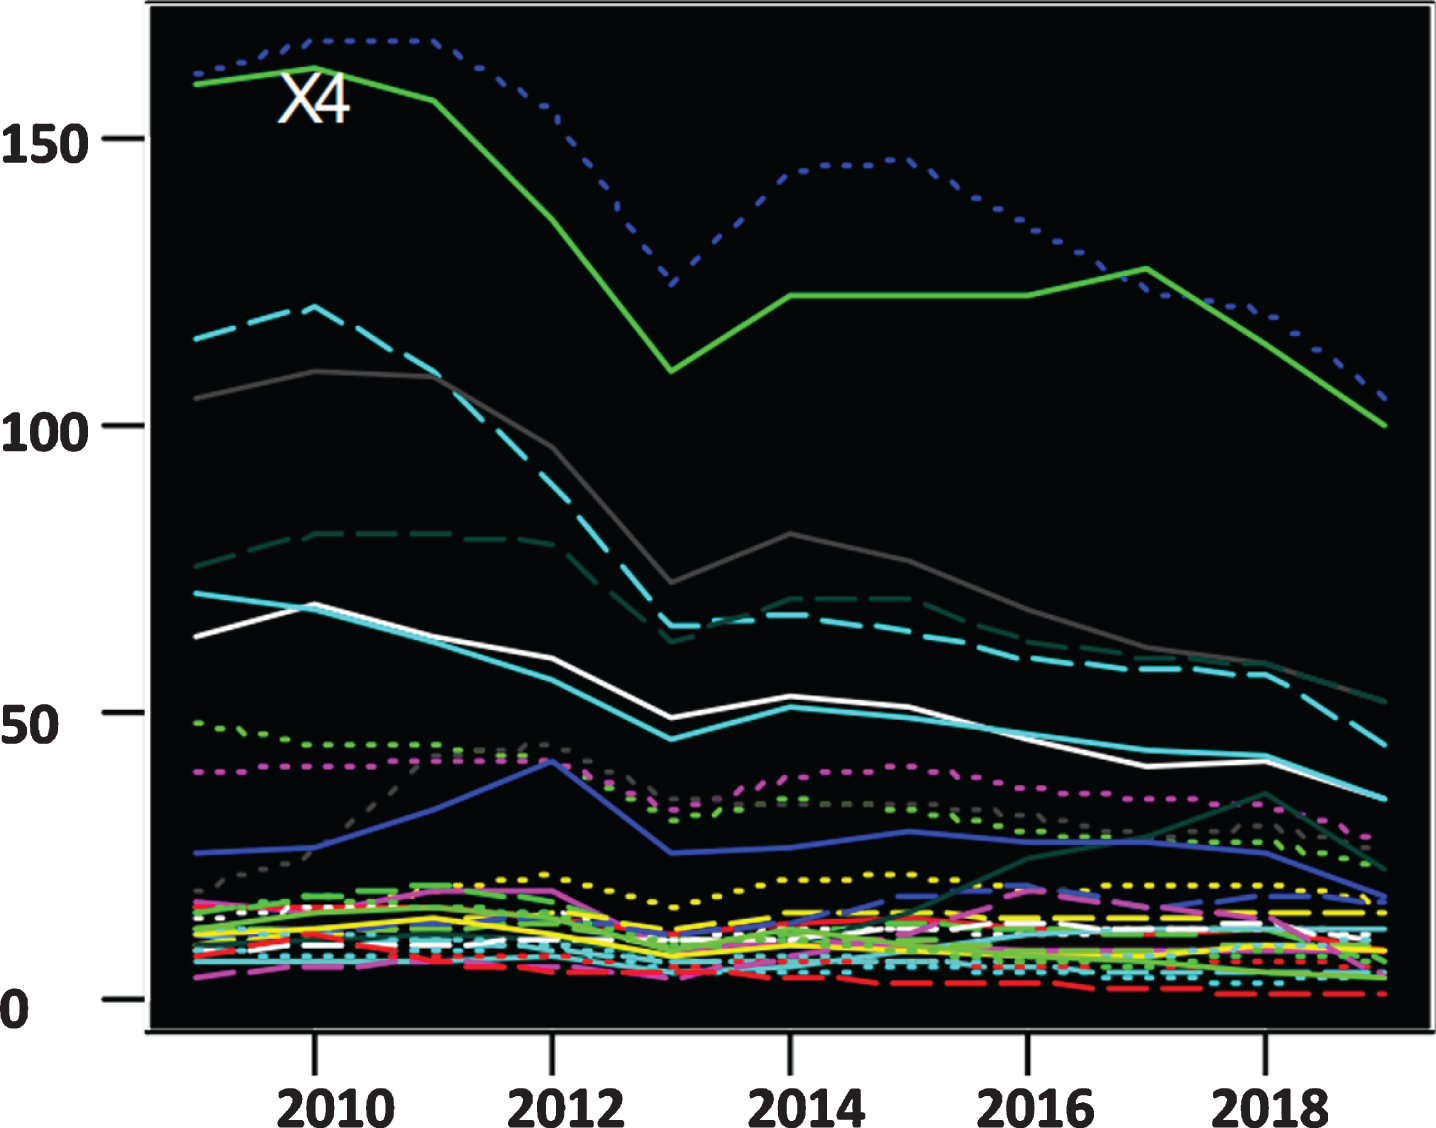
Trend change chart of indicator X4.

Trend change chart of indicator X5.

Trend change chart of indicator X6.
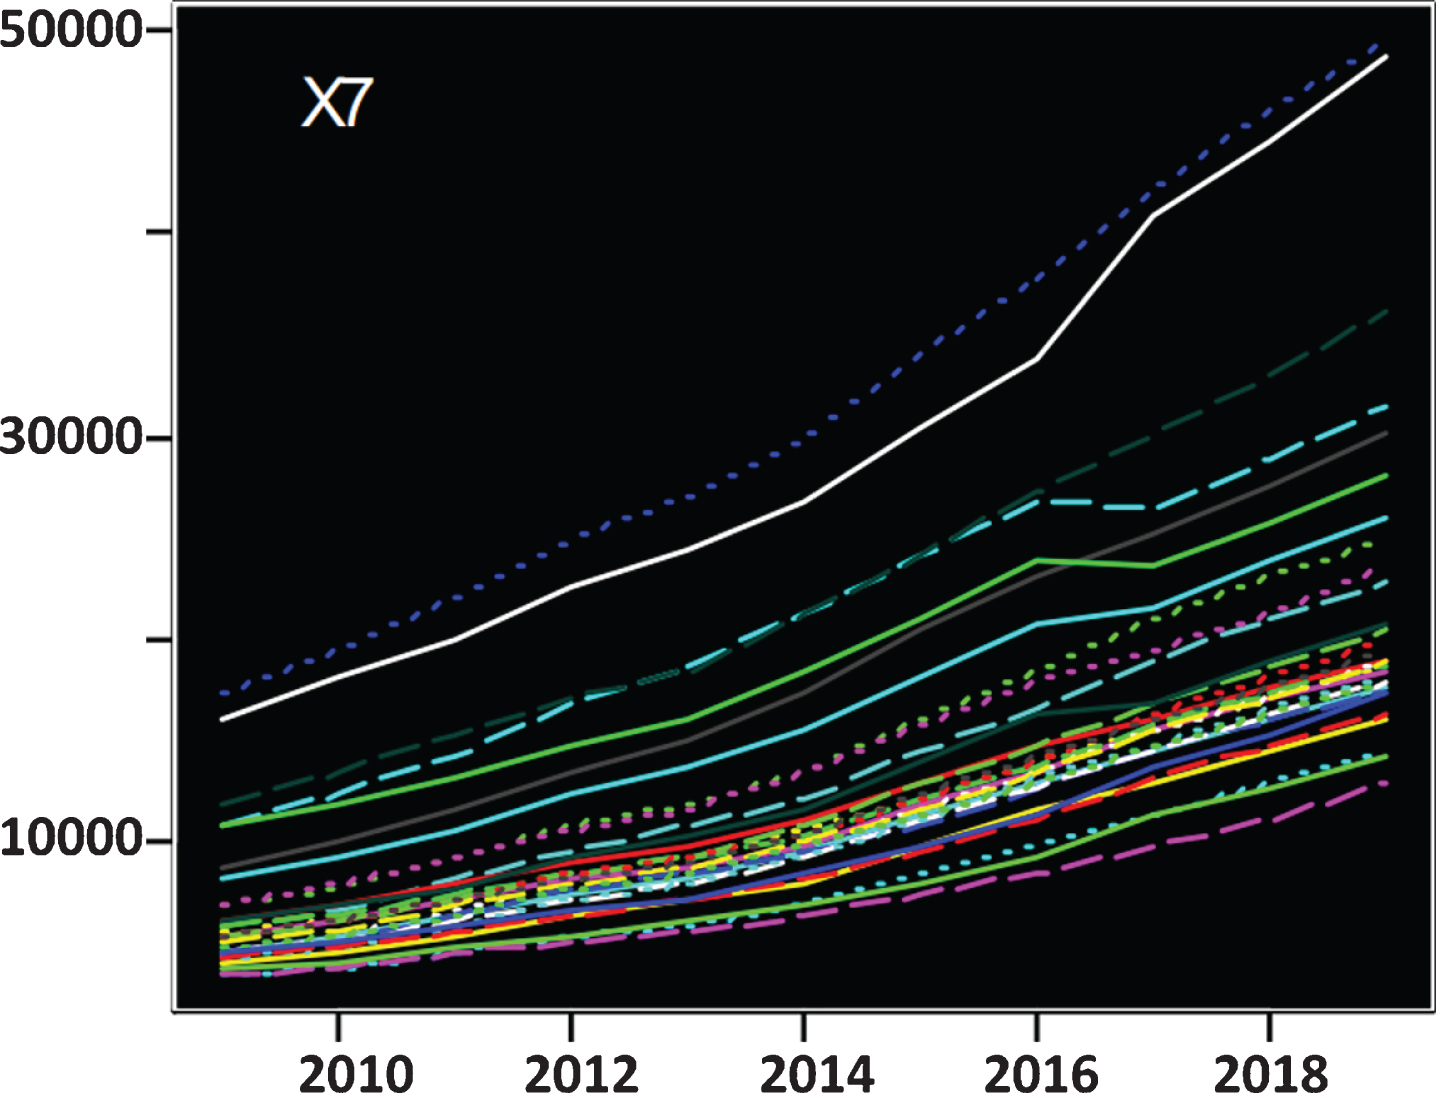
Trend change chart of indicator X7.
Residents’ consumption levels and per capita disposable incomes were basically the same in the 2010–2018 range, and the overall performance showed a steady upward trend, and the changes were similar. From the distribution of the trend line, it can be seen that the income level and consumption level of residents in most areas of China are low, and the areas with better performance in both of them are located in the coastal distribution belt. Residents in Shanghai have the highest income and consumption levels, followed by Beijing, and the living standards of residents in Tibet, Gansu and Guizhou are relatively backward. The sudden change in the per capita disposable income for 2018 is mainly due to the scope, method and caliber adjustment of the indicator. The proportion of urban population reflects the progress of urbanization in a certain region. In the forefront of the country’s urbanization development, Shanghai, Beijing and Tianjin are still the most, and the urbanization process in Tibet is the slowest. In general, urbanization development in various regions is slowly moving forward. Overall, the urban-rural income gap in various regions of China is shrinking. However, after 2017, the urban-rural gap in Beijing, Liaoning and Heilongjiang areas has experienced an abnormal surge. This is mainly due to changes in the scope, methods and caliber of the statistical indicators for the income indicators around 2017.
Figures 10–12 shows the X8–X10 indicator trend change graph. The value of comprehensive utilization index of industrial solid waste in most provinces and cities in China fluctuates greatly, and the direction and magnitude of fluctuations in different regions are not the same. Among them, Tianjin, Shanghai, Jiangsu, Zhejiang and Shandong have performed well in the comprehensive utilization of industrial waste, reaching a high level, and the index value of Tibet is close to zero, and the awareness of comprehensive utilization of industrial waste is seriously lacking. The indicators of Jiangxi, Gansu and Qinghai all showed a significant increase, while the indicators of Hainan and Hebei showed a sharp decline. This also reflects that China’s overall awareness of the comprehensive utilization of industrial waste is not high. The discharge per unit of GDP and the SO2 emissions per unit of industrial added value are indicators that reflect economic quality. The overall distribution characteristics of the 31 provinces and cities in China are similar, that is, they all show the characteristics of “two heads dense and dense”. For the unit GDP wastewater discharge indicators, Guangxi and Ningxia have performed poorly. The awareness of wastewater treatment in Chongqing, Hainan, Hunan, Hubei and other places needs to be strengthened. Tibet, Inner Mongolia and Tianjin have performed well in wastewater discharge control. For the industrial value-added SO2 emission index, the indicators in Guizhou and Ningxia are much higher than other regions, and the environmental side effects brought about by economic development are worrying. Beijing, Shanghai, Guangzhou and other places have done a good job in SO2 emission control.
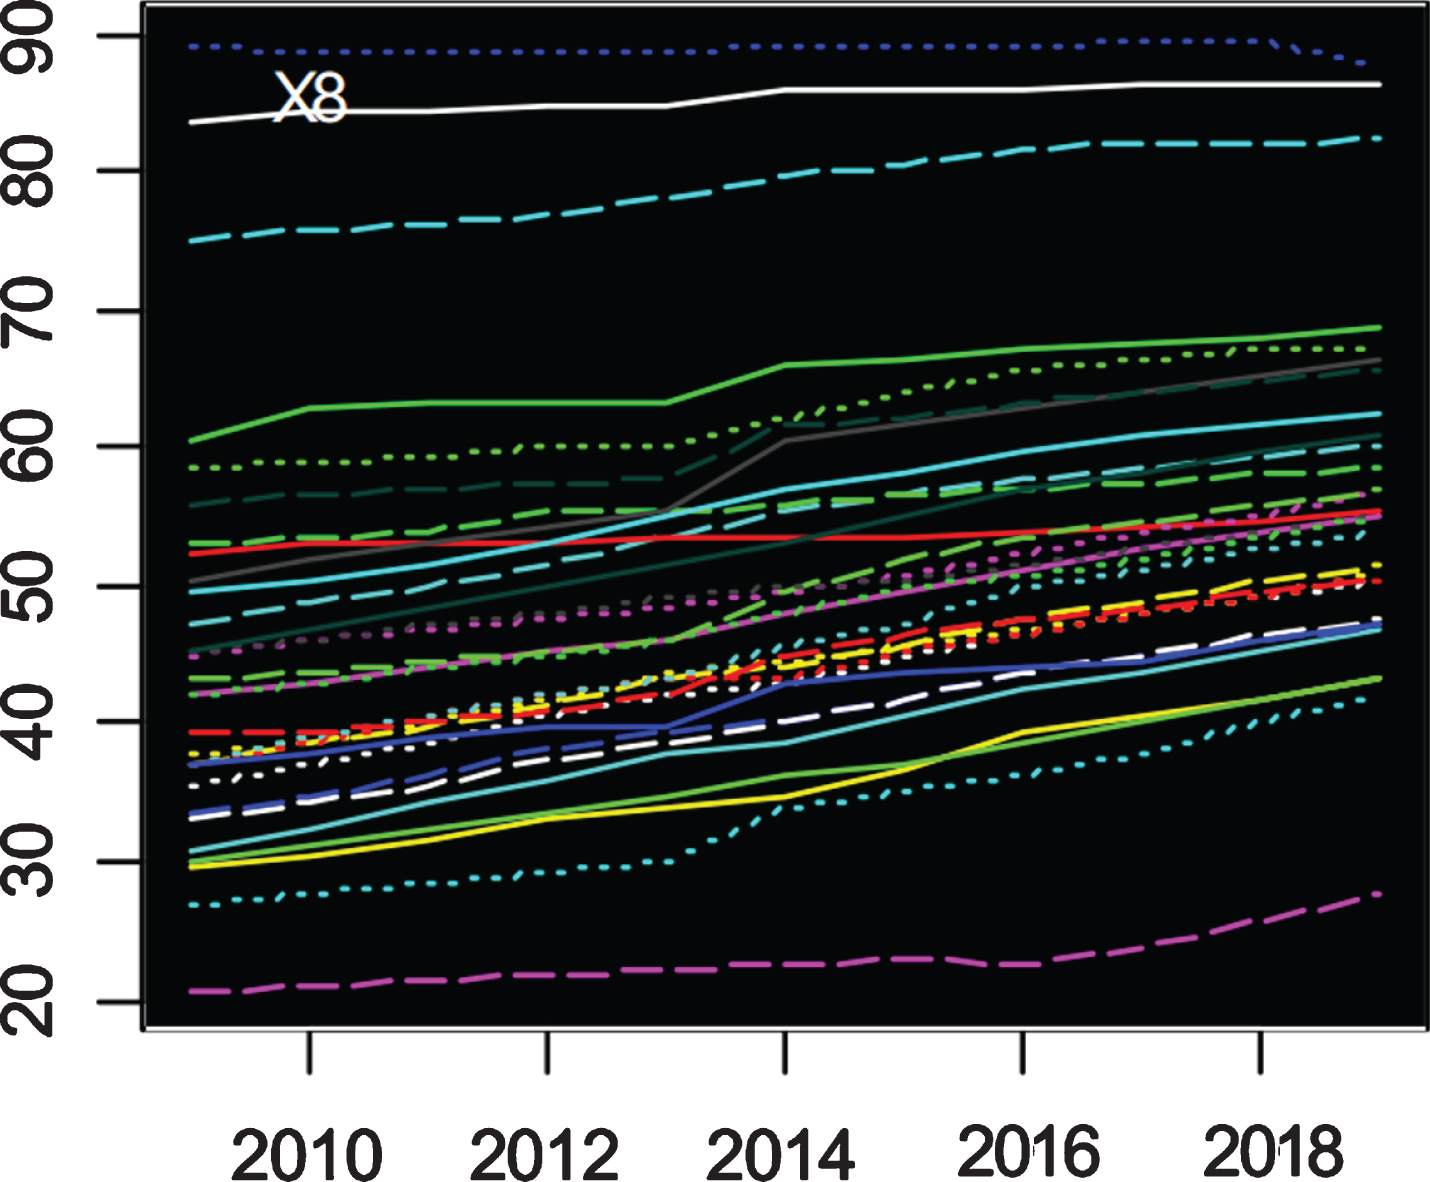
Trend change chart of indicator X8.

Trend change chart of indicator X9.

Trend change chart of indicator X10.
This paper constructs a set of regional economic development level evaluation index system from the three perspectives of economy, society and environment. Compared with the evaluation indicators that only describe the economic development from the economic and social perspective, it is more accurate and comprehensive. In addition, the MA clustering method is used to dynamically cluster and cluster the regional economic development level, which overcomes the problem that one cluster cannot give the regional economic dynamic development characteristics and the insufficient comparability caused by clustering in each year. The empirical analysis shows that the imbalance of regional economic development in China is still very serious. Combining the trend analysis of indicators and the conclusion of category change analysis, this paper puts forward the following suggestions for solving regional economic imbalances: (1) In economically backward areas, raising awareness of changing their own appearance is the key to solving the imbalance in regional economic development. (2) Strengthening opening up is an important way to solve the problem of regional economic imbalance.
Footnotes
Acknowledgment
2017 Henan higher education teaching reform research and practice key projects:Research on the innovation of virtual simulation comprehensive training design of Business Administration Specialty under the background of informatization (2017SJGLX075).