
Abstract
On the basis of FHWA model of the Federal Highway Administration and the combination with the geographic information system (GIS) and Fuzzy intelligent control system, the group independently researches and develops a simulation and evaluation system for the traffic noise in the urban road. This system is able to simulate the influence of traffic source, point source, and arbitrary shape area source on the urban sound field environment. It is combined with the noise radiation and the communication model, and the occlusion and attenuation by the buildings and forest belts on the traffic noise have been considered. It can calculate the traffic noise in urban areas and directly render the predicted results on the GIS map, and form a traffic noise map, which visually and clearly displays the pollution degree and distribution map of the traffic noise in urban areas. The noise maps of Guangzhou inner ring roads and Zhujiang New Town are drawn to provide scientific decision-making basis for the control of urban traffic noise pollution.
Keywords
Introduction
Now, the degree of quantification has increasingly become an indicator to measure the development degree of a discipline. “Urban Spatial Development Model” [1], an abstract mathematical expression of urban spatial phenomena and processes on the basis of abstraction and generalization of urban system, is an important means for understanding the changes of urban spatial phenomena and scientifically managing and planning the urban system, which can provide feasible technical support for the implementation of urban policies as well as the formulation and evaluation of urban planning schemes. In this paper, the “Urban Spatial Development Model” is simplified into “Urban Model”, similarly hereinafter [2]. Actually, the research on the Urban Model begins in the early 20th century, and its development mainly experiences three stages: morphological structure model, static model and dynamic model. Besides, dynamic Urban Model based on discrete dynamics is the current research hotspot and future development direction. In this regard, most of internationally typical Urban Models are macro-scale, with the geographic grid or zone as the basic research unit, to classify the main bodies of urban activities [3].
With the need for research scales and the increasing of availability of micro-data, the micro-models (refined Urban Models) have developed rapidly at the international level in recent years, and the demand in developing countries such as China has also increased [4]. On the one hand, China’s big cities now are gradually transforming from spatial expansion to internal modification (urban redevelopment, urban renewal, etc.), and there will be more and more small-scale urban spatial redevelopment, which need refined models to support the analysis and prediction of the urban spatial changes [5]; on the other hand, the city, a complex adaptive system, is composed of land blocks as urban space, residents and enterprises as the main bodies of urban activities, etc., and the bottom-up simulation idea takes people, land and house as the basic research objects to predict the urban spatial changes [6], while coinciding with the needs of planning public participation, social equity and other concepts [7]. In addition, the availability of various refined urban spatial data and socio-economic micro-data now is gradually increasing in China. Therefore, the exploration of refined Urban Model is of theoretical value and practical significance [8].
Unlike the model with large-scale grid, administrative region or transportation analysis zone (TAZ) as simulation scale, the refined Urban Model is different in spatial elements and urban activity elements [9], and will face new theoretical and practical problems, in which Fine Scale corresponds to the simulation scale [10]. On the one hand, in terms of the physical space, the basic spatial unit of analysis and simulation is the land block, which corresponds to the key areas of urban master planning and the working scale of detailed urban planning; on the other hand, in terms of social space, the basic units of analysis and simulation are residents, families and enterprises. “Fine Scale”, as a simulation scale, is proposed relative to the research scale of macro-simulation, and the macro-model generally takes statistical areas, TAZs, administrative regions, industries and people with common characteristics as the basic research objects [11]. The refined Urban Model, a kind of micro-model of spatiotemporal dynamics, takes micro-individuals such as land blocks, residents, families and enterprises as basic simulation objects, which is mainly used to study the spatial problems of urban land development, residential location selection of residents, location selection of enterprises, and spatial and temporal distribution of urban activities, and to support the formulation and evaluation of spatial policies. At present, most researches on the Urban Spatial Development Model in China are large-scale (such as towns or TAZs) because of data limitations [12].
The refined Urban Model has strict data requirements, and the original models mostly adopt different technical methods to solve the problem of individual data scarcity. Internationally, the Population Synthesis is a special research direction, which is used to synthesize the individual data needed by micro simulation (MSM). In the research overview of Müller and Axhausen, several commonly used Population Synthesizers are evaluated, including PopSynWin, ILUTE, FSUMTS, CEMDAP, ALBATROSS and PopGen (some Population Synthesizers such as ILUTE and ALBATROSS are named after their models) [13]. The Iterative Proportional Fitting (IPF) used by ILUTE and PopGen is currently the most widely used method of Population Synthesis, firstly proposed by Deming and Stephan, which can be used to update historical census data with new macrostatistics [14]. In China, Long Ying et al. as well as Long and Shen have proposed a method that use synthetic individual samples based on statistical data, small-scale sample survey and common sense knowledge to preliminarily synthesize the residents individual data of the whole sample of Guangzhou Inner Ring Road, which provides conditions for developing refined urban simulation [15].
In recent years, the computer hardware and software have achieved considerable development, and the data generated by social and economic activities have made rapid progress. The scale of such “big data” is so large that it exceeds the ability of traditional software tools (such as sensor networks, social networks, RFID and call detail records) to acquire, store, manage, share, analyze and visualize [16]. Besides, these big data, combined with other open data (such as available web page resources), provide a good opportunity to develop refined urban simulation models. In this paper, the second part emphatically introduces three common methods of refined urban simulation [17], the third part gives a brief review of the author’s some cases of refined urban simulation in recent years, and the last part puts forward a tentative idea of further developing refined urban simulation in China [18].
FEE-MAS model
The author builds the FEE-MAS Model in 2012, and obtains the simulation framework (Fig. 1) of energy consumption and environmental impact assessment corresponding to land-scale urban form in the virtual space, which now focuses on the research of commuter travel of residents. The basic starting point of the model is as follows: each resident chooses the residential and employment locations, and then chooses the modes of transportation for commuter travel, which can evaluate the energy consumption and environmental impact of resident commuting; and finally, the simulation results are summarized on the scale of land blocks, and the rules are identified. This model is a typical research thought of refined urban simulation. In the next stage, it is planned to achieve the evaluation of travel for other purposes as well as the evaluation of life and production based on the established simulation framework.
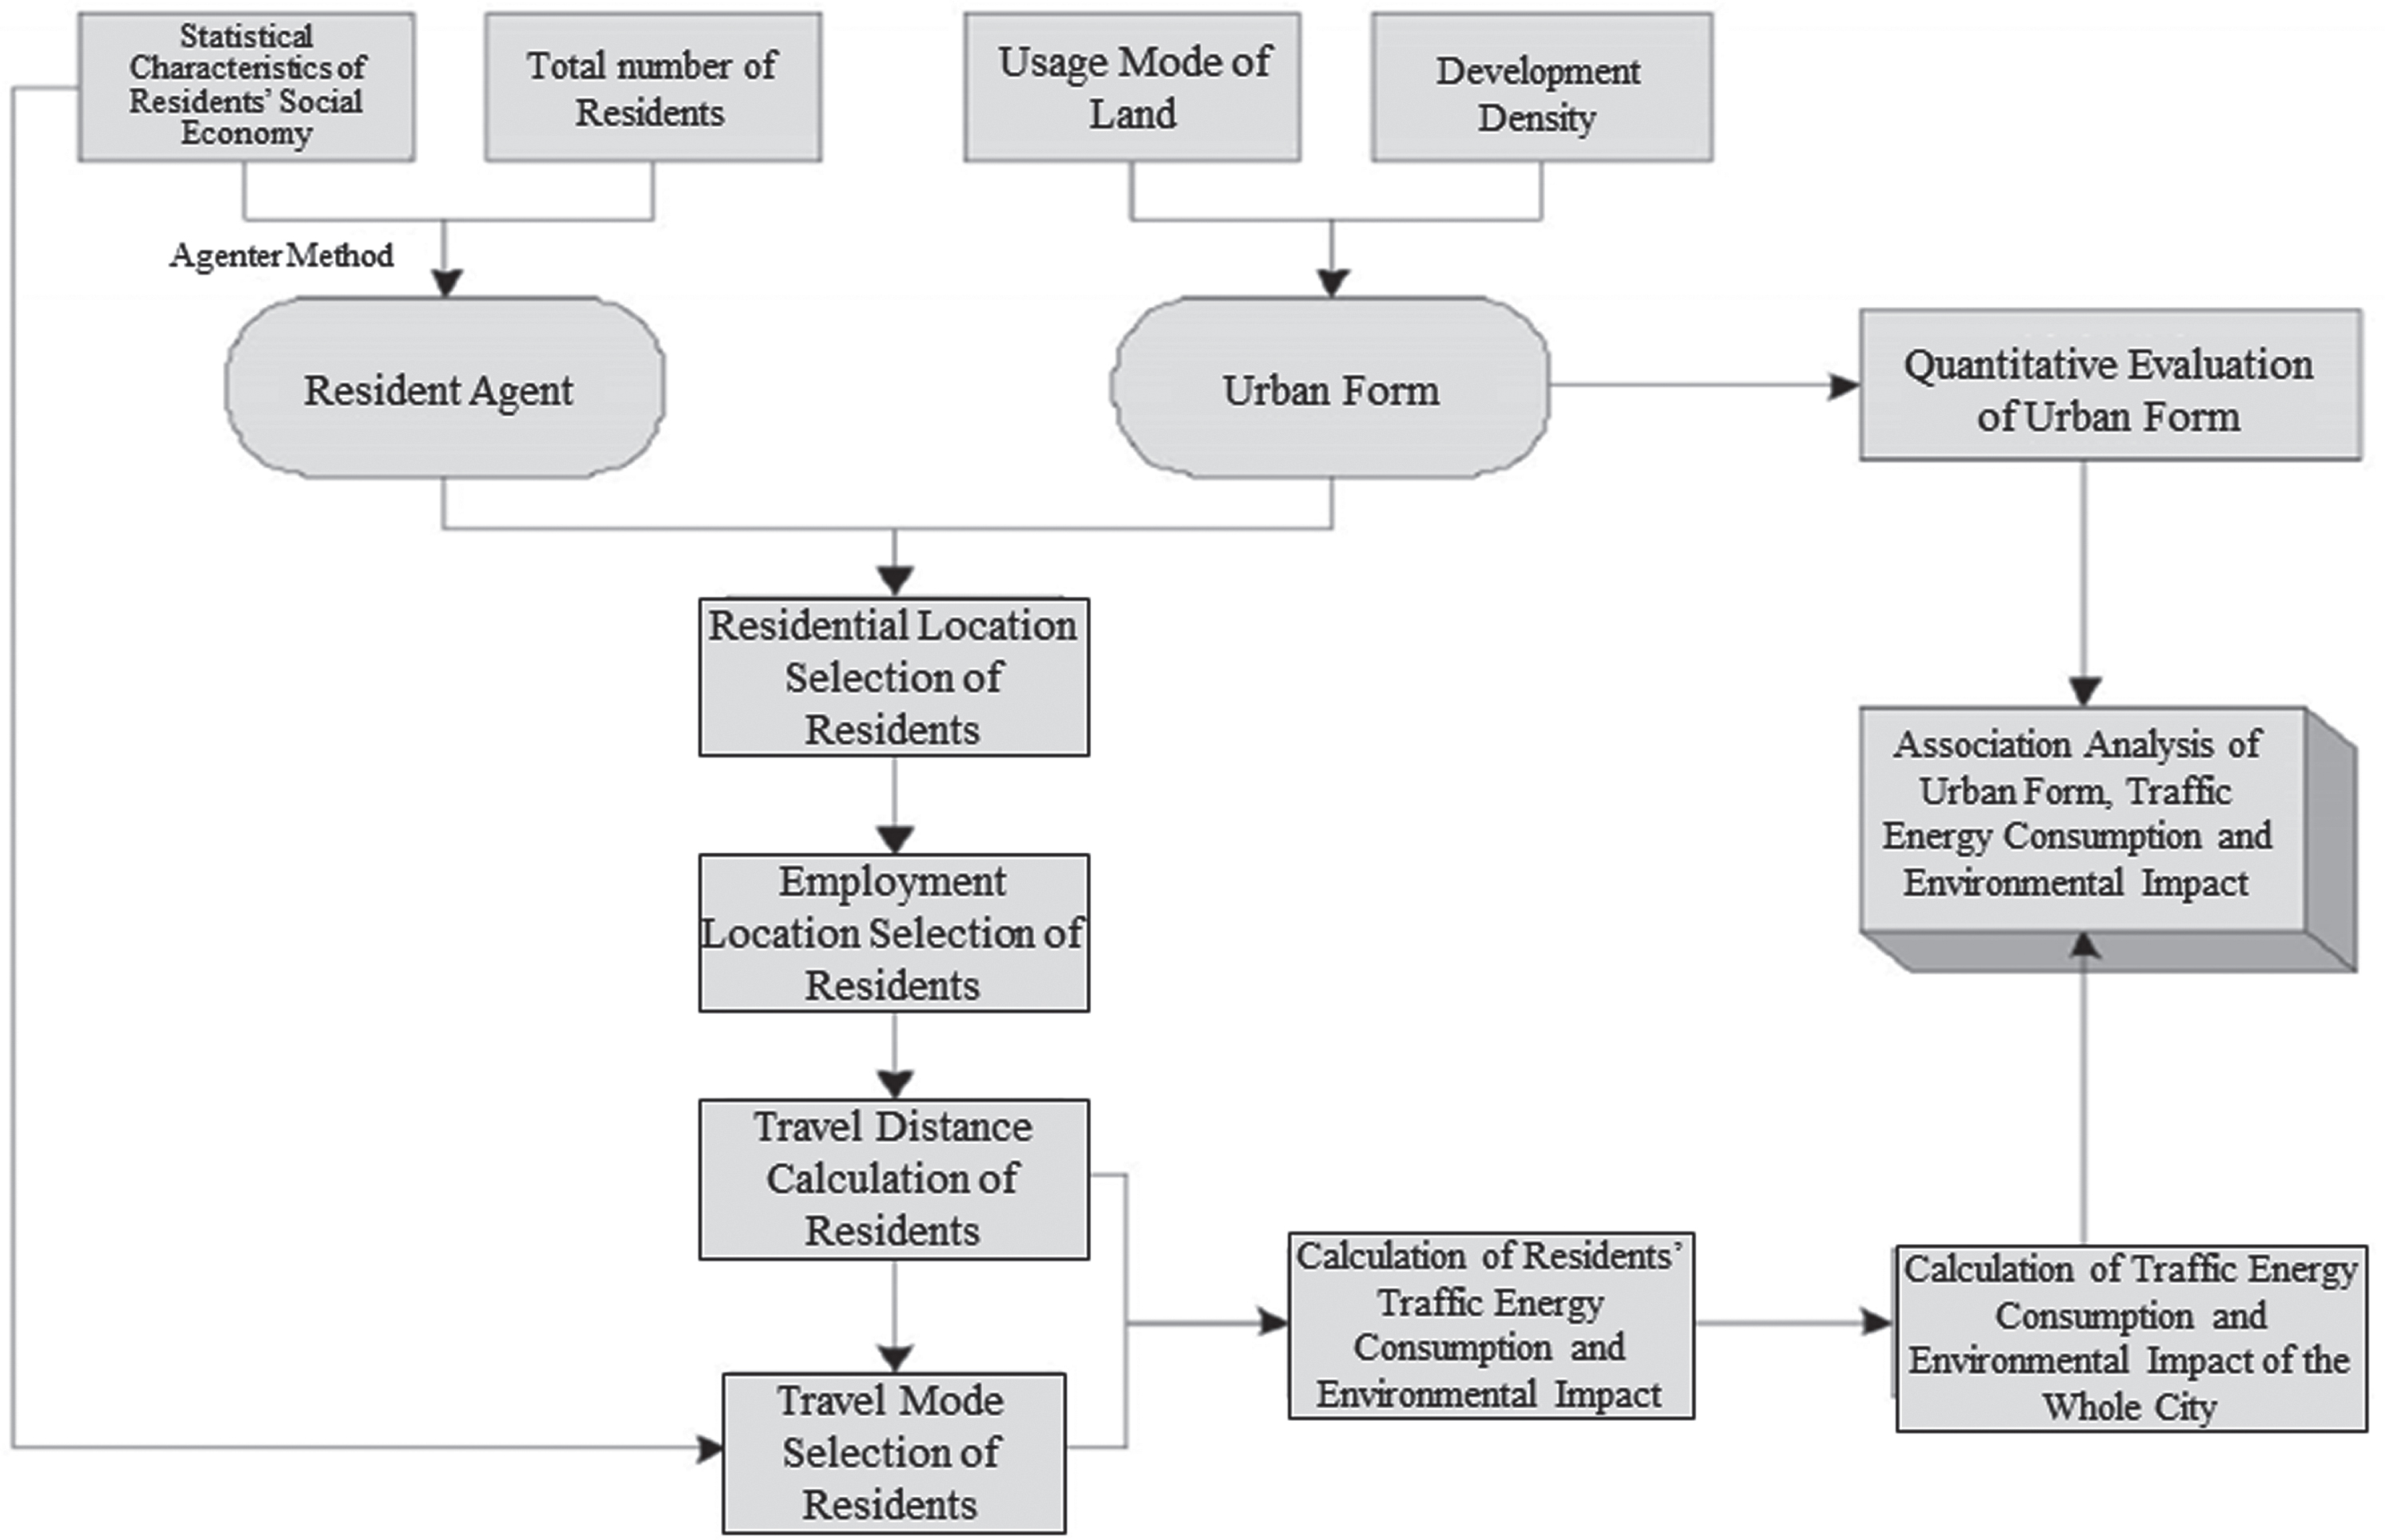
Simulated flow diagram of FEE-MAS model.
Traffic source algorithm
The calculation of road traffic noise is based on the line source model, and the ground absorption and the additional attenuation of obstacles during the noise propagation shall also be considered at the same time. The equivalent sound level of the point with a distance of r from the traffic lane is described as [19]:
Where:
The actual traffic stream on the lane is a combination of large, medium and small vehicles, and the grade of road traffic noise is the superposition of the equivalent sound levels of the three kinds of traffic streams, i.e.:
(1) Convex hull algorithm
The noise attenuation caused by building is calculated through the convex hull algorithm. Considering the 3-way diffraction in 2.5-dimensional space, all contour points of the building are connected according to a certain algorithm to form a convex hull, and then three shortest diffraction paths will be formed between the sound source and the receiving point: two diffraction paths at the left and right of the plane convex hull, and one diffraction path on the convex hull formed by the height of each building. The diffraction attenuation of acoustic wave is calculated by the following formula:
Where: N represents the Fresnel number,
After calculating the Fresnel number of three diffraction paths:
(2) ISO Algorithm
The international standard of ISO9613 is used to calculate the noise attenuation:
B –Building density: building area/ total area
d b –Length of sound path through the building group
p – The percentage of the front length of a building adjacent to a highway or railroad to the length of highway or railroad (no more than 90%).
Experimental subject
Guangzhou Inner Ring Road has a total length of 26.7 km, with two-way six lanes. Since the completion and opening to traffic of the Inner Ring Road in January 2000, the traffic in the central area of Guangzhou has been significantly improved, but it has also brought great traffic noise impact to the environment along the line. In order to understand the noise impact of the Inner Ring Road on the environment along the line, the Inner Ring Road is set as the center line, and the buildings within 200 m along the line are selected; the traffic flow data of Inner Ring Road are obtained by the video of the camera on the Inner Ring Road through the cooperation with Guangzhou Traffic Committee; and the vehicle speed data can be obtained from the data of more than 20,000 floating cars on the roads of Guangzhou. Taking 10 m as the grid spacing, traffic noise is calculated by software and the noise map is rendered, as shown in Fig. 2.
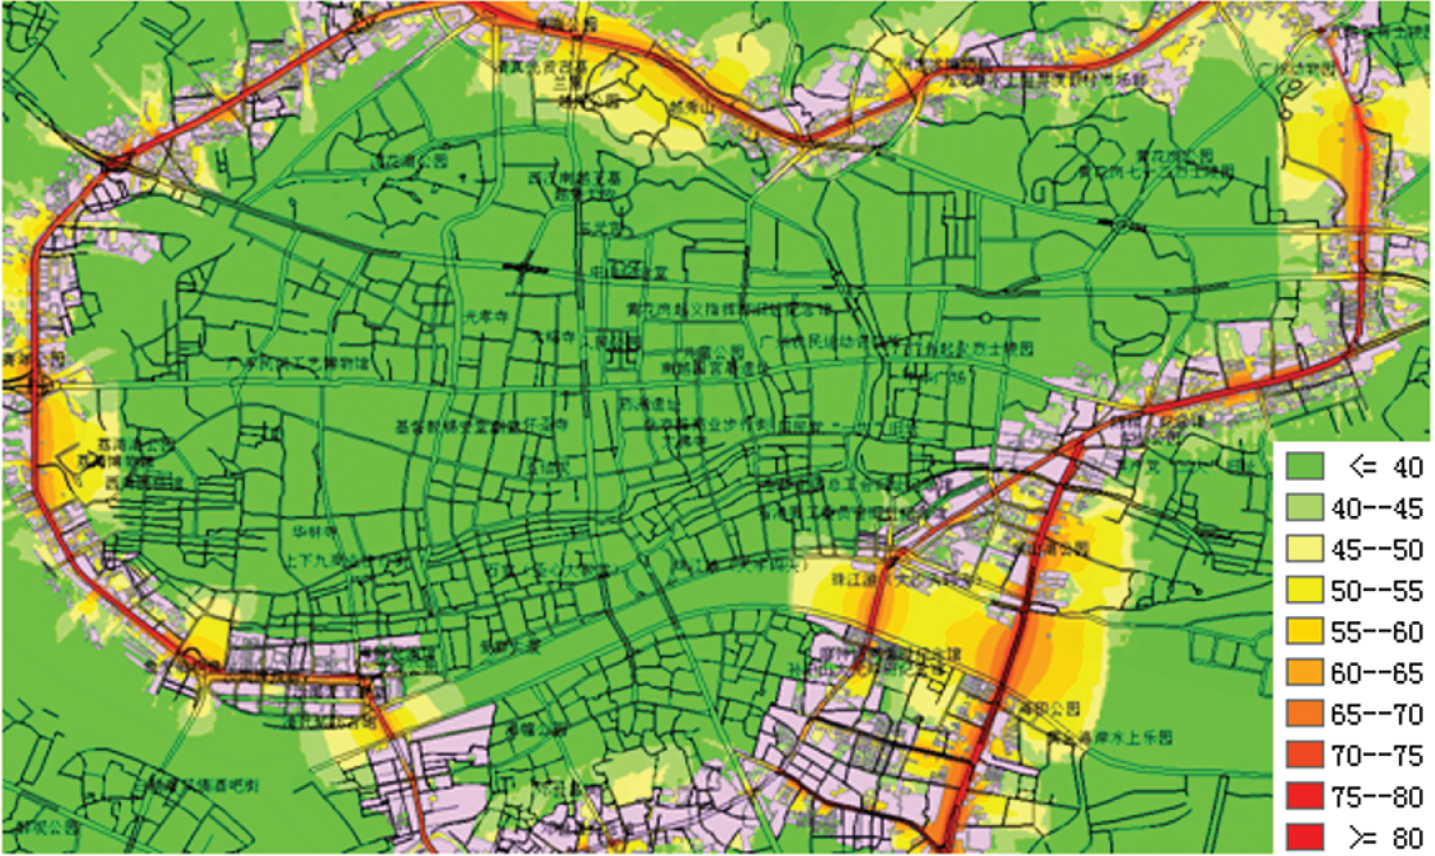
Traffic noise map of Guangzhou Inner Ring Road.
The taxi trajectory records the precise spatio-temporal information of each taxi individual. At present, the author is cooperating with Microsoft Research Asia to evaluate the urban function with the TAZ scale by using the taxi trajectory data and point of interest (POI) data of Guangzhou Inner Ring Road (the preliminary results are shown in Fig. 3), and plans to integrate bus card data with taxi trajectory data to achieve a more complete evaluation of urban function [20–22]. The expected evaluation result is that each TAZ can identify the proportion of various urban functions, such as living, employment and shopping, and then evaluate the mixed use level of each zone, which is a supplement to the traditional method of evaluating the mixed use level of land based on land use data.

Dominant function of each TAZ in Guangzhou Inner Ring Road (preliminary results).
Guangzhou Inner Ring Road is a rapidly developing area in Guangzhou, and its acoustic environment is also of concern. Based on the basic data obtained from the traffic survey of this group, the traffic noise map of Guangzhou Inner Ring Road area is calculated and drawn by software, as shown in Fig. 4.

Noise distribution map of Guangzhou Inner Ring Road.
A field noise survey is conducted in the area of Guangzhou Inner Ring Road, and the calculation results are tested. For the software calculations in this area, the maximum error is 2.09 dB, the minimum error is 0.55 dB, and the average relative error is 1.9559%, which can be seen in Fig. 5.

Error analysis.
The built refined Urban Model is expected to have the following applications in real cities: (1) support the evaluation of spatial planning schemes: unlike the planning evaluation of macro-model, refined Urban Model can identify the reflection of urban activity subjects on planning policy from micro-level (such as land blocks and families), then evaluate the planning schemes such as the rationality of land use layout and development intensity and the traffic impact of planning schemes, and conduct the evaluation for the environmental impact and other aspects combined with professional model. Besides, during the prepration of planning, it is expected to give a more reasonable planning scheme through the scientific evaluation of various plans. (2) Support the site selection and evaluation of major projects or infrastructure: for urban renewal, public service facilities, municipal infrastructure or transportation infrastructure projects, the evaluation is carried out on the scale of land space through the influence of the above-mentioned projects (such as changing the selection process of residential and enterprise locations by influencing the accessibility) on the main bodies of urban activities, and the evaluation conclusions and project location recommendations are given.