
Abstract
Welding is an important method for modern material processing. In actual processing, due to the influence of processing accuracy and welding thermal deformation, various defects often appear in the appearance of the weld. At present, visual inspection is mainly used for the appearance inspection of welds. The detection of weld defects mainly depends on the work experience of the staff. Based on the above background, the purpose of this article is to visually inspect the weld surface quality. This article uses visually obtained fringe images of weld contours as information sources to explore a visual-based weld appearance detection algorithm, including the measurement of weld formation dimensions and the detection of weld appearance defects. This algorithm overcomes manual measurements of the misjudgments and omissions caused by eye fatigue and experience differences. It improves the efficiency and accuracy of welding appearance inspection, and meets the needs of automation and intelligence of the entire welding process. In this paper, a subpixel stripe centerline extraction algorithm based on the combination of the Hessian matrix method and the center of gravity method is used; to further improve the accuracy of the extraction of the centerline of the weld seam, this article also performs the work of removing the wrong points and the compensation of the broken seam. Obtain a fringe centerline with better connectivity. Comparing the extraction algorithms of each centerline, the centerline obtained by this method has high accuracy, less time-consuming and high stability. It laid the foundation for the subsequent inspection of weld appearance. Through the training of the model, the accurate classification and recognition of surface defects of tube and plate welds have been achieved. The experimental results show that the improved vision-based welding surface defect recognition and classification proposed in this paper has better performance and accuracy. Up to 96.34%.
Keywords
Introduction
Welding is one of the most important processing methods used in manufacturing. Whether in machinery manufacturing, aerospace, water conservancy and hydropower, marine drilling, or shipbuilding, electronic technology and other fields, welding is a very critical process. Nowadays, in the automatic tracking and welding of welding seams, the automation and intelligence of robot welding have been greatly improved, but the automation of welding quality inspection needs to be further strengthened. Traditional welding quality inspection, mainly including welding seam size measurement and surface defect detection, is completed by workers’ measurement and inspection, so relying entirely on manual methods is time-consuming and inefficient. With the rapid development of the manufacturing industry [1], with the sharp increase in the number of welded products, the complexity of the product structure is getting higher and higher, and the requirements for how to test the welding quality are becoming more and more demanding, and now the labor cost is increasing. Therefore, simply relying on workers to perform welding quality inspection can no longer meet the requirements of modern welding technology. It can be seen from this that how to realize automatic detection of weld quality is of great practical significance.
At present, the appearance inspection of welds is mainly realized by the inspectors with the aid of gauges, rulers, magnifying glasses, etc. This method has many disadvantages: long detection time, tool wear, small detection range, low accuracy [2]. Therefore, the research on the post-weld appearance inspection of welds is of great significance to the improvement of welding automation and intelligence [3, 4]. Computer vision inspection technology has high sensitivity, a large amount of information, strong anti-interference ability, and no contact with the workpiece. It is widely used in product inspection. Among them, structured light vision sensing system is the most widely used method [5]. Therefore, it is a feasible way to apply this technique to the appearance quality inspection of welds. Obtaining geometric information through visual sensing, studying the relationship between morphological characteristics and welding quality, and adjusting the welding process to achieve closed-loop control of welding quality have become important research directions in welding sensing in recent years [6, 7]. At present, there have been more in-depth studies on obtaining two-dimensional information about welding, but there is a lack of information closely related to welding forming such as height. Therefore, the research on 3D reconstruction of welds to obtain more information is also an important research direction [8, 9].
Based on the measurement of weld formation geometry in most welding situations today, this paper establishes a weld formation geometry measurement system based on structured light+CCD camera active vision mode, which can complete the characterization of weld formation. And processing of structured light images of different sizes. For the extraction of structured light features in structured light image processing, an extraction method that combines the Hessian matrix method and the centroid method is proposed. At the same time, an improved RANSAC algorithm is designed to fit the structured light. The step method is used to extract feature points of structured light. Aiming at the problems of poor stability of the image processing algorithm for the extraction of weld surface defects and the limitation of the application site, this paper will develop a deep surface defect recognition algorithm based on deep learning. This algorithm does not need to perform image processing on the image containing weld defects, and uses deep learning to directly obtain its high-level features to complete the accurate classification and recognition of defects.
The first chapter is an overview, which briefly introduces the background and research significance of this article, then summarizes the current status of welding quality inspection technology at home and abroad, and finally puts forward the research goals, main content and difficulties of this article. The second chapter introduces the software and hardware components of the vision-based weld quality inspection system, and calibrates the camera and structured light. The third chapter is the experiment, which introduces the experimental data source and data type in detail, and informs the experimental environment where the experiment is located and the steps that need to be performed. The fourth chapter is the experimental analysis, which expands the experimental examples, and introduces the experimental content, experimental process, and experimental details. The fifth chapter analyzes and summarizes. This chapter mainly analyzes and summarizes the experiments.
Proposed Visual Inspection
Related work
Due to the importance of welding surface quality inspection research, many research teams have begun to conduct research on welding surface quality inspection and have achieved good results. Friction stir welding is an innovative joining technology that is particularly suitable for aluminum alloys. Various studies have shown that weld quality is heavily dependent on welding speed and tool rotation speed. In general, the improper setting of these parameters can be detected by visual inspection of the resulting surface defects, such as increased flash formation, surface wear, or irregular formation of surface arc texture. Visual inspection of these defects is usually performed manually, which increases costs and increases personnel workload. Hartl introduced a method to automatically detect irregularities and features on the surface of a weld. It is based on three-dimensional shape detection of surface features using a structured light projection. For this purpose, butt welded configuration measurements were performed on EN AW-5754-H111 plates. Evaluate the data and derive key structural features of the weld surface. The results show that the welding irregularity can be automatically detected by evaluating the weld morphology. These results are the basis for the future development of on-line quality monitoring and parameter control methods for friction stir welding [10]. Welding inspections are a frequent topic in non-destructive testing due to the potential safety and environmental impacts associated with poor welding quality. Thick-walled, multipass welds are very common in construction, bridge construction, shipbuilding, pressure vessels and many other industries. Sebastian proposes a novel technology that can perform process and quality control on partially completed welds after each weld pass, which can save a lot of time and money. This technology uses an electromagnetic acoustic transducer (EMAT) to generate surface acoustic waves, which can detect defects in the top layer of the weld in multiple passes. Sebastian introduced the theoretical and empirical verification of welds with 100 mm thick base metal for partial finishing [11, 12]. Dheeraj proposed a novel method to detect and analyze visual anomalies on challenging surfaces (metals). This method is based on local evaluation of reflectance conversion imaging data, that is, the reflectance of the entire inspection surface is evaluated: the reflectance conversion imaging data is a set of brightness images captured by a fixed camera while changing the position of light space. The reflectance of each pixel is modeled by projecting the measured brightness onto a geometric function, in this case discrete mode decomposition (DMD). However, reliable detection and analysis of visual anomalies on the surface requires that the method is not affected by both the geometry (sensor and surface orientation) nor the direction of the texture pattern of the inspected surface. Therefore, Dheeraj introduced a rotation-invariant representation on the DMD, from which they designed a significant map representing local differences in reflectivity. The methodology was tested on different engineering metal samples that exhibited several types of defects. Compared with other saliency assessments, Dheeraj’s methodological results demonstrate the best performance in anomaly detection, localization, and analysis [13, 14].
Design of the visual inspection system
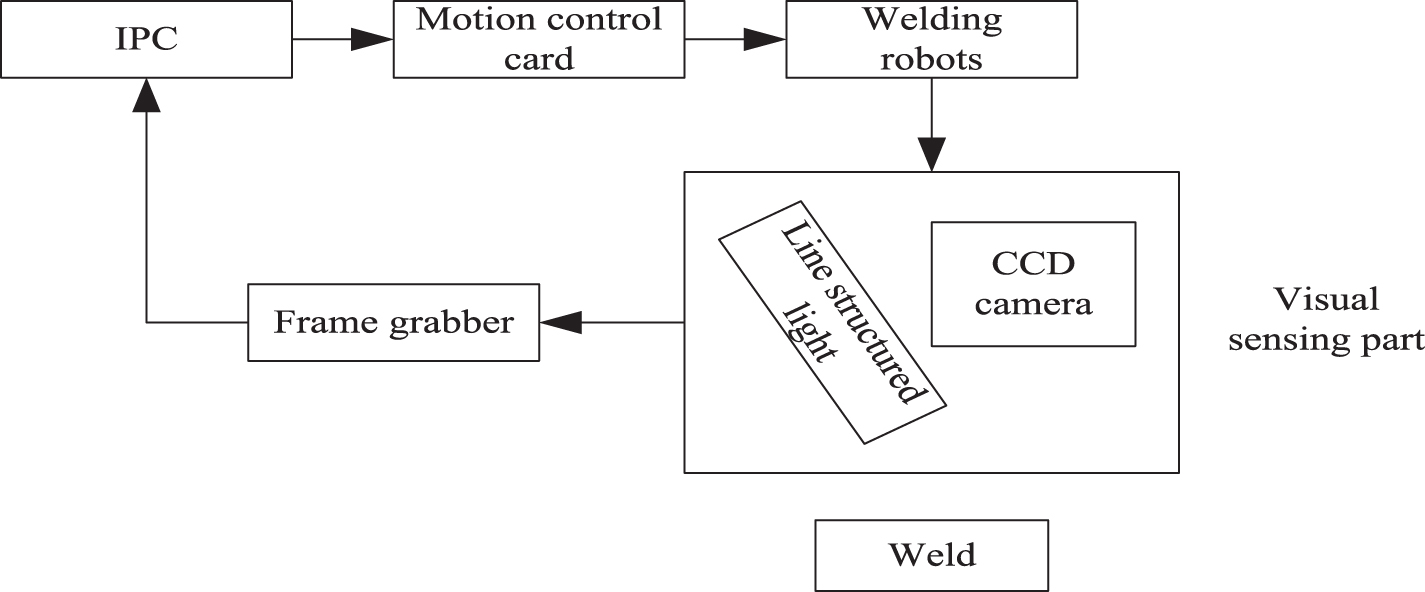
The welding quality visual inspection system mainly includes two parts: the hardware system and software system. Due to the relatively harsh environment of the welding site in industrial applications, and a large number of arc, smoke, and splash-specific interferences during the welding process, to better solve these unique interferences, For this particular imaging environment, hardware components such as industrial computers, frame grabbers, CCD cameras, lenses, laser emitters, filters and light sources need to be selected purposefully. Based on the selected hardware, the hardware system of the weld quality inspection system is realized. The overall system of the weld quality inspection system is shown in Fig. 1. Under the premise of the hardware system, to achieve the real-time acquisition, display, storage, and subsequent image processing requirements of the weld appearance image, this article is developed based on the VisualC++development platform by calling OpenCV open-source vision library functions a software system for measuring the appearance dimensions of flaws, detecting defects and identifying them[15–17].
The overall structure of a weld quality inspection robot.
Due to the harshness and complexity of the welding environment in industrial applications, the inspection of the appearance quality of the weld needs to select the most suitable hardware according to the actual application, so that the acquired image quality is better and the subsequent algorithms are more simple and stable. The hardware components of the vision system are described in detail below.
(1) To make the visual inspection system design and efficient and fast operation, at the same time to be able to be compatible with the image acquisition card and the speed requirements for subsequent image processing and operation, a computer with corresponding configuration must be selected for the entire vision system Perform central control. The industrial computer used in this article’s vision system is Advantech’s industrial computer. The biggest advantage of this industrial computer is that it can achieve perfect compatibility with the frame grabber, and at the same time, the CPU and 8 G memory of the I7-6700 meet the vision software system designed in this article. Image processing speed [18–20].
(2) Image capture card is also called image capture card, its main task is to: transfer the captured image signal to a computer, and then convert the captured image signal into a data file format, and to your computer’s hard drive. The image acquisition card is the biggest prerequisite for the quality inspection of the weld. Only the images about the weld can be collected to carry out all subsequent operations, so choosing the appropriate image acquisition card is a key step in this article.
(3) CCD camera and industrial lens
A CCD camera, also known as a Charge Coupled Device, is essentially a semiconductor imaging device. CCD cameras have some advantages that other types of cameras do not have, such as: relatively small in appearance, which makes it easy to carry and takes up less space, and most importantly, it has high sensitivity, strong light resistance, and small distortion, Long life, anti-vibration, and other characteristics, these unique characteristics make the CCD camera suitable for industrial fields. The CCD camera is the most important part of the entire visual inspection system. The size and volume of the CCD camera determine the volume of the entire visual sensor. The performance of the CCD camera also has a decisive influence on the quality of the weld image collected, which affects the subsequent image processing algorithms design.
(4) Laser transmitter
Because in the actual industrial environment, the welding process is very complicated, and a large amount of smoke, dust, and splashes will be generated. These interferences will cause various noises in the captured image to cause the quality of the final image to be poor, which will give later the image processing caused great difficulties, making it impossible to complete the measurement of the appearance of the weld. To avoid such problems, generally speaking about the measurement of three-dimensional dimensions, machine vision will complete the three-dimensional measurement of objects with the help of structured light. The principle of structured light-based measurement technology is based on the measurement principle of optical triangulation. In this principle, three-dimensional information of an object can be measured by structured light. Therefore, in the geometric dimension measurement part of the weld formation, this paper uses the form of structured light+machine vision to complete the measurement of the weld formation. Therefore, how to choose the wavelength and power of the laser is very important for the vision system. The appearance of the laser emitter used in this article is shown in Fig. 2.4. The structured light emitted by this laser transmitter has a wavelength of 650 nm and a maximum output power of 50mW, which can fully meet the requirements of the measurement system. Besides, the operating temperature range of the laser transmitter is –10°C 40°C, which can work in a welding environment [21–23].
(5) Filter
Even when the gain of the CCD camera is relatively small when using the structured light form, the brightness of arc light, smoke, or splashes generated during the welding process is sometimes high, causing them to appear in the collected images. Therefore, to minimize these interferences, it is necessary to add an optical filter in front of the lens of the CCD camera to reduce the impact of these interferences. The main function of the optical filter is to select the appropriate wavelength of light to enter the CCD camera, while the light of inappropriate wavelength is not allowed to enter the CCD camera. Generally, the optical filter and the laser emitter are matched. The wavelength of the structured light emitted by the laser filter is also the wavelength of the light that the optical filter can transmit. The wavelength range of the laser emitter used in this article is 650±10 nm, so the center wavelength of the optical filter that can be selected is 650 nm [24, 25].
Software platform of vision system
The vision software platform of this paper is based on the VisualC++6.0 development environment, and develops a weld quality detection software system by calling the OpenCV vision library function.
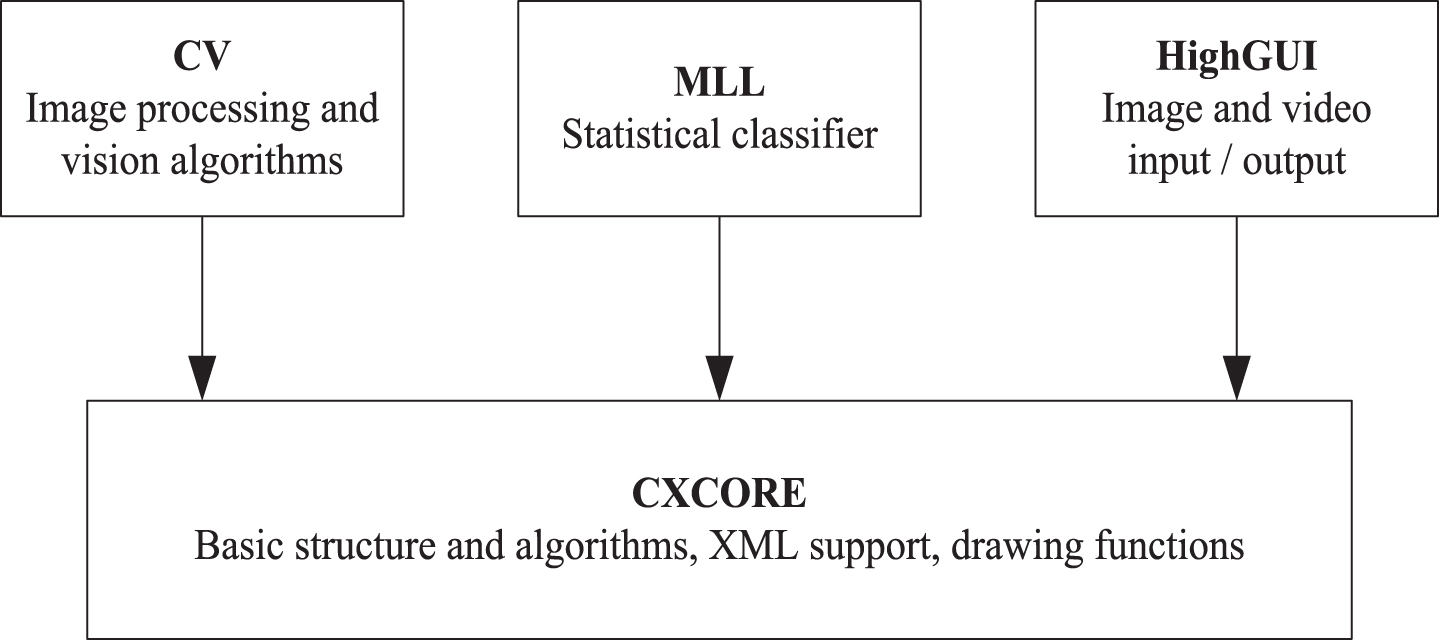
OpenCV, called Open Source Computer Vision Library, is an open-source computer vision library and machine learning software library that is completely open to users. It provides a common basic framework for the application of computer vision. In OpenCV’s entire vision library, more than 500 functions are included. These functions are applied to many fields, such as product inspection, medical image inspection, information security, user interface, camera calibration, stereo vision, and so on. The four modules in the OpenCV framework are shown in Fig. 2. Among them, the module CV mainly contains some basic image processing algorithms and more advanced computer vision algorithms. MLL is the module and the machine learning library, which mainly completes the pattern. Identification and clustering statistical problems; the HighGUI module mainly contains the basic functions for image and video input and output, and some basic data structures and related algorithms in OpenCV are included in the CXCORE module. The commonly used image processing functions come from the module CV, which will be introduced later in the relevant functions.
The basic structure of OpenCV.
After acquiring the weld image, how to convert the image coordinates in the image coordinate system of the structured light fringe into the camera coordinates and the coordinates based on the robot base coordinate system is a problem that must be solved. The vision system calibration in this paper includes three parts: camera calibration, line structured light plane calibration and hand-eye calibration. Camera calibration includes two parts: calibration of internal parameters and calibration of external parameters; calibration of internal parameters mainly refers to the calibration of the focal length and the center point of the camera; calibration of external parameters refers to the conversion relationship between the camera coordinate system and the world coordinate system.
Assuming a coordinate system o-xyz in the world coordinate system, R is a third-order orthogonal unit matrix, and t is a three-dimensional translation vector, the point (x1, y1, z1) in the coordinate system o-xyz to the world coordinate system Ow-XwYwZw has the following conversion relationships:
The image pixel coordinate system usually uses the upper left corner of the image as the origin and is denoted as O0, and the coordinate points are represented by coordinates (u, v); the points in the image plane coordinate system are represented by (x, y), and the unit is mm.
The calibration of the camera is the process of calculating the internal and external parameters of the camera. The internal parameters mainly refer to the internal parameters of the camera, such as the focal length and distortion coefficient. The external parameters refer to the relationship between the camera’s image coordinate system and the world coordinate system. Rotation transformation matrix and movement matrix. A plane template filled with accurate dot matrix was used to capture multiple photos in different directions. After extracting the feature points, the homography matrix of each image was used to solve the camera parameters. The plane template calibration method has high accuracy, good robustness and simple template making. It is generally assumed that the Z coordinate of the template in the world coordinate system is 0, and the i-th column of the rotation matrix R is r
i
.
A given homography matrix has two constraints on camera internal parameters, because this matrix has eight degrees of freedom, three rotation matrices, and three translation vectors. The camera calibration results include the camera’s internal parameters, external parameters, and distortion coefficients. External parameters will be used for online structured light plane calibration and hand-eye calibration. The internal parameters, distortion coefficient and pixel error of the camera are shown in Table 1.
Camera calibration results
At present, there are two types of calibration of line structured light planes: one is to obtain the line structured light plane after calibration with a camera and use multiple feature points; the other is to calibrate the entire system to obtain more than four feature points. The transformation relationship between the three-dimensional image coordinates and the three-dimensional space coordinates, to obtain the transformation parameters.
Camera calibration and line structured light plane calibration realize the conversion relationship between the image coordinate system and the camera coordinate system, while hand-eye calibration realizes the correspondence between the camera coordinate system and the robot end. The purpose is to realize that the welding seam information can be perceived by the welding robot, because when shooting structured light stripes, the end effector of the welding robot walks along the x axis of the base coordinate system, so that the camera can collect the entire welding seam. In the 3D reconstruction of the welding seam, the visualization of the welding seam needs to be completed according to its coordinate relationship.
Measurement of experimental weld forming dimensions
Weld formation size is a primary and very important parameter to characterize the shape of the weld. The quality of the weld formation can be judged by measuring the weld formation size. After consulting a lot of literature and actual welding quality inspection, the geometric dimensions that characterize the weld formation quality include weld width, length, residual height, undercut, Wrong side, etc. Weld width refers to the distance between two points where the weld and the base metal intersect; The definition of the remaining height is the maximum height of the weld formed on the base metal; Undercuts refer to depressions or grooves at the edges of the weld below the base metal surface after welding, and undercuts may appear on either side of the weld; The wrong side is that the plates are not aligned according to the center, which causes the deviation of the two parallel centerlines.
Due to the limitation of objective factors, there are many imperfections in the measurement of the weld seam forming dimension. The “JBT7949-1997 steel structure weld seam outline dimension” stipulates the following outline of the steel structure weld seam. The difference between the maximum width and the minimum width of the weld shall not be greater than 4 mm within any 50 mm weld length range, and shall not be greater than 5 mm within the entire weld length range; The straightness f of the edge of the weld, the straightness f of the edge of the weld along the axis of the weld within any 300 mm contact length; The surface of the weld is concave and convex. The difference between the maximum remaining height and the minimum remaining height of the weld shall not be greater than 2 mm within an arbitrary 25 mm length of the weld.
Experimental image preprocessing
In the process of image acquisition by CCD camera, there are some noise points in the collected structured light image due to the influence of splash, smoke and so on during industrial welding. They are disorderly distributed in the image, and some are even distributed in structured light stripes, which will set obstacles for the correct extraction of structured light stripes in the future. So the first thing to do is to filter and denoise the image. The main energy of an image is distributed in the low-frequency band, but the high frequency of the image is distributed with most of the noise. For structured light images, the streak energy of structured light is also mainly distributed in the high-frequency band, so the biggest difficulty for filtering and denoising of the structured light image is how to remove the high-frequency noise while retaining the structured light to the greatest extent. Details of the stripes.
The main problems solved by the structured light image processing algorithm include three aspects: (1) the image preprocessing part, whose main function is to filter and denoise the original light of the structured light to reduce the impact of noise points on subsequent image processing; (2) The centerline extraction of structured light fringe is mainly to ensure the accuracy of structured light extraction, to ensure the accuracy of the final welding seam forming geometry measurement; (3) Feature point extraction, the main purpose is to be used for the calculation of the welding seam forming geometry size The feature points are extracted and identified to obtain the weld forming size and the existing dimensional defects. To achieve the above purpose, the flowchart of the algorithm for image processing of structured light stripes is shown in Fig. 3.
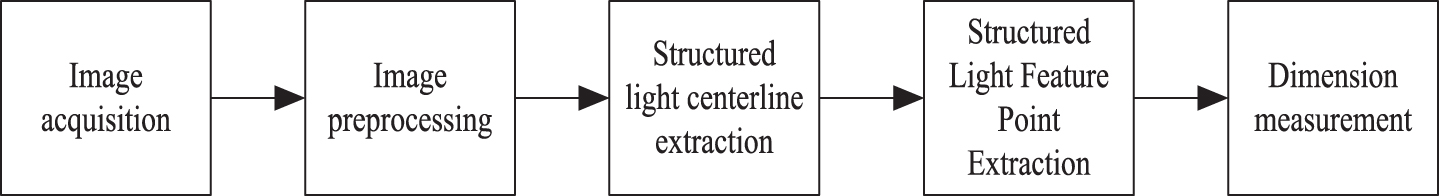
Structured light image processing algorithm flowchart.
In addition to measuring the geometric parameters of the weld formation, the visual inspection system proposed in this paper can also realize 3D reconstruction of the weld surface. To realize the three-dimensional reconstruction of the weld surface, it is necessary to perform a three-dimensional coordinate conversion on each white pixel point on the centerline of the structured light fringe obtained each time. When the entire weld detection is completed, the three-dimensional information of the weld will be obtained. The 3D information reconstruction of the weld surface can provide workers with real-time monitoring and real-time feedback on the formation of the weld. The actual weld seam for the weld size detection is shown in Fig. 4. This weld seam was obtained from two pieces of carbon steel of equal thickness through TIG. It can be seen from the figure that the geometric dimension of the weld at the beginning is still relatively uniform, and then the width of the weld becomes smaller in area 1, and the similar trend of the remaining height also appears. After being in area 1, the weld width and remaining height slowly returned to normal, until the area 2 began to show a smaller geometric size, and then returned to normal, and so on.

Actual weld formation.
After the weld forming size is obtained, the weld forming size is displayed in real-time here. The obtained records of the welding width, remaining height and staggered parameters can provide a basis for the subsequent analysis of the weld forming size. If the value of the geometric parameter is within this range, it indicates that the welding size is good. If the value of the geometric parameter is not within this range, it indicates that the welding dimension is too far away from the ideal size, which will cause problems in the quality of the weld. Reminders for real-time adjustments.
The image coordinates of the contour of the weld seam are converted into the coordinates of the robot end-effector coordinate system through the parameters obtained by camera calibration and line structure cursor calibration in Chapter 2. And during the walking of the end effector of the welding robot, the measurement results of the welding seam forming size are displayed in real-time. The change trend of the width of the weld and the change trend of the remaining height of the weld is shown in Fig. 5. It provides a basis for the appearance inspection of the weld. The two red lines in the figure indicate the valid range allowed by the welding width of the remaining height. If this range is too large, it means that the welding forming size is too far away from the ideal size. This system can alarm and remind and adjust the welding current, voltage, speed and other parameters in real-time.

Trend of weld width and weld height.
To verify the performance of weld formation dimension measurement, the accuracy, speed and stability of the system need to be verified. Verification inaccuracy; mainly using vernier calipers as a standard detection experiment tool, and using a fixed-width value as the actual accuracy value as the evaluation of the accuracy of visual inspection. At the same time, it is obtained from the experiment that the maximum error for measuring a distance of 20 mm on the vernier caliper is only 0.067 mm, which fully meets the requirements of industrial welding. In terms of measurement speed, due to the low efficiency of the manual detection currently used, the time is 25 s, and the detection method proposed in this paper takes less than 0.7 s. This greatly improves the efficiency of welding seam forming dimension measurement and greatly reduces the labor intensity of workers.
After verifying the accuracy and stability of the vision measurement system, the accuracy of the system is checked. Here, the welded shape measured by this system is compared with the manually measured size. The principle of comparison is to perform various size measurements on the same position of the weld, and the measurement data is shown in Table 2.
Comparison of weld measurement dimensions
It can be concluded from Table 2: that the number of types of welds that can be measured by the visual measurement system is far more than the types of manual measurements, and it is much more accurate than manual measurements, which makes the entire weld size measurement Guaranteed in terms of accuracy. Moreover, the time required for the vision system during the measurement process is short, the longest time is only 0.487 s, and the time required for manual measurement is much longer, which makes the vision measurement system have greatly improved its efficiency.
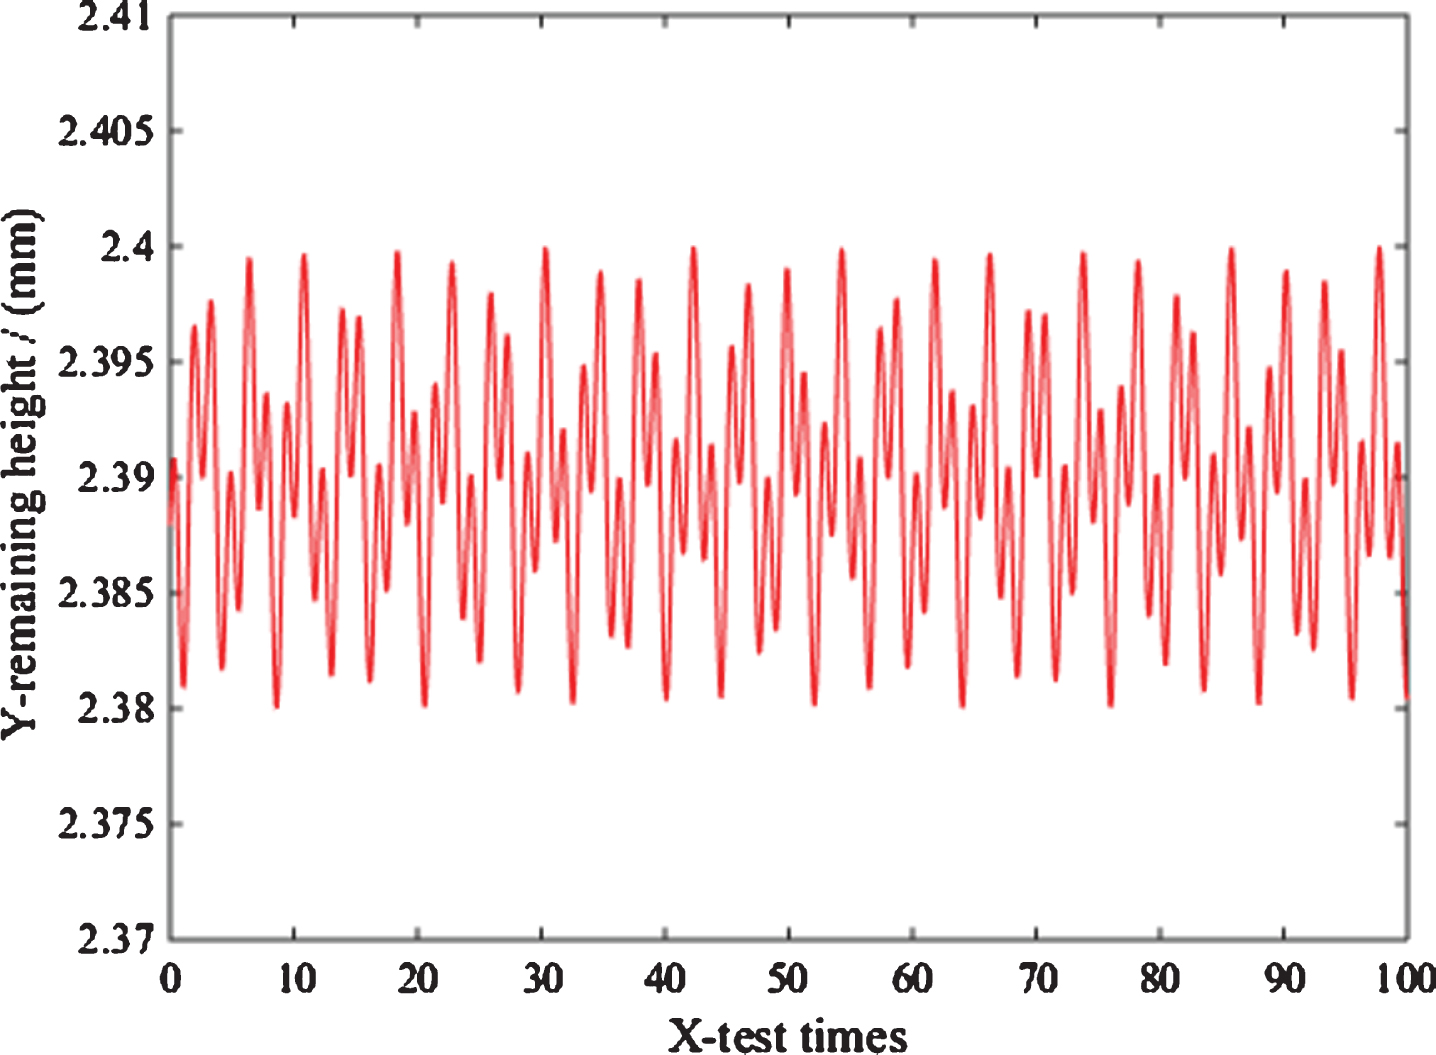
For the stability of the system, repeated measurement of the remaining height of the weld at a certain position in the weld is performed here, and the change trend is observed to verify. The measured remaining height of the weld is shown in Fig. 6.
Stability test results.
It can be seen from Fig. 6 that after 100 consecutive measurements of the same position of the weld seam, the weld seam height continuously changes within a certain range, but the scale of change is relatively small, the maximum does not exceed 0.05 mm, which is converted into pixel points. If there is only one-pixel fluctuation, the stability of this system is also relatively good.
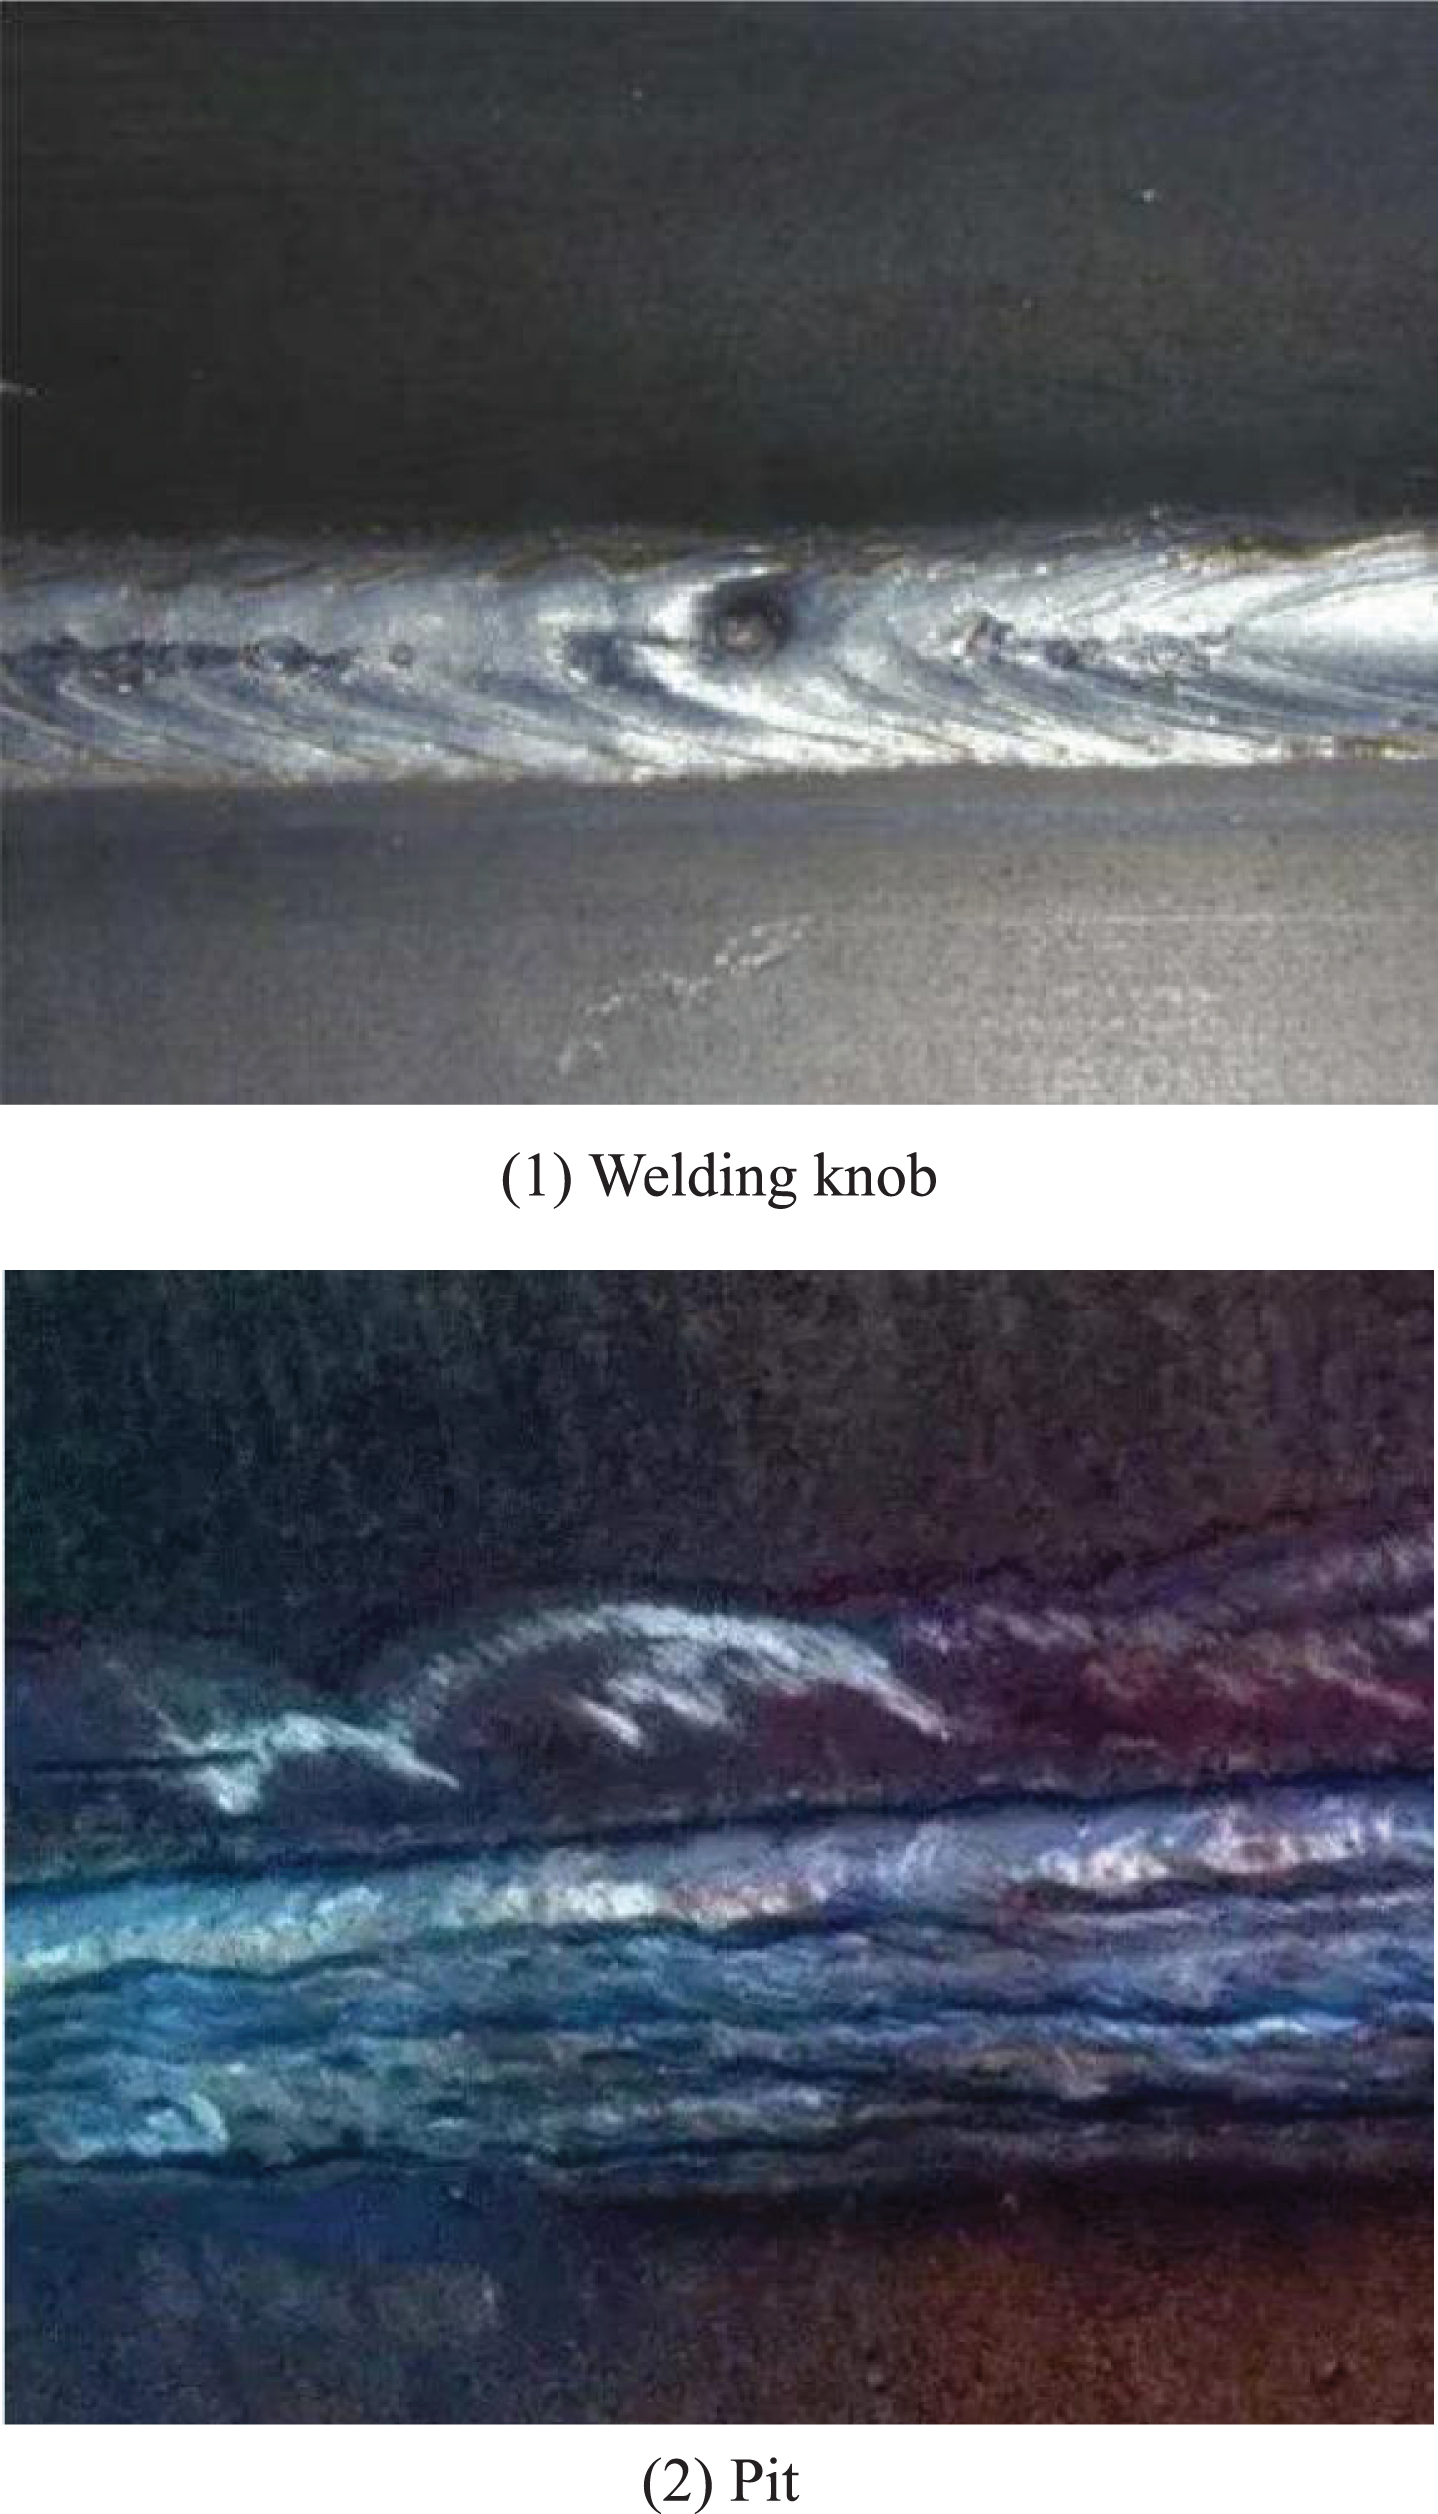
During the welding process, due to environmental interference and changes in welding current, voltage, speed and other parameters, different types of surface defects will appear on the surface after welding. Common defects such as welding knobs, pits, pores, and slag inclusions are shown in Fig. 7:
Weld surface defect map.
(1) Welding knob
Welding lump refers to the local high temperature melting of metal solder joints caused by current during the welding process of metal objects. When the liquid metal solidifies, the metal flows under the action of its weight to form a tiny maggot. It will reduce the strength of the welded product and reduce its effective cross-section.
(2) Pit
The pit refers to the part of the weld surface that is lower than the base metal, and the starting and ending positions of the weld often appear. Defects in the pits can make the weld look unsightly and the quality of the final welded product substandard.
To visualize and display the measurement results of the weld after the measurement of the weld forming size, the collected weld centerline is used to filter the weld point cloud. The main work includes the removal of discrete points, repair of holes, and point clouds. Downsampling, etc. Afterward, the Poisson reconstruction method is used to realize the triangular meshing of the weld point cloud. Comparing the manually measured values of the remaining height, welding width, and length of the V-shaped weld and the I-shaped weld with the reconstructed values, it can be found that the reconstruction results meet the real-time display and visualization of the weld.
To realize the rapid development of the welding manufacturing industry, the realization of intelligent welding process is one of the key points. In recent years, the automatic tracking of welding has reached a certain height, but the degree of automation in the appearance inspection of welding needs to be further strengthened. The traditional welding appearance inspection, including the measurement of the weld formation size and the detection of the weld surface defects, need to be completed by manual measurement, so it is time-consuming and inefficient to rely entirely on manual methods. To realize the intelligence of weld appearance inspection, this paper applies structured light vision technology to the measurement of weld formation size and the detection of weld surface defects. The research objects are I-type and V-type welds, respectively. Inspection of weld appearance.
In this paper, a visual inspection system capable of measuring the geometry of weld formation and identifying and classifying defects on the weld surface is developed. Starting from the working principle of the vision inspection system, the software and hardware platform design of the vision system is analyzed and researched. The appropriate laser transmitter and CCD camera and other related hardware are selected. Based on this vision sensor, a linear model of the camera was established, and the camera parameters and structured light parameters were calibrated using the calibration function and blanking point method in OpenCV. The results show that the calibration method in this paper is not only low cost and low intensity, but also relatively simple to operate, which meets the accuracy requirements of vision systems.
In this paper, to realize the visualization and real-time display of the weld after the measurement of the forming size, the weld point cloud is filtered for the collected weld centerline, and then a triangular grid of the weld point cloud is implemented using Poisson reconstruction into. Aiming at the defects such as pits and depressions often appearing on the surface of the weld, the cross-sectional profile of the normal weld and the weld with pits or nodules are compared. A detection algorithm based on the profile points of the cross-section of the weld is proposed to measure the weld. When there are defects on the surface, you only need to input the corresponding current, voltage, speed, etc. to obtain the distribution range of the contour points of the normal weld section under this process condition, and the contour points of the section to be measured and the contour of the normal weld section The points are compared to extract the abnormal contour points.