
Abstract
Movements of objects take place in different contexts and their trajectories are highly influenced by the contexts. Several studies have been conducted in the last decade on similarity measuring of raw trajectories, but very few have used context information in this process. Because the context information is collected from multifarious sources, it is qualitatively and quantitatively heterogeneous and uncertain. Therefore, the current distance functions are unable to measure the similarities between trajectories by considering the heterogeneous context information. This article presents a new context-aware hybrid fuzzy model, named CaFIRST, to measure the similarity of trajectories by considering not only the spatial footprints of moving objects but also various types of internal and external context information. CaFIRST is able to handle multi-size trajectories that are contextually enriched by both quantitative (numeric) and qualitative (descriptive) values. The performance of CaFIRST was examined using two real data sets, obtained from pedestrians and cyclists in New York City, USA. The results showed the robustness of CaFIRST for quantifying the commonalities in multivariate trajectories and its sensitivity to small alterations in context information. Furthermore, the effects of internal and external context information on similarity values are shown to be remarkable.
Keywords
Introduction
Owing to developments in navigation, positioning and tracking technologies, an unprecedented quantity of moving point data, (e.g., human, vehicle, animal) are being produced. The sequential positions of a moving point object (MPO) over the course of time generate a trail, which is known as a trajectory [28]. Nowadays, studying the movement of point objects and analysing their trajectories has become of great interest to researchers in various scientific fields, such as geographic information science, ecology and transportation. Specifically, measurement of the similarities between trajectories as a data mining technique in MPO databases has received considerable attention, because it can be the basis for understanding the objects’ behaviours, extracting movement patterns and predicting future movement trends [1, 23].
Finding the commonalities between trajectories and measuring their similarities is conventionally performed using distance functions. However, the current distance functions are only able to manipulate the spatial and spatio-temporal dimensions of trajectories, while they neglect the underlying situations and conditions during the movement, hereinafter termed the context. In other words, the movement of an entity is highly influenced by the context, (e.g., weather conditions, traffic, people nearby), and therefore the context should be incorporated in the movement analysis to obtain realistic results. A review of the literature discloses the utility and significance of accounting for context information in movement studies [3, 9], including in the similarity measurement process for trajectories [6, 24].
Multiple definitions exist for the term context in the literature. Sharif and Alesheikh define context in movement studies as “that part of a situation or data that influences movement or is influenced by movement” [25]. In addition, context is generally categorized as internal, (i.e., related to the moving object) or external, (i.e., related to the environment where the movement takes place). Contextual information can be obtained from various sources, (e.g., sensors, user-generated content and inference systems) and at different accuracy levels [16]; thus, it can be recorded in quantitative (numeric) or qualitative (descriptive) forms. For example, slope can be represented as a percentage or the degree of satisfaction in a traversed path can be described as low, medium or high. Very few studies have developed or extended the current distance functions to take advantage of quantitative context information in similarity measurements of trajectories to date [5, 23]. To the best of our knowledge, the present similarity measurement methods are unable to handle both quantitative and qualitative contextual information and the underlying uncertainty in the context information itself.
Fuzzy logic methods are able to deal with approximate and inaccurate values and are capable of capturing non-linear relationships between them [21], and so they can be applied to moving point object data sets [30]. The plethora of research contributions on exploiting fuzzy logic approaches demonstrates their applicability in movement applications [26] such as classifying human activity patterns [30], detecting travel transport modes [8], clustering mobile object trajectories [15] and eye movement [7] to name but a few. In this context, because of the ability of fuzzy inference systems (FISs) to handle heterogeneous and uncertain data [29], this research has developed a novel context-aware FIS for the similarity measure of trajectories which takes into account a wide variety of quantitative and qualitative information. The new contributions to the literature that this research can offer are threefold: (1) enriching trajectories with both multivariate internal and external contextual information, (2) employing qualitative and quantitative information in the similarity measure of trajectories and (3) introducing a context-aware hybrid fuzzy model and integrating the above variables in a broad sense.
The remainder of the paper is organized as follows. In Section 2, a review of the literature in terms of the current distance functions and the dimensions in the similarity search is discussed. Section 3 is dedicated to the proposed context-aware similarity measure model. The proposed model is assessed by applying it to two real data sets of pedestrian and cyclist trajectories in Section 4. Section 5 summarizes the research findings and provides potential future directions.
Related work
The challenging issue in similarity measurement of trajectories is how to define “similarity”. One perception is that the more two objects have common features, the more similar they are, and vice versa [18]. Specifically, two trajectories are similar if they have similar shapes, share similarities in their movement parameters, visit the same places, demonstrate identical trends [17] or are generated in similar contexts [23]. Such definitions have caused the similarity measures of trajectories to be explored from methodological and dimensional perspectives, which are described as follows.
From the methodological perspective, Dodge et al. claimed that the majority of distance functions fall into either the time series, (e.g., Minkowski distance, Dynamic Time Warping, Edit distance, Longest Common Subsequence) or the computational geometry, (e.g., Fréchet distance, Hausdorff distance) families [10]. Yuan and Raubal categorized the similarity measurement methods into geometry-based and time-based classes. The former concentrates only on the spatial aspects of trajectories and neglects the temporal dimension, while the latter incorporates the time characteristic into the similarity search on trajectories [35]. The time-based class can be considered as an extension to the time series family. However, new similarity functions have been developed recently [11, 31]. Because (1) each function has its own advantage(s) and disadvantage(s) and (2) the similarity measure of trajectories is an application-dependent task, there is no single standard method for all applications.
The introduced distance functions have limitations with respect to all types of data. On the one hand, the complex relationship between trajectories causes similarity searches to have a level of uncertainty. On the other hand, various heterogeneous parameters are used in the similarity search process. These parameters may come from different measurement devices or from individuals’ opinions. For example, speed, direction and slope variables are normally measured by instruments, while rating a path in terms of its difficulty, attractiveness and desirability is done by the users. Therefore, the context information can be diverse, descriptive, uncertain and heterogeneous, and must be modelled by a multivariate function.
From a dimensional standpoint, the spatial and spatio-temporal similarity measures of trajectories have been widely used by research studies for different applications. For example, the similarities for vehicle trajectories were extracted in a road network [33]. The similarities of mobile phone user trajectories were measured in an urban space [35]. The commonalities between North Atlantic hurricane trajectories were compared using a multidimensional similarity measure, not only for the spatio-temporal dimensions but also employing the movement parameters of the hurricane [10]. Moreover, as well as the physical properties, the semantic dimension was used to add meaning to raw trajectories [20, 37]. For instance, describing a moving object in terms of where (place), when (time), how (mode) and why (reason) can enrich the sequence of the object. This is known as a semantic trajectory [14]. In very few of the studies conducted, the semantic dimension was considered in the similarity measure of trajectories of visited places [12, 34]. However, context goes far beyond stops and visited places and covers a wide range of information that influence movement or are influenced by movement.
Incorporating contextual information provides a realistic perception of the similarity measure of trajectories. To this end, Buchin et al. modified existing distance functions (i.e., Hausdorff, Fréchet and equal time distances) to make them context-aware [6]. Specifically, geographical contexts were modelled as a polygonal subdivision of land use (sea/land) and as meteorological parameters for a North Atlantic hurricane data set and for albatross tracking data in Euclidean space. In another attempt, Sharif and Alesheikh proposed a multidimensional similarity measurement method based on Euclidean distance and applied it to real commercial aeroplane trajectories. The method was able to reveal the commonalities between the trajectories in the spatial, temporal and contextual dimensions, individually and collectively [22]. Despite the effectiveness of the developed method in handling both internal and external contexts, it can only be applied to trajectories of the same size (length). As a precursor to this work, a context-based dynamic time warping (CDTW) method was introduced for analysing trajectories of different lengths by including not only their spatial footprints but also a notion of internal and external contexts. The effectiveness of CDTW was examined in several experiments on a real commercial airplane data set [23].
All the aforementioned studies used quantitative (numeric) information in finding the similarities between trajectories. Despite contextual information being available in a qualitative (descriptive) form, no research has been conducted so far on incorporating both quantitative and qualitative information about moving objects for similarity assessment of their trajectories.
Methodology
A new hierarchal fuzzy inference system based on a genetic algorithm has been developed to measure the similarity of trajectories by employing a wide range of contextual information. Due to the complexity of the relationship between trajectories, designing fuzzy systems based on expert knowledge is a challenging task. In addition, the large number of contextual parameters means that the process of determining similarity measures of trajectories a high-dimensional problem. The advantages of using conventional fuzzy inference systems for solving such problems are fewer than the deficiencies, because of the exponential increase in their rules and decrease in their accuracy.
In order to establish an accurate, compact and adaptable system to determine the similarity measure of trajectories, a hybrid hierarchical fuzzy inference system (HFIS) has been designed. This system is named
The design of CaFIRST enables us to measure the similarity of trajectories for two sets of variables simultaneously. As shown in Fig. 1, the first group is a set of variables (hereinafter termed V
a
) assigned to each sampling point along the trajectories, such as coordinates, speed and direction. The second group is a set of variables (hereinafter termed V
b
) assigned to the entire trajectory, such as the difficulty of the path and the interest in the path. It should be noted that any of these variables can be in quantitative (numeric) or qualitative (descriptive) form.
A sample multivariate trajectory.
In CaFIRST’s topology, the V
a
and V
b
variables are compared to each other separately. As shown in Fig. 2, for the variables V
a
, the distance between two trajectories A and B is measured through the first fuzzy inference system (FIS 1) in layer 1 via pairwise comparison of samplingpoints a
i
and b
j
. The number of parameters attributed to each sampling point is given by k. By the same token, the similarity values for all other trajectories of group V
a
are calculated by other FISs in the same layer. For the V
b
set of variables, which are attributed to whole trajectories, the distances between pairs of trajectories are measured through other FISs in separate layers. The output of layer 1 and the similarity values from layer 2 are imported into the FIS in the next layer. This cumulative hierarchical process is continued until all the trajectories have been compared with each other.
Hierarchical structure of a hybrid fuzzy inference system for similarity measure of trajectories.
For generating a training data set, we use the recently developed method named context-based dynamic time warping (CDTW) [23]. CDTW has been shown to be robust enough to quantify the commonalities between trajectories with different sizes. In this research, CDTW is used for assessing the similarities of trajectories, including not only their spatial footprints but also a notion of their quantitative contexts. Given two trajectories R [r1, r2, …, r n ] and S [s1, s2, …, s m ] of sizes n and m, respectively, it is possible for each element of any trajectory to be annotated by movement parameters (x, y, t) and internal and/or external context(s) (c) (see Equation (1)).
In other words, r1 ={ xr1, yr1, tr1, cr1 } and s1 ={ xs1, ys1, ts1, cs1 }. The CDTW distance is determined by ∀i, j, k : i = 1, …, n, j = 1, …, m,
In order to define and optimize the fuzzy inference system, the multi-objective non-dominated sorting genetic algorithm II (NSGA-II) was applied. The simultaneous generation of membership functions and tuning of rules through learning helped to optimize the accuracy and complexity of the system. To this end, the HFIS structure is encoded using NSGA-II, and each chromosome is considered equivalent to an HFIS. The algorithm is then applied for finding the optimal solutions (optimal HFISs). The objective of the exploratory algorithm for learning HFIS is to minimize the number of system rules and the root-mean-square error (RMSE). Equation (2) demonstrates the first objective function (F1), in which n
s
is the number of fuzzy subsystems, m
j
is the number of membership functions and v
i
is the number of variables belonging to each subsystem.
Equation (3) relates to the second objective function (F2), where n is the number of samples, F (x
i
) is the trajectory similarity of the fuzzy inference system for the ith vector of the data and y
i
is the trajectory similarity of the observations.
To encode the proposed HFIS, a triple-coding scheme is used. C
L
determines the number of membership functions for each variable, C
T
tunes the membership functions and C
C
optimizes the consequence parts of the rules (Equation (4)).
To encode the C
L
part, a string of integers with size n + n
s
- 1 is used, where n is the number of input variables and n
s
- 1 is equal to the number of linking variables that are created for connecting different subsystems. Each of the genes (c
l
(i)) is assigned one of the values {1, … , 7 }. These numbers represent the number of fuzzy membership functions used for each variable. The variables with a value of 1 are removed (Equation (5)).
To encode the C
T
part, a string of real numbers is used. These real numbers are determined in a predefined domain of displacement. The number of variables is n + n
s
- 1, and each of them is described by a (c
l
(i)) fuzzy membership function. For tuning membership functions, the lateral displacement method [2] is used (Equation (6)).
A real-value vector is exploited to encode the C
C
part (Equation (7)). The output value of each rule is defined by a number between zero and one.
The initial population is randomly generated. To generate the C
L
part of each primary population, one of the values {1, … , 7 } is randomly assigned to the corresponding gene. After creating the C
L
part of each chromosome, two different versions are created in the C
T
part. In these versions random integer numbers are allocated in the same way, as ((c
t
(i, j + 1) - c
t
(i, j))/2) in the positive and negative directions of the centre of each partition. The value c
t
(i, j) indicates the centre of the jth partition of the ith variable. In the C
C
part of each chromosome, a random number between zero and one is assigned to each cell. As demonstrated in Fig. 3, for each sample of C
L
(in the blue part) two versions of C
T
(yellow or orange) and C
C
(green or purple) are generated.
Sample chromosome structures.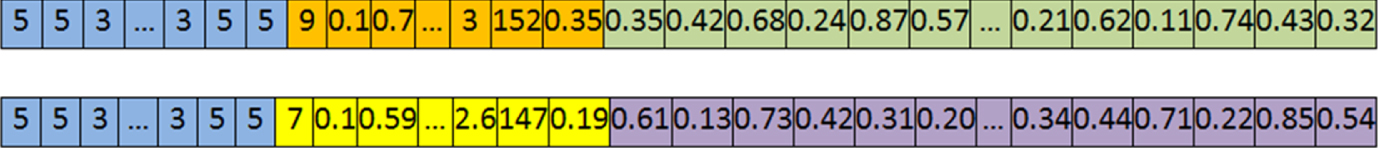
Crossover and mutation operators are used for preventing premature convergence, until the best possible configuration is achieved. The crossover operator is selected for each part of the chromosome individually. The BLX - α method is used for the C
T
and C
C
parts that are encoded using real numbers [13, 29]. This crossover method has been extensively used in encoding real numbers in exploratory algorithms. In this method, the offspring genes are generated around the parent genes. Let us assume that
CaFIRST
In this section, we validate our methodology and demonstrate the applicability of CaFIRST in contextually measuring and analysing the similarity of multivariate trajectories. For this purpose, CaFIRST was initially applied to several pedestrian and cyclist movement data sets, taking into account contextual information. Secondly, the functionality of CaFIRST was assessed by representing the control surfaces and Pareto fronts.
Data
The area studied was Central Park in Manhattan, New York City, USA, as depicted in Fig. 4. The park, with an area of approximately 3.41 km2 is one of the most famous parks in the United States, with millions of visitors per year. Due to the attractions and facilities of this park, various activities take place, the most common of which are walking, running, skating and cycling. In this research, a total of 400 real traces of individuals were examined, including 204 traces for pedestrians and 196 traces for cyclists [32].
Study area: Central Park, Manhattan, New York City, USA.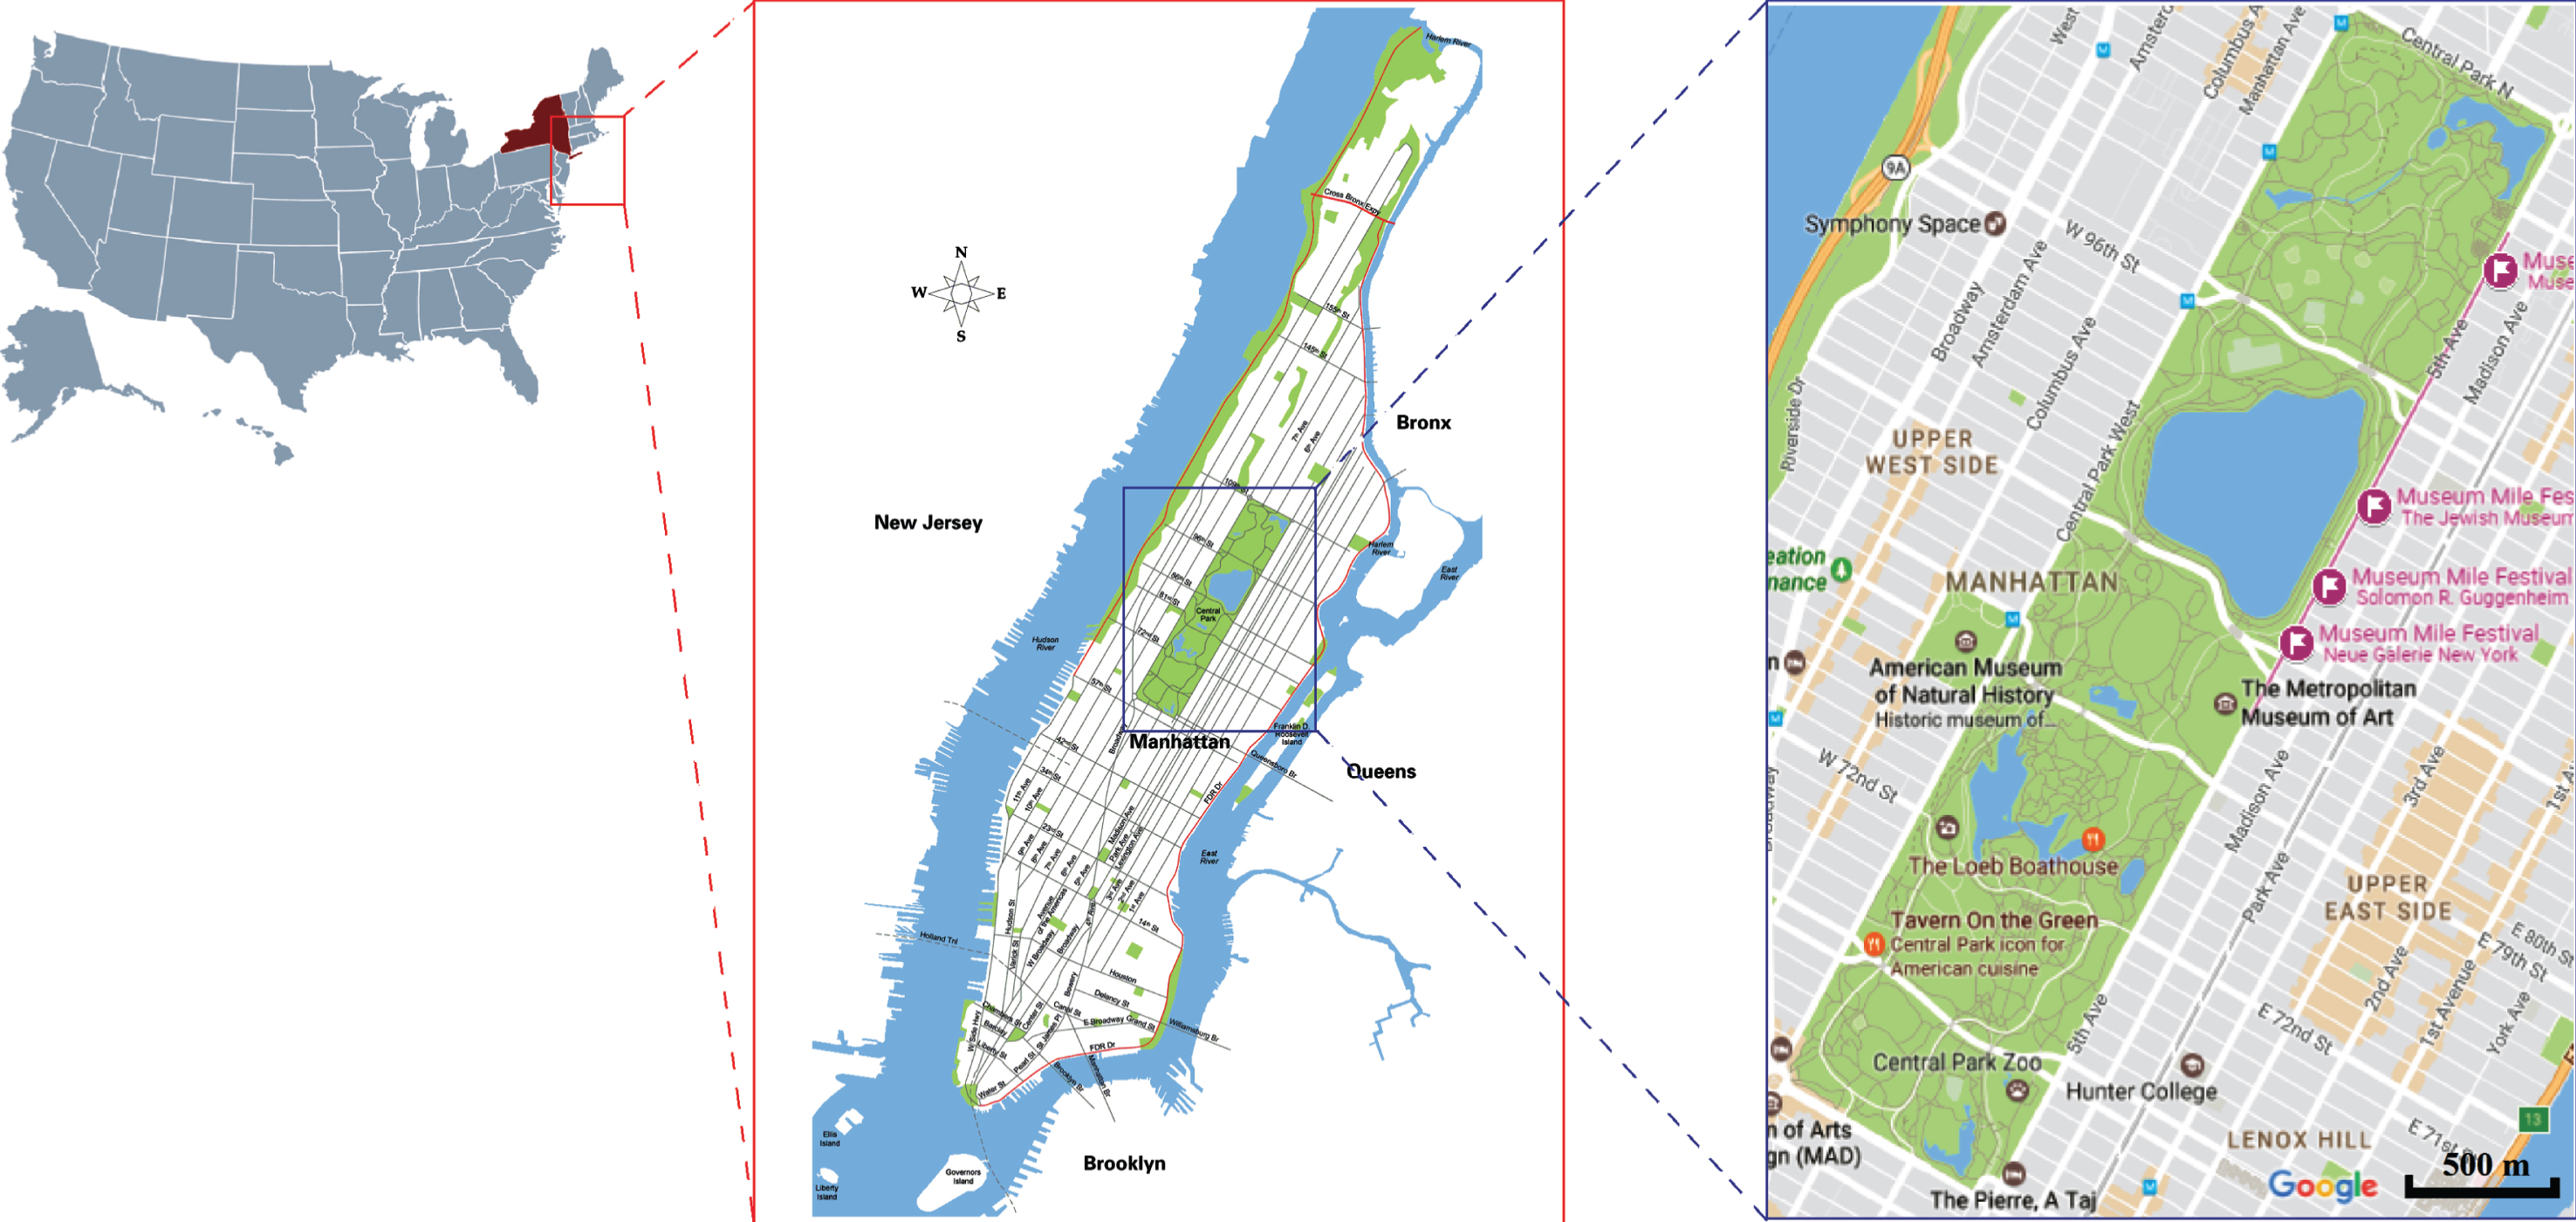
Recorded information of a sample trajectory [32]
*for each sampling point **for whole trajectory.
The variables for position (x, y), speed, direction and slope are recorded for every constituent sampling point, and the path length, path difficulty and degree of satisfaction variables are used to label the entire trajectory. The temporal resolutions of the pedestrian and cyclist data are approximately 20 s and 5 s respectively. The angles are measured in a clockwise direction relative to north, in degrees.
In this section, the proposed CaFIRST was used for developing multidimensional models capable of using quantitative and qualitative internal and external context information, along with the spatial dimension, to measure the similarity of trajectories of different lengths. Using CaFIRST, four different models were developed for each pedestrian and cyclist data set. The main purpose of each model was to study the effects of the various internal and external contexts on finding the commonalities between trajectories. In the first model (S), the degree of similarity between the trajectories was measured for the spatial dimension. In the second model (ST), the time parameter was added to the first model and the commonalities between trajectories were measured in the spatio-temporal dimension. By enriching the second model with internal context information, the third model (STIC) explored the added value of this information with respect to the similarity results. Finally, the fourth model (STIEC) was designed, in which all the spatial, temporal, internal context and external context values together were employed for investigating the similarities between trajectories. Figure 5 represents the initial and final partitions for each membership function of the input, intermediate and output variables, as the results of a single trial of the fourth model (STIEC) after optimization. Although it is possible to select up to seven partitions for the different variables, due to the multi-objective optimization and in order to control the number of rules, most of the variables are described using five partitions.
Initial and tuned database for of the STIEC model.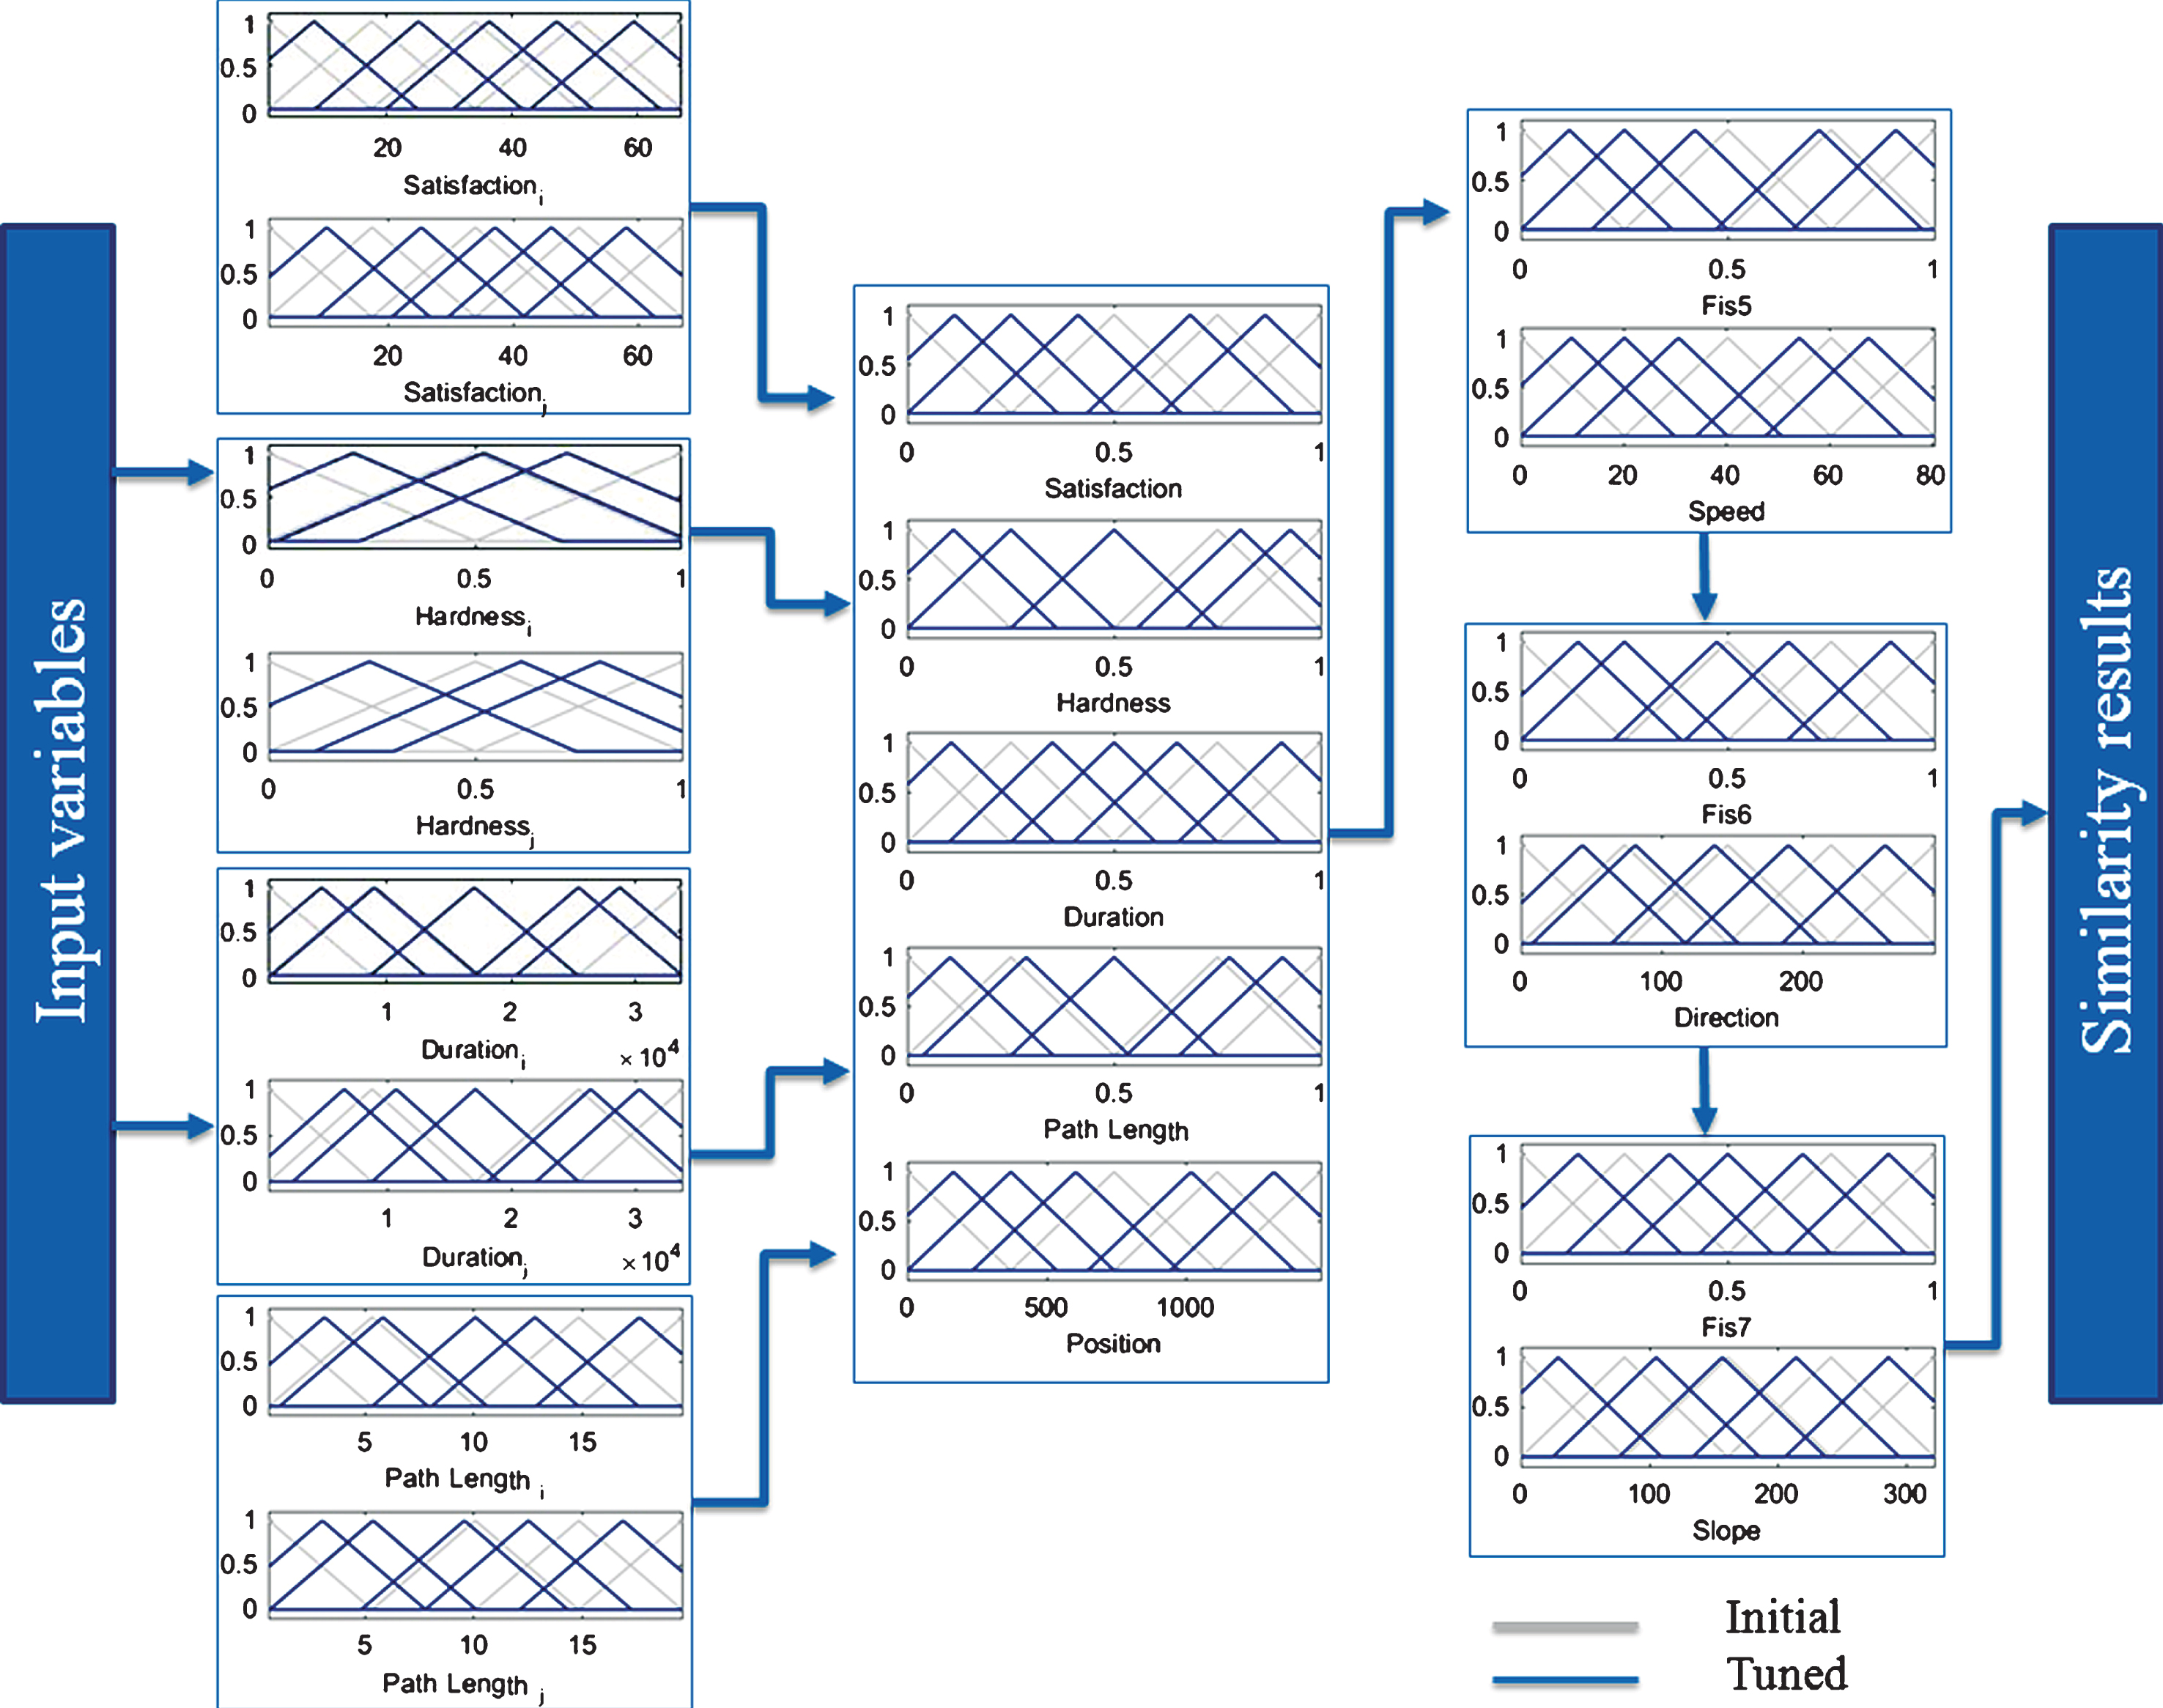
The similarity results obtained by applying the aforementioned four models to both the pedestrian and cyclist datasets were normalized to a scale of unity, to ensure they were invariant with respect to the amplitude of the scale as well as to ease interpretation and comparison. Then, a series of box plots was generated, aiming to explore the variations in the similarity results and to examine the role of the contextual information (see Fig. 6).
Boxplots of variations of similarity searches between trajectories using quantitative and qualitative information.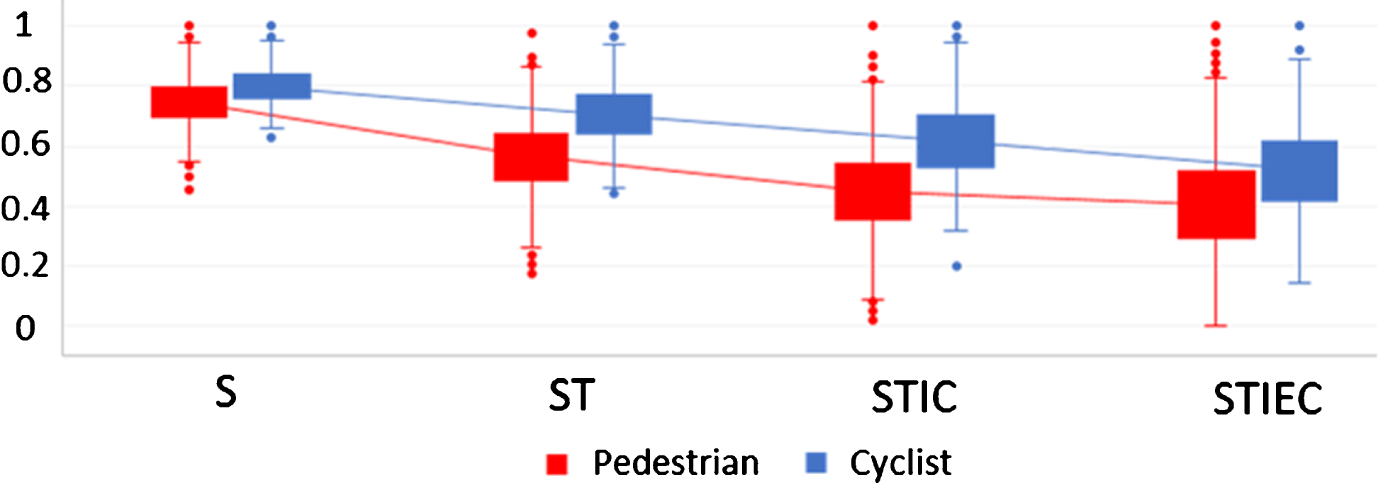
The interquartile ranges (IQRs), or the values between the first and third quartiles, represent the magnitudes of the effective similarity values and their medians. The whiskers demonstrate the similarity domains, (i.e., the ranges between the maximum and minimum similarity values).
Applying the first model (S), the similarity values for the spatial dimension of pedestrian and cyclist trajectories range from 0.55 to 0.93 and 0.65 to 0.95 respectively, indicating that the distributions of the similarity values in the spatial dimension are very close to each other. By adding the time variable, the similarity ranges in the spatio-temporal dimension for both data sets increase, compared to the spatial dimension. This issue has a direct relationship to the length of the traversed paths and the elapsed time.
Applying the third model to the data sets, the remarkable effects of the quantitative and qualitative internal context variables become evident in the similarity domain. Although the median decreases, there are substantial increases in the spatio-temporal-internal context dimension. Comparing the similarity domains of pedestrians and cyclists, the effects of the internal context on the pedestrian movements is greater than for the cyclist movements. The combinatorial dimension of the spatial, temporal, internal and external contexts represents a greater similarity domain and IQR compared to the previous three experiments.
It can be seen from Fig. 4 that there are steadily decreasing trends in the magnitudes of the median values for both data sets as a result of adding more parameters into the models. These values range from 0.72 to 0.40 and 0.81 to 0.58 for the pedestrian and cyclist data sets respectively. Meanwhile, although the pairwise comparisons of IQRs demonstrate almost equal values for the same model, these ranges increase slightly as more parameters are added to the models. According to the outputs of the four models, it is apparent that both the internal and external contexts have considerable effects on the similarity results. However, the cyclist trajectories are less affected by the contexts compared to the pedestrian trajectories. In addition, we contend that although incorporating the context information reduces the number of trajectories that share common features, these trajectories are more realistically similar to each other.
One-way analysis of variance to compare the similarity of trajectories with different contexts
A sensitivity analysis was used to determine the influence of the trajectory similarity results from various movement parameters and items of context information, using CaFIRST. Part of the output of this implementation for both the pedestrian and cyclist data sets is shown in Fig. 7. The bar charts represent the almost normal distribution and frequency of the variables time, degree of satisfaction and path length. In addition, the histograms demonstrate the impact of each model input on the outputs, (i.e., the similarity values). For example, the influence values of the similarity results of the trajectories from the temporal perspective for the pedestrian and cyclist data sets are 0.63 and 0.84, respectively, which indicates that there is a strong relationship between similarity values and the time parameter. However, the correlation values between similarity values and the degree of satisfaction parameter are 0.36 and 0.42 for the pedestrian and cyclist data sets respectively, which indicates less effect on the similarity results from this parameter. This can also be inferred from the distribution of the sampling points. Regarding the traversed path, the similarity correlation for pedestrian trajectories is 0.58 and for cyclist trajectories is 0.67. By reviewing all the movement parameters and context information, it can be shown that the effect on the similarity of the cyclist trajectories of these variables was higher than the effect on the pedestrian trajectories.
Sensitivity analysis of CaFIRST to movement parameters and context information: a) Pedestrians trajectories, b) Cyclists trajectories.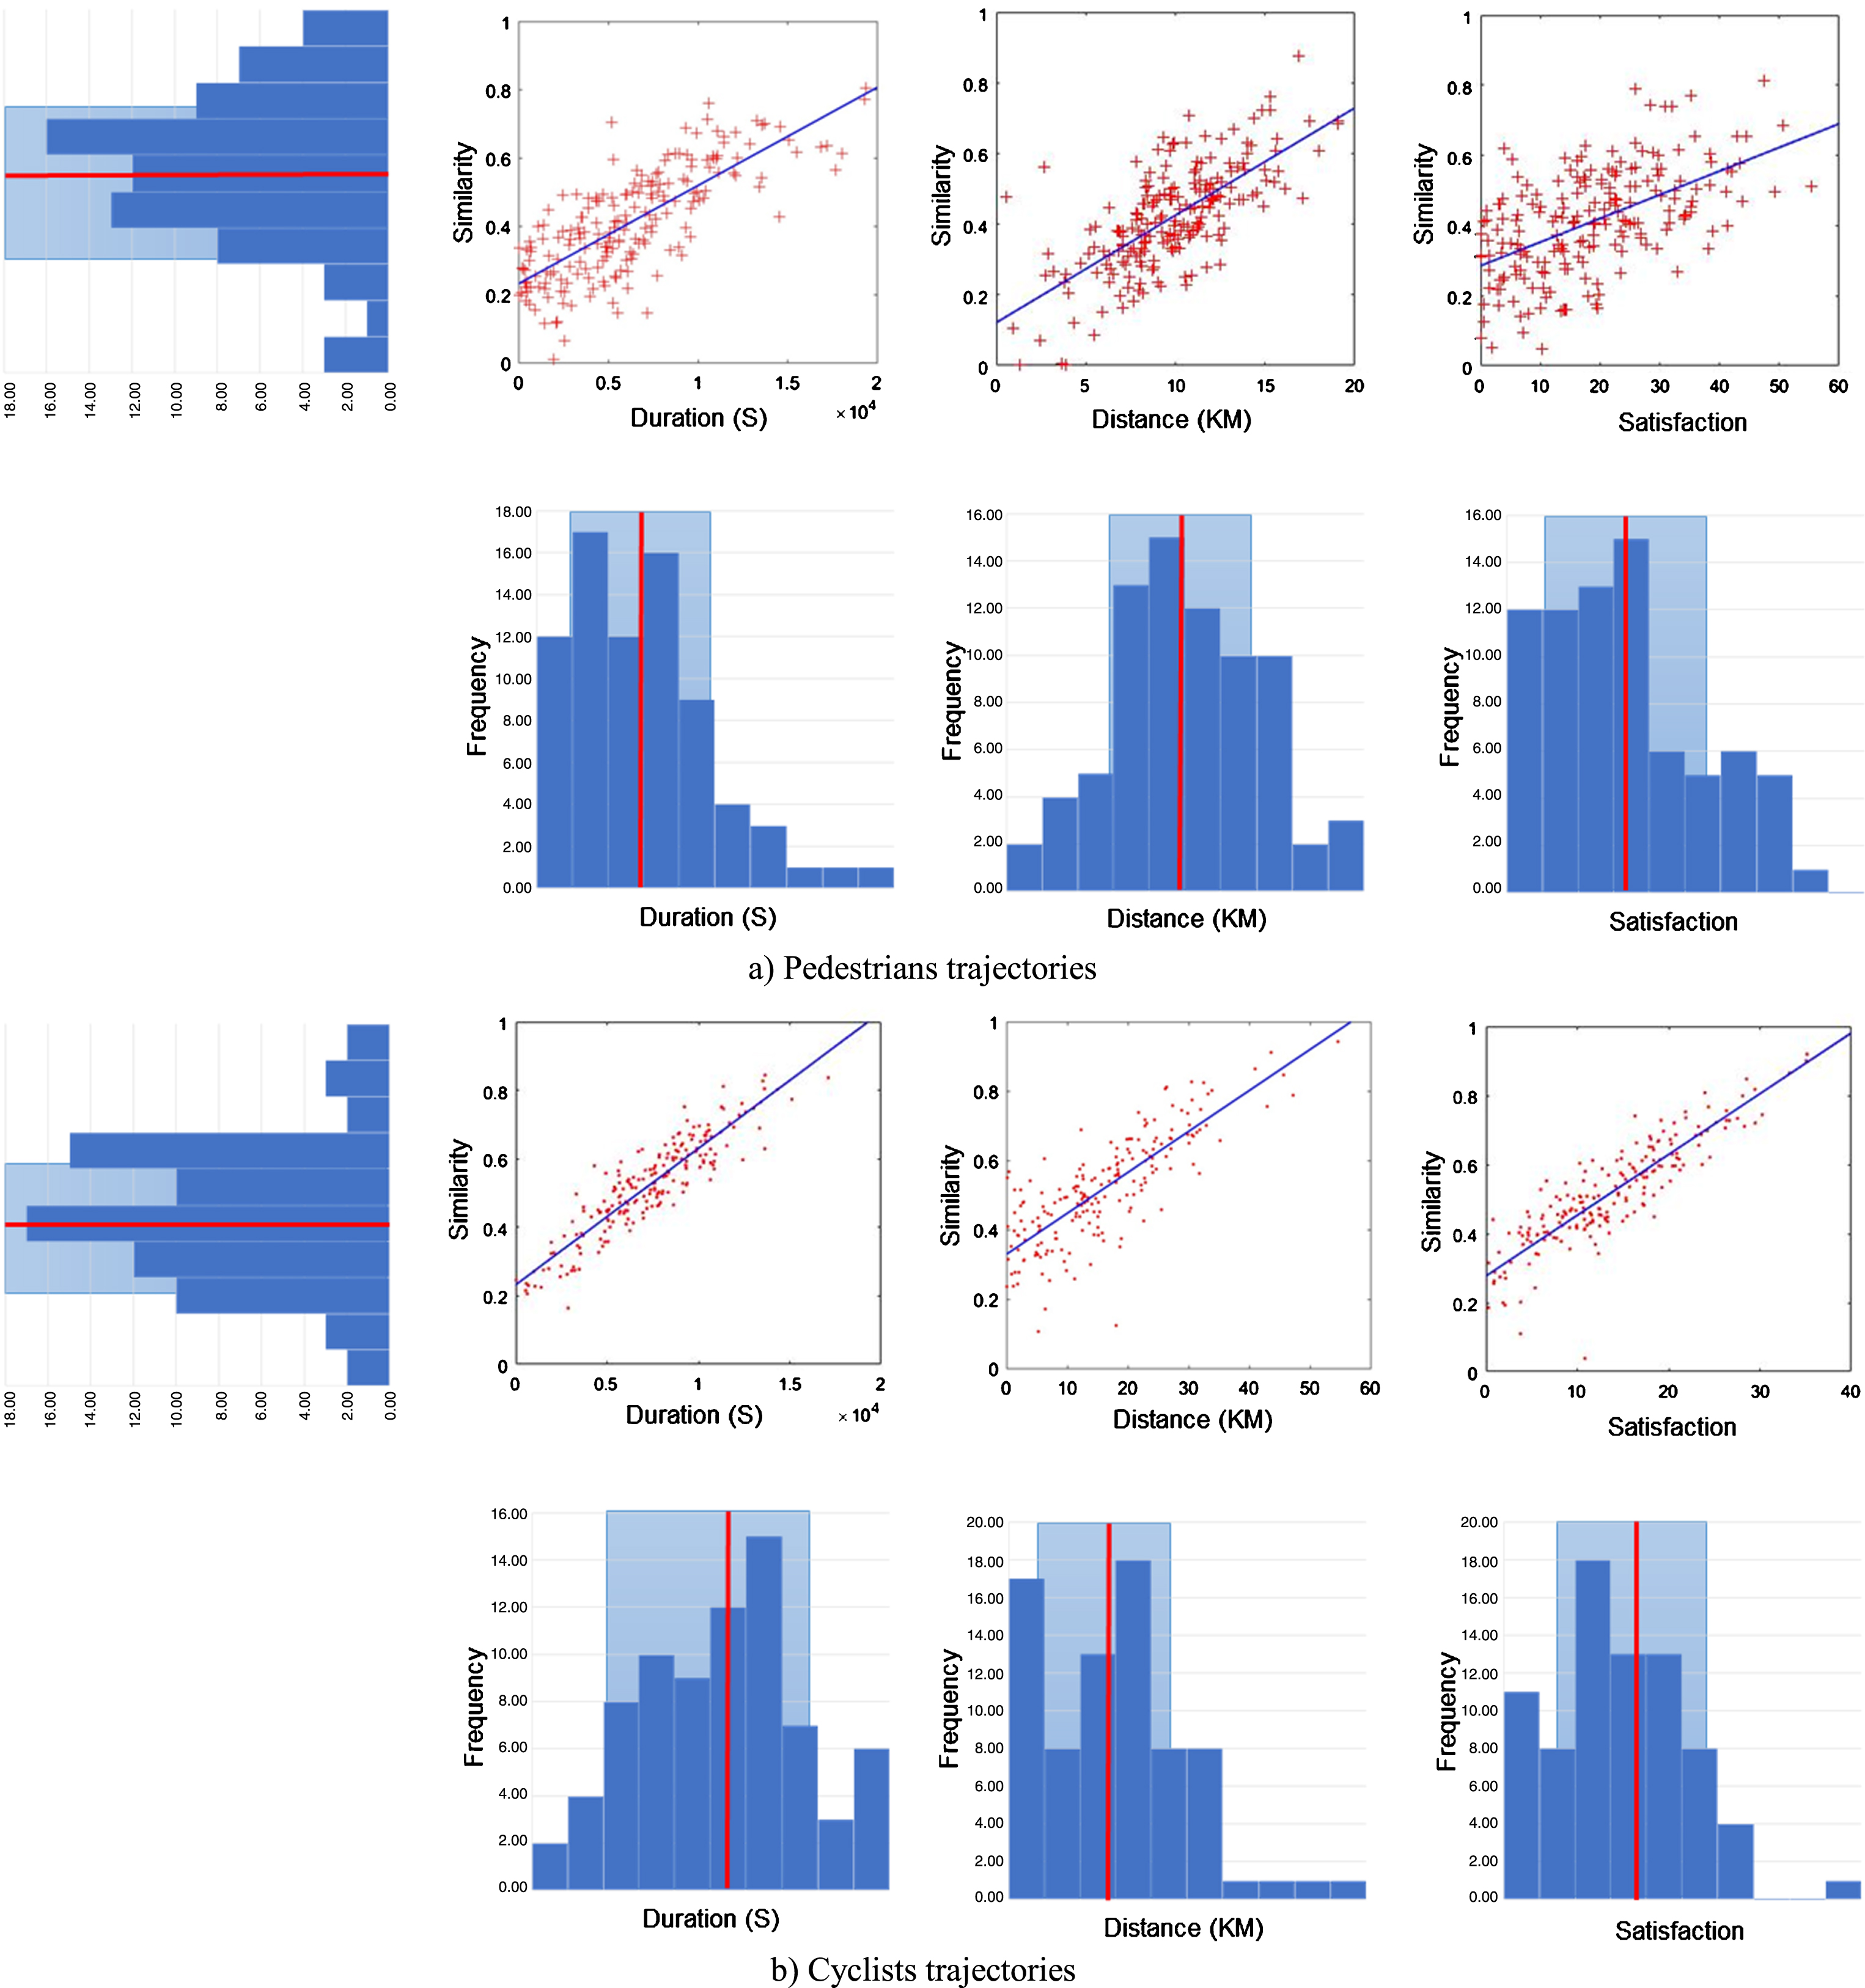
In this subsection, the performance of CaFIRST was evaluated by performing a set of analyses on the data sets. Control surface plots are not only able to visually demonstrate the relationship between inputs and outputs, but they are also able to address the consistency of the knowledge used in the FISs. Figure 8 illustrates three examples of the control surfaces, namely, time, distance and the degree of satisfaction for the fourth model, (i.e., STIEC), as this is the most complete and complex model relating to the similarity measure of the pedestrian trajectories. Each plot illustrates the relation between two inputs and one output. It can be seen from the plots that all the surfaces have fully covered the spaces, with no notches or abrupt changes. In other words, while CaFIRST prevents the exponential increase of rules, it produces rules in the process of learning and the optimization of the system that effectively establish the connection between inputs and outputs [27].
Control surfaces of CaFIRST for the STIEC model applied on pedestrians trajectories: a) duration, b) distance, c) degree of satisfaction.
In addition, Fig. 9 illustrates the Pareto fronts generated by a single trial of CaFIRST for all the models of the pedestrian and cyclist data sets. The proposed algorithm for both data sets shows good coverage for all the Pareto fronts. However, the cyclists Pareto fronts show more uniformity than the pedestrian Pareto fronts. In other words, except for the third model (STIC) applied to the pedestrian data set, the diversity, (i.e., the distribution of the points on the Pareto frontier) is uniform.
Pareto fronts derived from simultaneous learning through the two-tier optimization algorithm for trajectory similarity measure of the four models of pedestrians and cyclists.
As can be seen from Fig. 9, the ranges of the number of rules in these two sets of data are not significantly different. However, the more complex the model and the greater the use of input parameters, the more rules are generated to describe the system. The similarity of the number of rules in these two data sets can be considered as an indicator demonstrating the stability and repeatability of the proposed system for a variety of data sets [29].
In this research, a novel hybrid method based on fuzzy inference systems was proposed to measure the multidimensional similarities of non-identical moving object trajectories with the use of internal and external context information. The proposed method, which was named CaFIRST, improves the existing distance functions in terms of using movement data and heterogeneous, descriptive and uncertain context information.
During the design of CaFIRST, to overcome the exponential increase of the rules to promote the accuracy of the system, two solutions were proposed. The first solution was using a hierarchical fuzzy inference system with a topology according to the problem and the second solution was simultaneous generation of membership functions and tuning of rules through learning. The combination of these two solutions led to a better association between the rules of the models and the optimization of the accuracy and complexity of the system.
CaFIRST improves upon the current distance functions by taking into account both internal and external context information, along with movement parameters. CaFIRST is able to handle both the quantitative and qualitative information attributed to each sampling point and to the entire trajectory. The performance of CaFIRST was evaluated by running several models on two real data sets consisting of pedestrian and cyclist trajectories in a constrained Euclidean space, accounting for internal and external context information. The results not only confirmed the efficiency of CaFIRST in producing a context-aware similarity measure of trajectories with various sizes, but also showed CaFIRST to be a system sensitive to any small alteration in the context information.
There are multiple directions for future work. We will use the similarity results of the trajectories for mining patterns and predicting the behaviour of the MPOs. Furthermore, we are interested in exploiting context information for other aspects of analysing moving object traces, such as classification and clustering. CaFIRST has been introduced to measure the similarity of movement between single MPO trajectories. Future research could examine the movements of groups of moving objects, such as tourist movements or the migrations of birds. Another promising future research direction relates to the interactions, (i.e., attraction or avoidance) of the MPOs with each other and with the geographical context. In addition, one can determine the place of interests (POIs) based on the outcomes of the similarity models.