Due to proliferation of competitive online Business-to-Consumer (B2C) models, it is becoming a challenging task for new users to choose best products, based on existing users’ reviews residing on different e-commerce websites. On analysis, it is found that the opinions of the existing customers play an important role for new customers in making appropriate purchase decisions. Though there are some online websites that provide aggregation of basic product information from multiple sources, there is a negligible research effort in the direction of opinion-based product ranking. In this paper, we propose an Opinion-based Multi-Criteria Ranking (OMCR) approach, which amalgamates structural and content-based features of review documents to rank different alternatives of the online products. It uses a total number of five features based on reviews’ meta-data and contents to rank different alternatives using multi-criteria decision making approaches. OMCR also incorporates a sentiment analysis and visualization approach to determine sentiment polarity values and visualize them in a comprehendible manner. Experiments are conducted over two different real datasets, and efficacy of OMCR is assessed using set intersection method, which is generally used to compare two ranked lists in terms of their overlapping score.
Due to easy accessibility and availability of Business-to-Consumer (B2C) websites, customers are shifting from traditional interactive shopping to online shopping to save time and get products at a competitive price. B2C websites allow customers to directly purchase goods or services from manufacturers online, without involving any third party sellers, which reduces the overall costs of the products. The online shopping also enhances consumers’ ability to access product details and prices from different online shopping sites and compare them easily to take an informed decision. However, generally it is very difficult for customers to take purchase decision based on only product descriptions provided by the B2C websites. Rather, they are very much curious to know the opinion of existing customers and competitive price offered by different B2C websites before making any purchase decision.
Since most of the B2C websites facilitate their customers to write reviews of the purchased products, opinions of the existing customers have become an important and reliable source of information to help new customers for making an appropriate purchase decision. Moreover, the opinions of the existing customers may be helpful for the manufacturers to know the sentiments of the users, so that the positive features could be used for marketing and the negative features could be improved for better customer satisfaction. However, due to unstructured and distributed nature of the reviews of same product across multiple B2C sites, their manual analysis is not feasible. Though some of the existing websites such as naaptol.com, mysmartprice.com, etc. provide comparison of similar products based on their basic features and price, none of them provides a holistic ranking of the products. Moreover, none of such websites provides comparison of products based on the opinions of the existing users. Therefore, curating review documents from different B2C websites in a common format and analyzing them using different meta-data and content-based features to generate rank scores for different alternative of a product category seems useful for both new customers and manufacturers.
Our Contributions
Though a good amount of research efforts have been directed towards opinion mining and sentiment analysis [9, 28], relatively little attention has been directed towards the opinion-based product ranking. In this paper, we present an Opinion-based Multi-Criteria Ranking (OMCR) approach to rank different alternatives of online products using Multi-Criteria Decision Making (MCDM) techniques. The MCDM is an area of operation research which is generally used to find best alternatives by evaluating multiple conflicting criteria. We have identified a set of five features, such as star rating, user verification status, review title, review content, and review usefulness based on meta-data and contents of the review documents to rank different alternatives of online products. We have also shown how features identified from review documents can be ranked using AHP (Analytic Hierarchy Process), and how decision matrix can be generated from review documents to rank different alternatives of a product using TOPSIS (Technique for Order Preference by Similarity to Ideal Solution). The proposed OMCR also incorporates a sentiment analysis and visualization technique to determine sentiment polarity values and visualize them in a comprehendible manner.
In short, the key contributions of this paper can be summarized as follows:
Development of an opinion-based multi-criteria ranking approach to rank different alternatives of online products using meta-data and content-based features of review documents.
Feature identification from review documents and their ranking using AHP.
An approach for decision matrix generation from review documents and ranking different alternatives of a product using TOPSIS.
A sentiment aggregation and visualization scheme to determine sentiment polarity values and visualize them in a comprehendible manner.
For experimental evaluation of the OMCR, we have generated two real datasets using import.io from three different e-commerce websites – Amazon, Flipkart, and Snapdeal. The first dataset consists of 5623 reviews of smartphones, whereas the second dataset consists of 32014 reviews of hard disk drives. The efficacy of the OMCR is assessed using set intersection method, which is generally used to compare two ranked lists in terms of their overlapping score.
The rest of the paper is organized as follows. Section 2 presents a brief review of the existing works on different product ranking approaches. Section 3 presents some basic concepts related to MCDM. The functioning details of our proposed OMCR approach is presented in Section 4. Sections 5 and 6 presents experimental and evaluation results. Finally, Section 7 concludes the paper with future directions of research.
Related works
This section presents a brief review of the state-of-the-art techniques in product ranking. The authors in [13] presented an estimation of the finest mobile phones based on users preferences using multi-criteria decision making. They considered three mobile phones of same price-range and ranked them using AHP and TOPSIS. In [31], the authors proposed a product ranking technique using the product features extracted from review documents. They modelled review documents as a weighted and directed graph and applied graph-theoretic approaches for product ranking. In order to identify the relationship between mobile phone preferences of different users, a number of researchers have worked in this direction [3, 10]. Chen et al. [4] argued that success level of a new product is highly dependent on the customers requirements. In this work, they proposed a system prototype using neural networks for multi-cultural factors evaluation and customer requirements acquisition. The authors in [17] showed direct relationship between users satisfaction and product design, and proposed a relationship model to predict users satisfaction.
In [30], the authors proposed an approach to rank e-commerce websites using MCDM techniques based on different criteria, such as appearance, easy to use, and price. They applied AHP technique for criteria weighting and evaluating the structure of a ranking problem. Thereafter, they used Fuzzy Sets to represent uncertainty, and applied TOPSIS for final rank generation. The authors in [11] proposed a ranking system using linguistic features and support vector regression model to rank review documents. They generated a corpus containing 3730 Chinese reviews of eight different product categories, such as cell phones, toys, books, etc. to evaluate the proposed ranking system using different confidence measures.
Though a numer of literatures exist in the doamin of recommendar system (e.g., [2, 19]), the authors in [16] proposed a hybrid framework, which combines multi-criteria decision analysis technique with collaborative filtering for recommendations. In [27], the authors proposed different categories of MCDM problems, including an evidential reasoning method, which is one of the recent advances in managing mixed MCDM problems. They also presented a comparison of the evidential reasoning method with AHP technique. A feedback-based diagnosis system using MCDM techniques is presented in [7] to assist the advertising group of an e-commerce organization.
Opinion-based multi-criteria ranking of online products comes under the category of MCDM, which is a branch of operation research. It is defined as the ranking of alternate products based on multiple but conflicting criteria [20]. The MCDM methods assist in decision making process through organizing, resolving decisions, and planning difficulties in terms of multiple criteria, and they have been used in various application domains [5, 29]. The MCDM methods can be used to recognize preferred measures amongst a set of alternatives through which strengths and weaknesses of several adaptation choices can be calculated using multiple criteria.
To the best of our knowledge, none of the works mentioned above has considered the amalgamation of reviews-based features and MCDM techniques to rank different alternatives of the online products. Our proposed work is in line to the work presented in [13], but instead of product-and customer-related features, we have used reviews-based features to rank different alternatives of the online products.
Preliminaries
In this section, we present technical details about two popular MCDM techniques – AHP and TOPSIS that are mainly used for feature and product ranking, respectively in our proposed OMCR method.
Analytic Hierarchy Process
The Analytic Hierarchy Process (AHP) was developed by Thomas L. Saaty in the year 1980 [22]. It is one of the widely used methods to rank different criteria. It decomposes a complex and unstructured condition into its constituent parts and arranges the criteria, sub-criteria, and alternatives into a hierarchical structure, as shown in Fig. 1.
Hierarchical structure used in AHP to represent the decomposition of a. complex condition into criteria, sub-criteria, and alternatives.
One of the appealing features of AHP is the pair-wise comparison of criteria to assign them numeric weights for comparing different alternatives. It relies on the experts’ judgement to gain knowledge on a priority scale. AHP is a non-linear approach, and it has a special concern to determine whether pair-wise criteria weights assigned by the experts are consistent or not. As pointed out in [1], the general form of AHP is susceptible to rank reversal problem, i.e., AHP may change the ranking of alternatives on addition of a new alternative [25]. However, despite the controversies and problems faced by AHP, it is one of the most widely used MCDM models for decision making problems. A detailed discussion including limitations, pitfalls, and practical difficulties associated with the multi-criteria decision analysis techniques can be seen in [15]. A brief descriptions of the steps used in AHP to rank a given list of alternatives are given in the following paragraphs.
Step 1: Hierarchical representation of the problem
AHP represents a decision-making problem as a tree-like hierarchy, in which objective is represented by root node, criteria and sub-criteria are represented by middle-level nodes, and alternatives are represented by leaf nodes.
Step 2: Feature score-vector generation
After hierarchical representation of the problem, a relative criteria score matrix (), as defined in Equation 1, is generated. is a positive reciprocal real matrix of order n × n, where n is the total number of criteria, and cij represents the importance of ith criteria over jth criteria. Since in comparison to assigning weights to individual criteria, it is easier to determine relative importance between a pair of criteria, matrix is generated using the values assigned by a domain expert using the Saaty’s nine-point scale given in Table 1. For n criteria, expert needs to assign only n (n - 1)/2 relative values. The elements above the diagonal of (i.e. cij for i > j) are determined using expert’s feedback, the diagonal elements (i.e. cii) are kept as 1, and the elements below the diagonal are determined using the reciprocal property, i.e., cij = 1/cji.
Saaty’s [22] nine-point scale for pair-wise scoring between criteria c1 and c2
Numeric value
Linguistic meaning
1
Both c1 and c2 are equally important
3
c1 is slightly more important than c2
5
c1 is more important than c2
7
c1 is strongly more important than c2
9
c1 is extremely more important than c2
2, 4, 6, 8
Intermediate value of importance
In order to rank criteria, principal eigenvector of is calculated. Though there are various approaches to calculate principal eigenvector, an approximate principle eigenvector of a matrix can be obtained by normalizing the elements in each column and then taking the average of each row [21]. Therefore, we normalize by dividing each element of a column with the respective column-sum. Equation 2 presents the normalized matrix , in which . In order to compute a numeric score for each criterion, a criteria score vector in the vector space is calculated using normalized criteria matrix , in which si represents the score of the ith criteria and calculated as , i.e., as an average of the ith row of .
Step 3: Consistency checking
Inconsistency may arise due to assigning incorrect scores to different criteria-pairs by the expert. Therefore, AHP provides a mechanism to check whether the scores provided by the expert are consistent or not. To this end, a consistency ratio (r) is calculated as the ratio of consistency index (CI) to the random consistency index (RI), and a judgement is considered as consistent, if r < 0.1, otherwise it is considered as inconsistent. In order to calculate CI, first we calculate a weight vector as a product of relative criteria score matrix and criteria score vector, i.e., . Thereafter, a consistency vector is obtained by dividing the elements of vector by the respective elements of vector , i.e., . The value of CI is calculated using Equation 3, where λ is the average of the consistency vector and n is the number of criteria. An appropriate RI value is chosen from the list of RI values derived by the authors of [21]. Table 2 presents some sampler RI values corresponding to different values of n.
Step 4: Decision matrix generation and alternatives ranking
The final step of AHP is to generate a decision matrix of order m × n, where m and n represent the number of alternatives and criteria, respectively. The values of can be generated either from a dataset or from expert’s judgement. In expert judgement method, a relative score matrix of order m × m is generated by pair-wise comparison of alternatives for each criteria, explained in step 2. Thereafter, corresponding to each criteria, a score vector for each alternative is calculated using the process explained in step 2, and all score vectors are arranged together to generate the decision matrix . Finally, is multiplied with the criteria score vector to get rank vector , in which ith element represents the rank score of the ith alternative.
Technique for Order Preference by Similarity to Ideal Solution
The technique for order preference by similarity to ideal solution (TOPSIS) was developed by Hwang and Yoon [12] in 1980, and since then it is considered as one of the most widely used alternatives ranking methods. It categorizes criteria into two different classes – one includes all those criteria that have positive impact on the goal, and the other includes all those criteria that have negative impact on the goal. Accordingly, it calculates two different ideal solutions, namely best and worst ideal solutions. The best ideal solution is taken as the maximum of the positive criteria values and minimum of the negative criteria values, whereas worst ideal solution is taken as the minimum of the positive criteria values and maximum of the negative criteria values. Finally, TOPSIS uses Euclidean distance to measure the relative closeness of the alternatives to the ideal solutions and determines their ranks.
One of the advantages of TOPSIS lies in its easy to use, simple and programmable process [25]. However, it suffers with a major disadvantage due to using Euclidean distance, which does not consider criteria correlation. A brief description of the steps involved in TOPSIS process to rank alternatives are given in the following paragraphs.
Step 1: Decision matrix generation
The first step in the TOPSIS process is to generate a decision matrix of order m × n (Equation 4), where m and n represent the number of alternatives and criteria, respectively. The dij entry of represents the score of the ith alternative with respect to the jth criteria.
Step 2: Decision matrix normalization
The next step followed by TOPSIS is to normalize the decision matrix in such a way that the length of each column vector becomes 1, which is achieved by dividing each element of a column by the length of the respective column-vector. The normalized decision matrix corresponding to is shown in Equation 5, where .
The weighted normalized decision matrix is obtained by multiplying each column of with the corresponding criteria rank score, which can be calculated using any criteria ranking technique. A weighted normalized decision matrix is shown in Equation 6, where and sj is the rank score of the jth criteria.
Step 4: Ideal solutions determination
The criteria set is partitioned into two subsets F(+) and F(-), where F(+) includes all criteria that have positive impact on the goal, and F(-) includes all those criteria that have negative impact on the goal. The best and worst ideal solutions are denoted by row vectors and and defined using Equations 7 and 8, respectively.
Step 5: Alternatives ranking
In order to rank different alternatives, Euclidean distance of each alternatives with the ideal solutions and is calculated. For ith alternative, distance from best and worst ideal solutions is denoted by δb [i] and δw [i] and calculated using Equations 9 and 10, respectively.
After calculating distance from ideal solutions, the rank score (i = 1, 2, …, m) of ith alternative is calculated using Equation 11. The value of is always between 0 and 1, and it is 0 when δw [i] =0, showing worst condition for the alternative (i.e., its distance from worst ideal solution is 0). Similarly, the value of is 1 when δb [i] =0, showing best condition for the alternative (i.e., its distance from best ideal solution is 0).
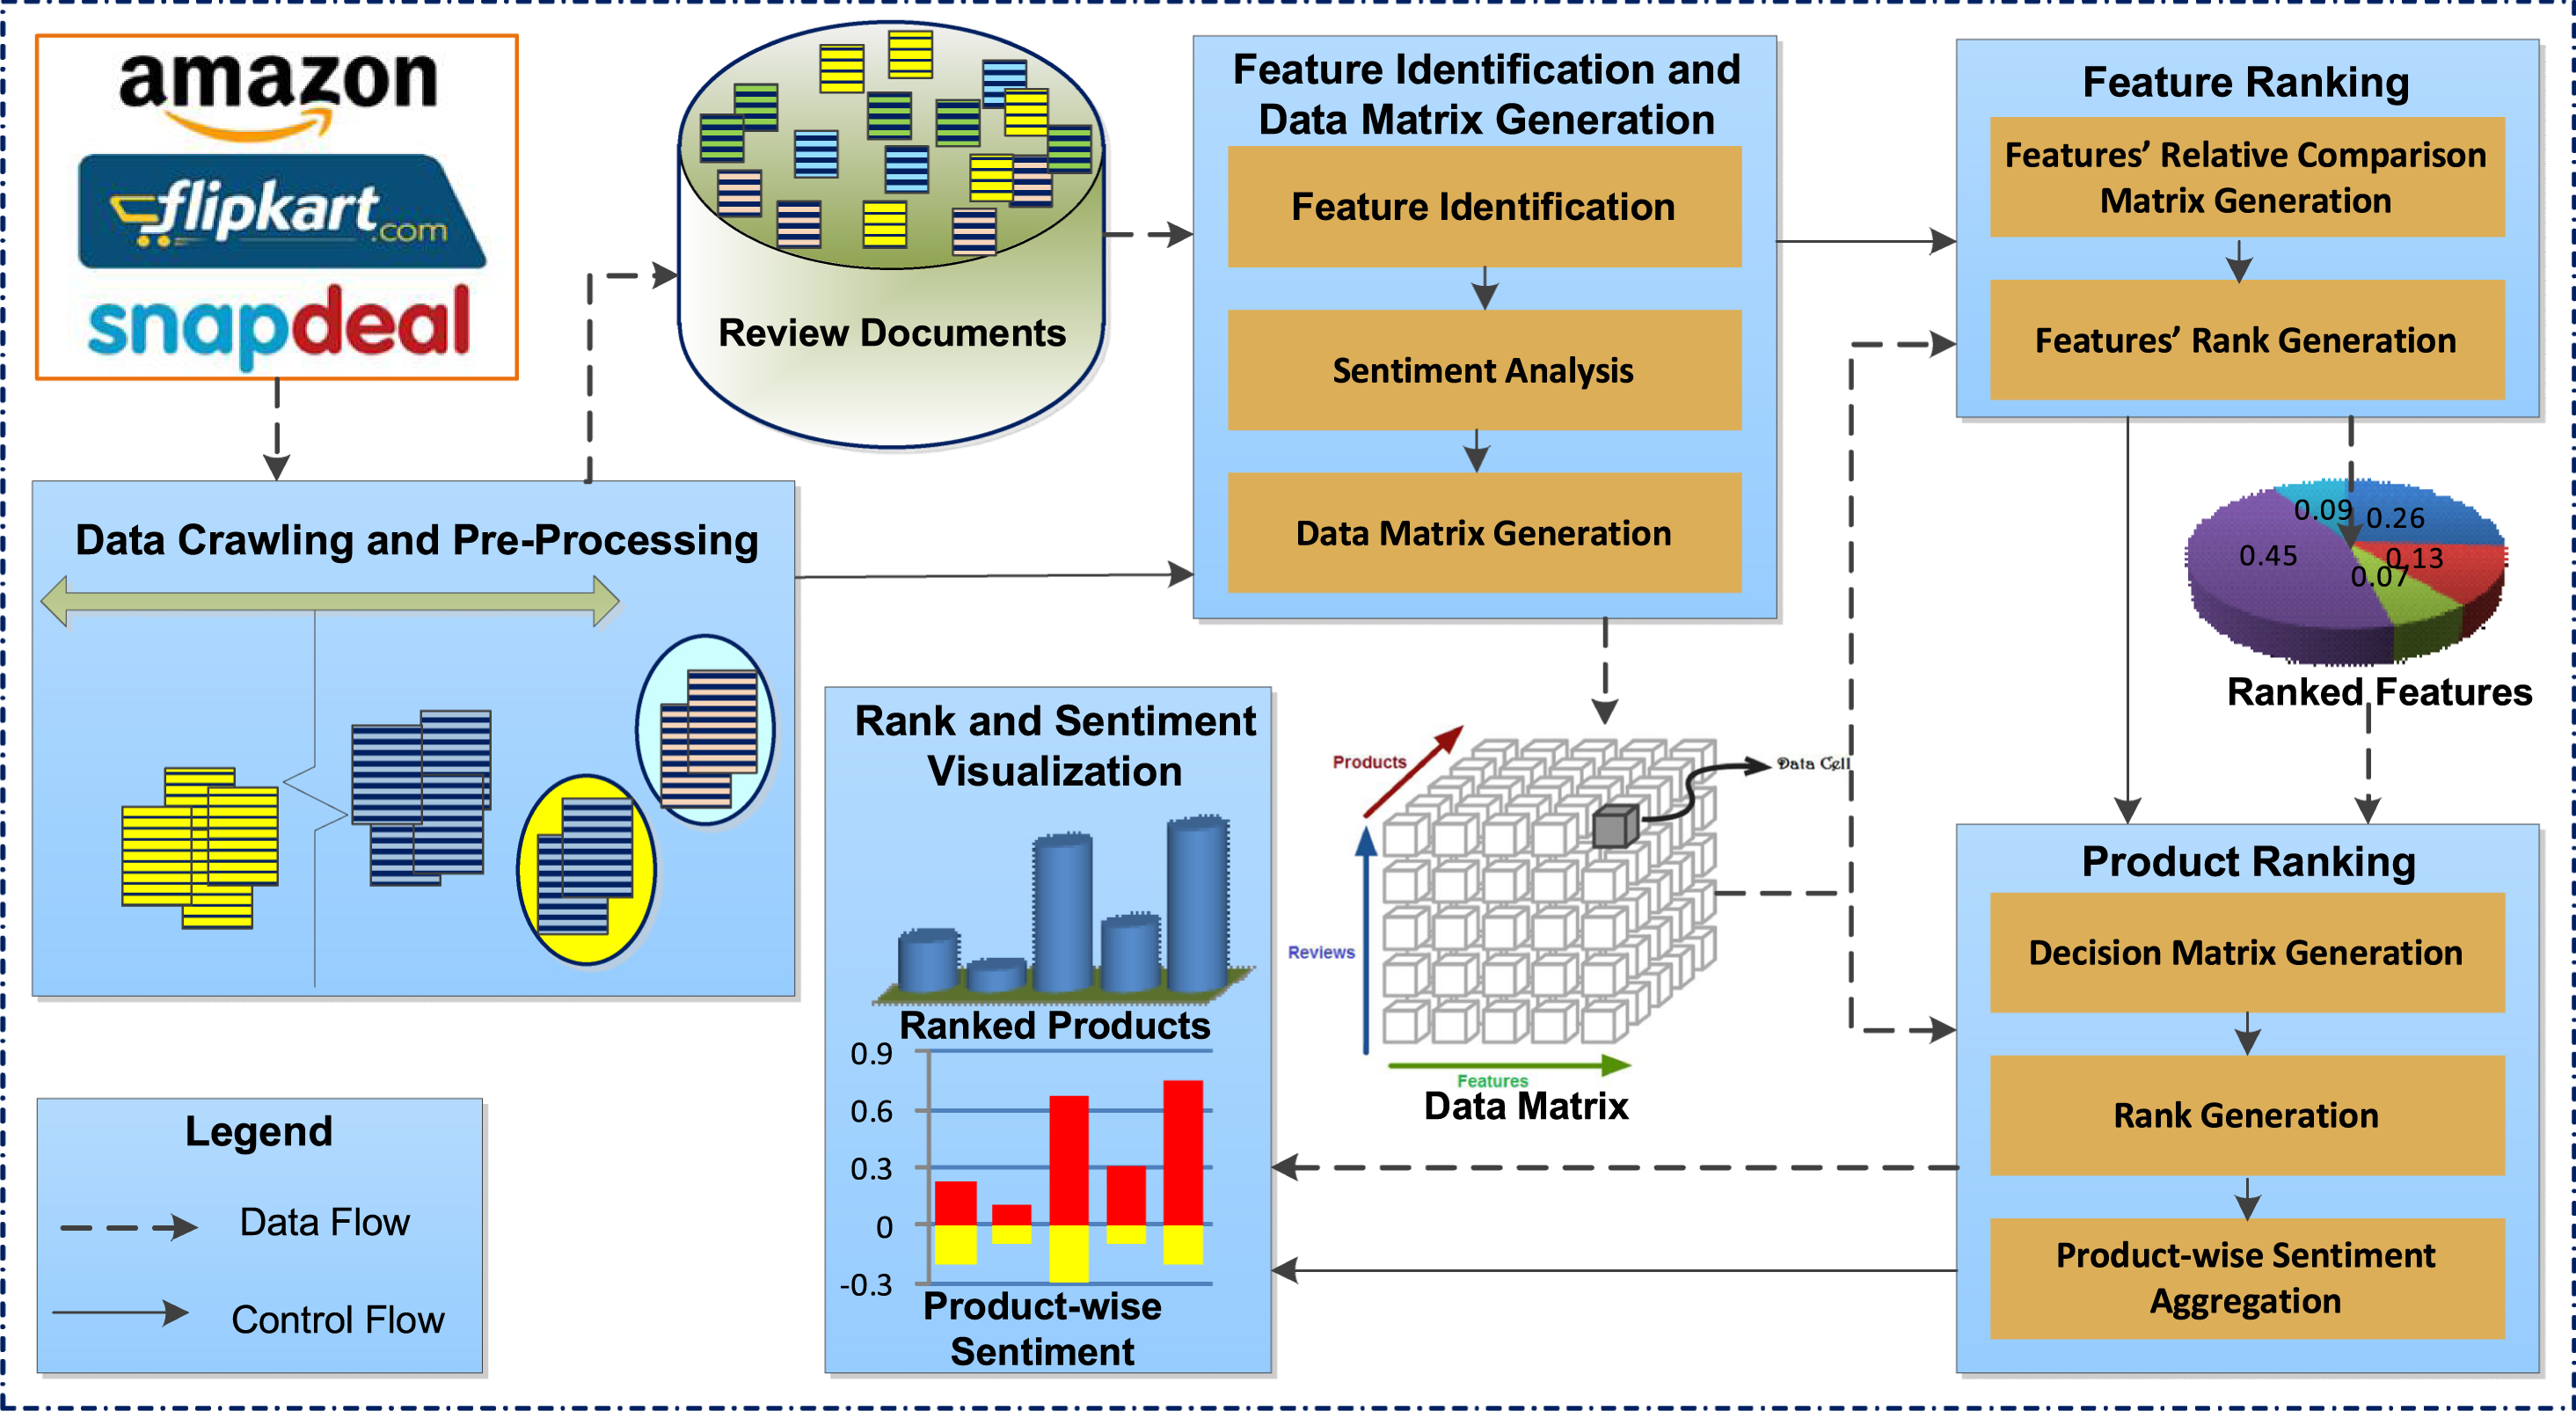
In this section, we present the functioning details of the proposed opinion-based multi-criteria ranking (OMCR) approach. Figure 2 presents the work-flow of the OMCR, which mainly performs five different but related functionalities, such as data crawling and pre-processing, feature identification and data matrix generation, feature ranking, product ranking, and rank and sentiment visualization. Further details about these functionalities are presented in the following sub-sections.
Work-flow of the proposed OMCR approach.
Data crawling and pre-processing
This section present a brief detail of the data retrieval and pre-processing processes. We have used import.io, which is a web-based tool to fetch customer reviews from e-commerce websites and store them in a tabular form. We have considered three popular e-commerce websites, such as Amazon, Flipkart, and Snapdeal for data crawling. For a particular product category, import.io is able to retrieve various review-related information, such as price, launch date, total number of reviews, reviewer id, user name, post date, star rating, user verification status, review title, review content, review usefulness, etc. Out of these, OMCR uses only five attributes like star rating, review title, review content, user verification status, and review usefulness that are significant
Exemplar reviews of iPhone 7 and Google Pixel smartphones
It’s nice to see IPhone 7… it’s like butter in stomach. Very excellent‥ working as expected
1
0
1
Defective phone
Although the product is great hardly 4 days old the sounds and ringtone isn’t working. Checked all the settings but no use. Bad experience.
1
1
Flipkart
5
NYC experience
Good delivery speed by Flipkart and my new iPhone is awesome.
1
10
Snapdeal
5
Super product
Awesome product, super fast and amazing UX.
1
6
Amazan
3
Heat problem
Gets heated in compact box. When it came it was already heated
1
1
Google pixel
Flipkart
5
Brilliant
Great phone. Camera is too good.
1
76
Snapdeal
4
Excellent product
Just love it
1
1
*SR: star rating; UVS: user verification status; RU: review usefulness
in online products ranking. Table 3 presents a small set of customer reviews of iPhone 7 and Google Pixel smartphones retrieved from the e-commerce websites mentioned above.
Feature identification and data matrix generation
The task of this module is to identify different reviews-related information components, such as star rating, review title, review content, user verification status, and review usefulness to generate data matrix from the review documents. Out of total five features, the values of three features (star rating, user verification status, and review usefulness) are numeric, whereas the values of the remaining two features (review title and review content) are textual, that are subjected to a sentiment analysis system to assign numeric scores representing the sentiment polarity of the users expressed in the review title and contents. We have used the NLTK TextBlob for sentiment analysis purpose. The TextBlob identifies statistical and linguistic features from a review document and classifies them as positive, negative, or neutral, depending on the sentiment score calculated using the SentiWordNet dictionary. SentiWordNet is a lexical resource in which each word is associated with a positive, negative, and objective scores, representing the respective degree of sentiment. The sentiment score of a review title and content (body) is determined as an aggregation of the sentiment scores of the opinionated words contained within them. Table 4 shows sentiment scores of the review titles and contents given in Table 3.
The data matrix is generated as a data cube in which X-axis represents features, Y-axis represents review documents, and Z-axis represents products. Each cell of the data matrix stores a numeric value, representing the feature value extracted from the review document of a particular product. Table 5 shows the data matrix corresponding to the sample reviews given in Table 3.
Sentiment scores extracted from the reviews of Table 3 using TextBlob
SN
Review Title
Score
Review Content
Score
1.
Five Stars
0.99
It’s nice to see IPhone 7… it’s like butter in stomach. Very excellent‥ working as expected
0.84
2.
Defective phone
–0.89
Although the product is great hardly 4 days old the sounds and ringtone isn’t working. Checked all the settings but no use. Bad experience.
–0.66
3.
NYC experience
0.82
Good delivery speed by Flipkart and my new iPhone is awesome.
0.94
4.
Super product
0.64
Awesome product, super fast and amazing UX.
0.91
5.
Heat problem
–0.68
Gets heated in compact box. When it came it was already heated
–0.52
6.
Brilliant
0.88
Great phone. Camera is too good.
0.86
7.
Excellent product
0.96
Just love it
0.99
Data matrix corresponding to reviews given in Table 3
*SR: star rating; UVS: user verification status; RU: review usefulness
Feature ranking
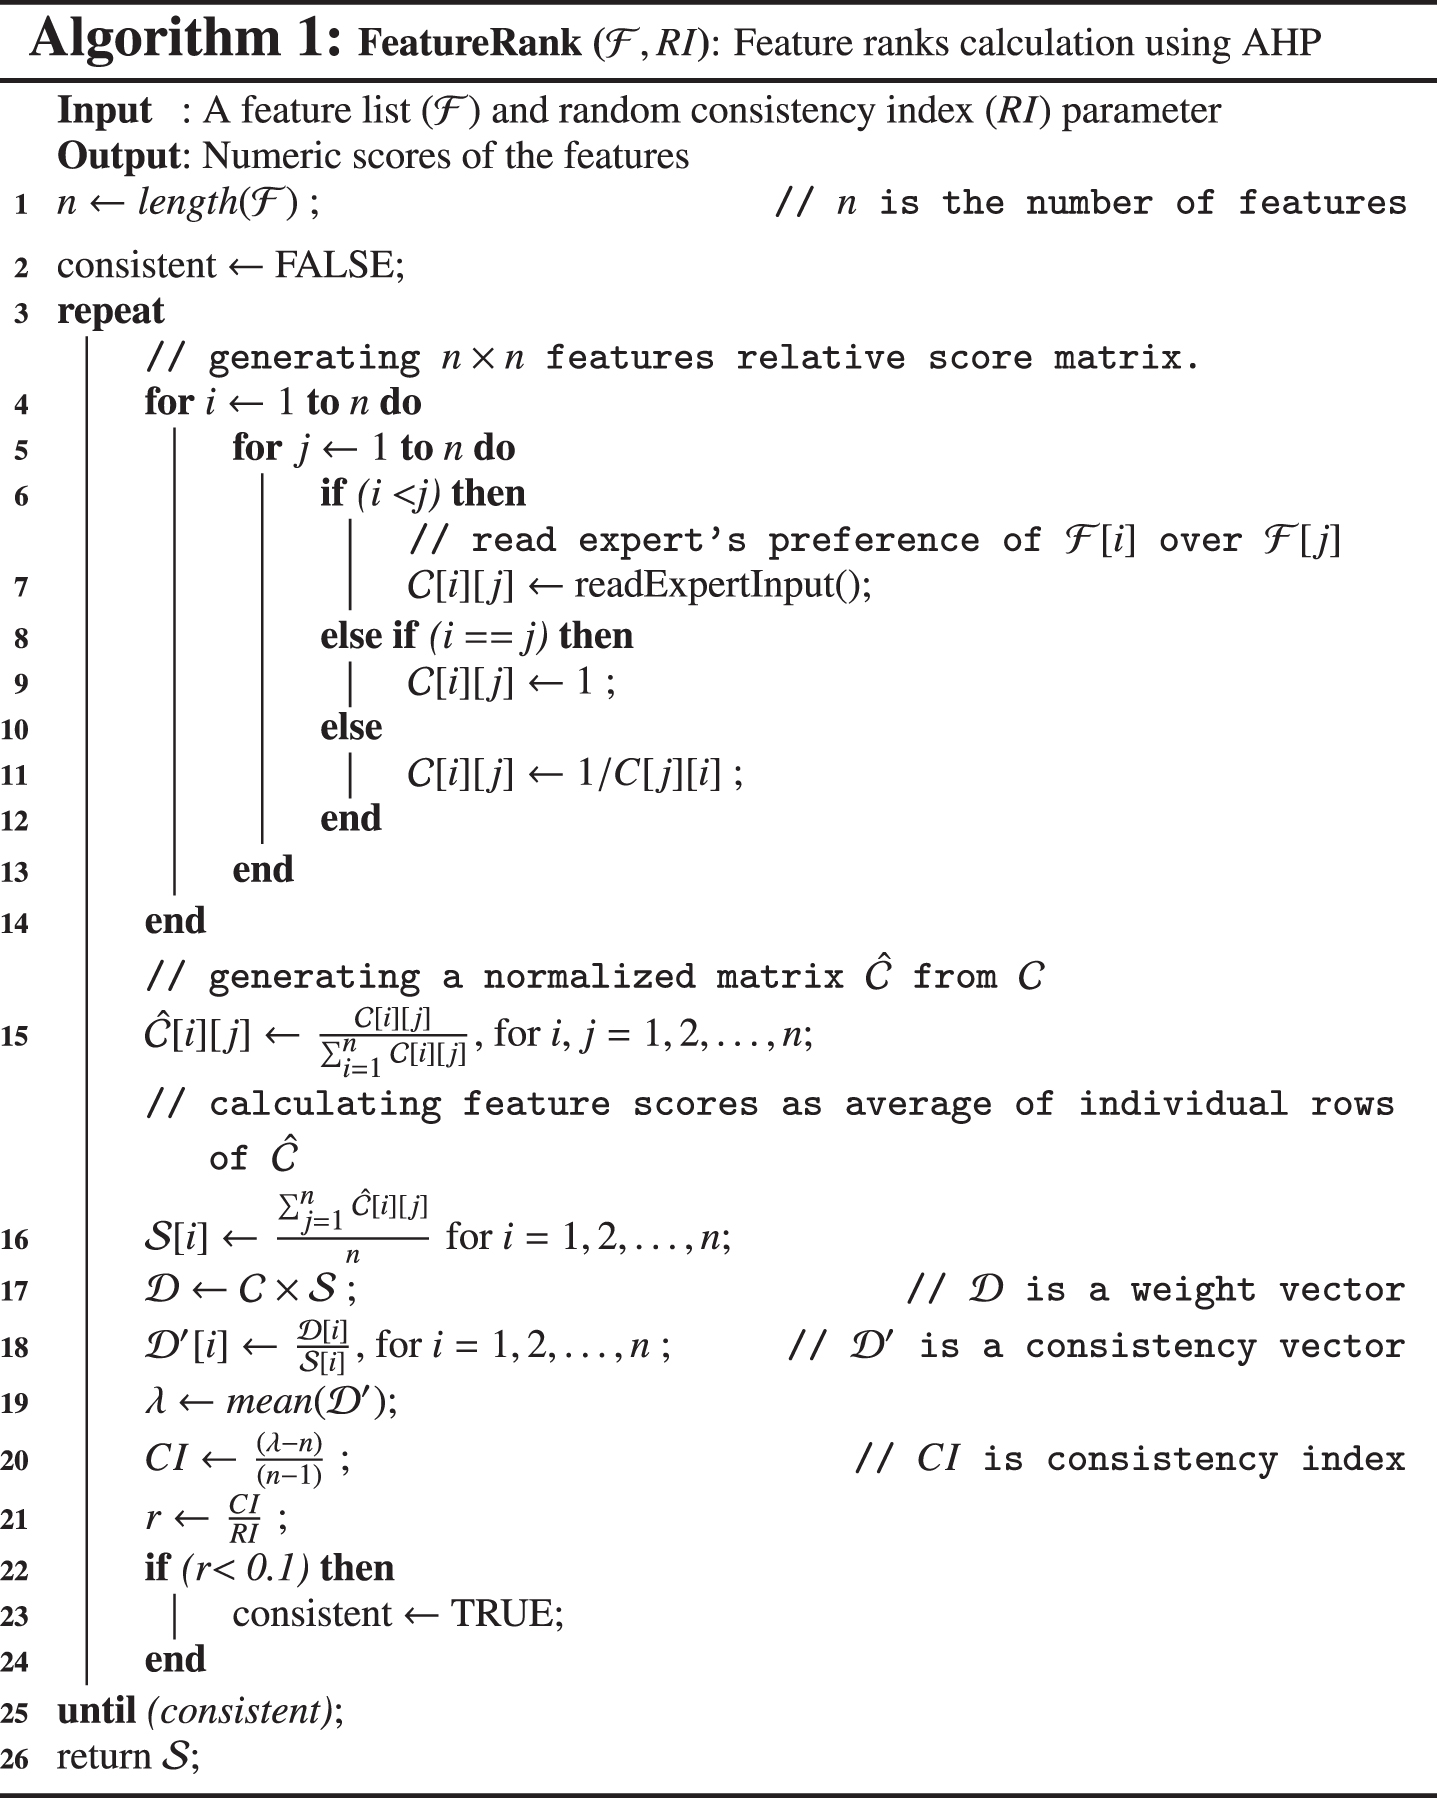
The feature ranking task aims to determine the relative importance of the features [18]. To this end, the feature ranking module of OMCR generates features relative score matrix using the expert’s inputs for each feature pairs. Algorithm 1 presents the feature ranking and consistency checking processes formally. Table 6 presents the expert’s inputs for relative scores of all possible feature pairs. Table 7 presents step-wise details, showing intermediate results of the features ranking and consistent checking processes using AHP. It can be seen in this table that the value of the consistency ratio (r) is 0.05, which is less than 0.1, and thereby features relative score matrix generated using expert’s inputs is consistent. The final rank scores of the features are shown in Table 8. It can be seen in this table that user verification status is ranked first with score 0.5, followed by the star rating feature with score 0.26, and review usefulness feature received lowest position with score 0.03.
Features relative score matrix
Preferences of pair-wise criteria
Score
Preference of star rating over review title
3
Preference of star rating over review content
5
Preference of star rating over user verification status
1/3
Preference of star rating over review usefulness
7
Preference of review title over review content
3
Preference of review title over user verification status
1/5
Preference of review title over review usefulness
5
Preference of review content over user verification status
1/7
Preference of review content over review usefulness
3
Preference of user verification status over review usefulness
9
Step-wise details of the features ranking process using AHP
; ;
. = ; ;
λ = 5.24
; RI (5) =1.12; (consistent)
Features and their rank scores generated using AHP
Feature
Rank
Rank score
Star rating
2
0.26
Review title
3
0.13
Review content
4
0.07
User verification status
1
0.50
Review usefulness
5
0.03
Product ranking
This section presents the product ranking process, which uses feature rank scores and data matrix as inputs to rank different alternatives of a product. Initially, a decision matrix of order m × n is generated using the data matrix, where m and n represent the number of alternatives (of a product) and features, respectively. is a real-valued matrix, in which an entry represents the preference of an alternative over other alternatives, with respect to the corresponding feature. is generated by taking the average of each features for each alternatives. In case of review title and review content features, averaging is done after normalization of their values in the scale of [0, 1] using min-max normalization. Equation 12 shows an exemplar decision matrix for two alternatives of smartphones (iPhone 7 and Google Pixel) and five features corresponding to the sample reviews given in Table 3. Finally, the decision matrix is used to rank the alternatives of a given product using TOPSIS.
The TOPSIS considers features rank score and decision matrix as inputs and ranks the alternatives using the procedure discussed in Section 3.2. Algorithm 2 presents the product ranking process using TOPSIS formally. Table 9 shows the intermediate results of ranking different alternatives of smartphone using TOPSIS with respect to the reviews given in Table 3.
Step-wise results of ranking smartphone alternatives with respect to the sample reviews given in Table 3
; ;
; ;
; ; ;
It may be noted that OMCR provides sentiment-based review aggregation for each alternatives of a product, in addition to the product ranking. To this end, it determines the percentage of positive, negative, and neutral reviews based on their sentiment scores recorded in the data matrix, which provides an abstraction of the alternatives, before going to the finer details to take an appropriate purchase decision. Table 10 presents sentiment aggregation for different alternatives of smartphone with respect to the sample reviews given in Table 3.
Sentiment aggregation for different alternatives of smartphone with respect to the sample reviews given in Table 3
Smartphones
Number of reviews
Percentage of reviews
Positive
Negative
Neutral
Positive
Negative
Neutral
iPhone 7
3
1
0
75%
25%
0%
Google Pixel
2
1
0
67%
33%
0%
Rank and sentiment visualization
Bar charts spanning only in the first quadrant of the Cartesian coordinate system are used for alternatives’ rank visualization, in which the height of a bar corresponds to the rank score of the respective alternative. On the other hand, the sentiment polarity values of the alternatives are visualized using the bar charts spanning in both first and fourth quadrants of the Cartesian coordinate system, in which the portions of the bar lying in the first quadrant represents the percentage of positive reviews and that the portion lying in the fourth quadrant represents the percentage of the negative reviews of an alternative.
Experimental setup and results
This section presents experimental results obtained from two real datasets related to electronic products – smartphone and hard disk drive. Review documents were crawled from three popular e-commerce websites Amazon, Flipkart, and Snapdeal using import.io tool. After pre-processing of the reviews, features values were extracted and stored in a data matrix. Thereafter, features relative score matrix was generated using expert’s input and analyzed using FeatureRank algorithm (Algorithm 1) for features rank generation. Table 8 presents the rank scores of all five features considered in our experiment. Finally, the features rank vector and data matrix were processed using ProductRank algorithm (Algorithm 2) to rank different alternatives of the electronic products.
For smartphone, we have considered five different alternatives namely Google Pixel, HTC Desire 10 Pro, iPhone 7, Lenovo Z2 Plus, and Samsung Galaxy S7 Edge, and downloaded reviews from all three websites mentioned above. Table 11 shows the statistics of the smartphone dataset. Table 12 presents the decision matrix generated from the smartphone dataset, and Table 13 presents the rank of the various alternatives of the smartphone obtained by ProductRank algorithm. It can be observed from this table that Samsung Galaxy S7 Edge is ranked at first with score 0.75, followed by iPhone 7 with score 0.67, and rest of the alternatives have received lower ranks. Figure 3 presents a visualization of the ranks of the various smartphone alternatives. Table 14 presents the sentiment aggregation of the smartphone alternatives and Fig. 4 presents its visualization.
Visualization of different alternatives of the smartphone.
Visualization of sentiment aggregation for different alternatives of the smartphone.
Statistics of the smartphone dataset
Smartphones
Number of reviews
Total #reviews
Amazan
Flipkart
Snapdeal
Google Pixel
113
180
9
302
HTC Desire 10 Pro
100
120
4
224
iPhone 7
702
1116
121
1939
Lenovo Z2 Plus
2179
310
224
2713
Samsung Galaxy S7 Edge
307
135
3
445
Decision matrix generated from the smartphone dataset
Smartphones
Star rating
Review title
Review content
User verification status
Review usefulness
Google Pixel
3.9330
0.6686
0.6803
0.7168
21.3375
HTC Desire 10 Pro
3.9611
0.7208
0.6747
0.6739
4.4278
iPhone 7
4.3583
0.7226
0.7286
0.9036
6.0267
Lenovo Z2 Plus
3.7679
0.6294
0.6194
1.0000
4.0877
Samsung Galaxy S7 Edge
4.4526
0.6710
0.7329
0.7360
18.9450
Ranks of different alternatives of the smartphone
Smartphone
Rank
Rank score
Google Pixel
4
0.23
HTC Desire 10 Pro
5
0.10
iPhone 7
2
0.67
Lenovo Z2 Plus
3
0.30
Samsung Galaxy S7 Edge
1
0.75
Sentiment aggregation of different alternatives of the smartphone
Smartphones
Number of reviews
Percentage of reviews
Positive
Negative
Neutral
Positive
Negative
Neutral
Google Pixel
204
87
11
67.55%
28.81%
3.64%
HTC Desire 10 Pro
158
60
6
70.54%
26.79%
2.68%
iPhone 7
1469
400
70
75.76%
20.63%
3.61%
Lenovo Z2 Plus
1517
924
272
55.92%
34.06%
10.03%
Samsung Galaxy S7 Edge
319
98
28
71.69%
22.02%
6.29%
For hard disk drive too, we considered five different alternatives manufactured by different companies namely Samsung M3 HDD, Seagate, Toshiba Canvio Basics, Transcend Storejet 25H3, and WD elements, and downloaded reviews from all three websites mentioned above. Table 15 shows the statistics of the hard disk drive dataset. Table 16 presents the decision matrix generated from the hard disk drive dataset, and Table 17 presents the rank of the various alternatives of hard disk drive obtained by ProductRank algorithm. It can be observed from this table that WD elements is ranked first with score 0.81, followed by Seagate with score 0.76, and rest of the alternatives have received lower ranks. Figure 5 presents a visualization of the ranks of the various alternatives of hard disk drive. Table 18 presents the sentiment aggregation of hard disk drive alternatives, and Fig. 6 presents its visualization.
Statistics of the hard disk drive dataset
Hard disks drives
Number of reviews
Total
Amazan
Flipkart
Snapdeal
#reviews
Samsung M3 HDD
378
130
281
789
Seagate
11769
350
3672
15791
Toshiba Canvio Basics
1415
250
1861
3526
Transcend Storejet 25H3
430
192
329
951
WD elements
6671
450
3836
10957
Decision matrix generated from the hard disk drive dataset
Hard disk drives
Star rating
Review title
Review content
User verification status
Review usefulness
Samsung M3 HDD
4.5229
0.7753
0.7504
0.8831
0.4417
Seagate
4.2729
0.7317
0.7296
0.9670
2.4685
Toshiba Canvio Basics
4.4397
0.7849
0.7684
0.9693
0.6081
Transcend Storejet 25H3
4.4224
0.7672
0.7244
0.9482
0.5666
WD elements
4.3761
0.7648
0.7544
0.9881
1.9459
Ranks of different alternatives of the hard disk drive
Hard disk drives
Rank
Rank score
Samsung M3 HDD
5
0.19
Seagate
2
0.76
Toshiba Canvio Basics
3
0.51
Transcend Storejet 25H3
4
0.42
WD elements
1
0.81
Sentiment aggregation of different alternatives of the hard disk drive
Hard disk drives
Number of reviews
Percentage of reviews
Positive
Negative
Neutral
Positive
Negative
Neutral
Samsung M3 HDD
664
96
29
84.16%
12.17%
3.68%
Seagate
12919
2309
563
81.81%
14.62%
3.57%
Toshiba Canvio Basics
2763
294
469
78.36%
8.34%
13.30%
Transcend Storejet 25H3
761
98
92
80.02%
10.30%
9.67%
WD elements
9061
910
986
82.70%
8.31%
9.00%
Visualization of different alternatives of the hard disk drive.
Visualization of the sentiment aggregation of different alternatives of hard disk drive.
Evaluation results
Since there is no standard benchmark showing the relative ranks of various smartphone and hard disk drive alternatives, we have taken the opinions of three domain experts for each product. All three experts were given the review documents and requested to provide a rank to each alternative in the range of 1 to 5, based on the reviews. Table 19 presents the ranks of different smartphone alternatives assigned by all three domain experts. It also shows the ranks of the alternatives determined by the OMCR approach. Similarly, Table 20 presents the ranks of different hard disk drive alternatives assigned by all three domain experts. It also shows the ranks of the alternatives determined by the OMCR approach.
Ranks of smartphone alternatives generated by OMCR and assigned by domain experts
ID
Smartphones
System generated rank (L)
Experts’ rank
L1
L2
L3
M1
Google Pixel
4
4
3
5
M2
HTC Desire 10 Pro
5
3
4
4
M3
iPhone 7
2
2
1
2
M4
Lenovo Z2 Plus
3
5
5
3
M5
Samsung Galaxy S7 Edge
1
1
2
1
Ranks of hard disk drive alternatives generated by OMCR and assigned by domain experts
ID
Hard disk drives
System generated rank (L)
Experts’ rank
L1
L2
L3
D1
Samsung M3 HDD
5
4
5
4
D2
Seagate
2
1
2
3
D3
Toshiba Canvio Basics
3
3
4
2
D4
Transcend Storejet 25H3
4
5
3
5
D5
WD elements
1
2
1
1
Thereafter, in order to compare different ranks, we have used set intersection method, which is generally used to compare two ranked lists in terms of their overlapping score [26]. The set intersection method calculates the fraction of content overlapping at different depths, and its novelty lies in the fact that unlike Kendall’s Tau method, it generates different overlapping scores for change in rank order at different positions.
Table 21 presents the calculation of the overlapping score of the ranked list generated by the OMCR with the ranked lists given by the experts for smartphone alternatives. It also provides average overlap score and aggregated average overlap score. Similarly, Table 22 presents the calculation of the overlapping score of the ranked list generated by the OMCR with the ranked lists given by the experts for hard disk drive alternatives. It also provides average overlap score and aggregated average overlap score. It can be seen from these tables that the aggregated average overlap score for smartphone and hard disk drive are 83.67% and 84.33%, respectively, which reflects that the ranks determined by the OMCR method is closer to the experts’ rank, and it can be used to rank various alternatives of products based on their multiple features automatically.
Overlapping score calculation for smartphone ranks generated by OMCR with the ranks given by the experts
Depth (k)
A={L@k}
Overlap score with L1
Overlap score with L2
Overlap score with L3
B = {L1@k}
|A ∩ B|/k
C = {L2@k}
|A ∩ C|/k
D = {L3@k}
|A ∩ D|/k
1
{M5}
{M5}
1/1 =1.00
{M3}
0/1 =0.00
{M5}
1/1 =1.00
2
{M5,M3}
{M5,M3}
2/2 =1.00
{M3,M5}
2/2 =1.00
{M5,M3}
2/2 =1.00
3
{M5,M3,M4}
{M5,M3,M2}
2/3 =0.67
{M3,M5,M1}
2/3 =0.67
{M5,M3,M4}
3/3 =1.00
4
{M5,M3,M4,M1}
{M5,M3,M2,M1}
3/4 =0.75
{M3,M5,M1,M2}
3/4 =0.75
{M5,M3,M4,M2}
3/4 =0.75
5
{M5,M3,M4,M1,M2}
{M5,M3,M2,M1,M4}
5/5 =1.00
{M3,M5,M1,M2,M4}
5/5 =1.00
{M5,M3,M4,M2,M1}
5/5 =1.00
Average overlap score
(1 +1 + 0.67 + 0.75 + 1)/5 = 0.88
(0 +1 + 0.67 + 0.75 + 1)/5 = 0.68
(1 +1 + 1 +0.75 + 1)/5 = 0.95
Aggregated average overlap score =
(0.88+ 0.68 + 0.95)/3 = 0.8367 = 83.67 %
Overlapping score calculation for hard disk drives ranks generated by OMCR with the ranks given by the experts
Depth (k)
A={L@k}
Overlap score with L1
Overlap score with L2
Overlap score with L3
B = {L1@k}
|A ∩ B|/k
C = {L2@k}
|A ∩ C|/k
D = {L3@k}
|A ∩ D|/k
1
{D5}
{D2}
0/1 =0.00
{D5}
1/1 =1.00
{D5}
1/1 =1.00
2
{D5,D2}
{D2,D5}
2/2 =1.00
{D5,D2}
2/2 =1.00
{D5,D3}
1/2 =0.50
3
{D5,D2,D3}
{D2,D5,D3}
3/3 =1.00
{D5,D2,D4}
2/3 =0.67
{D5,D3,D2}
3/3 =1.00
4
{D5,D2,D3,D4}
{D2,D5,D3,D1}
3/4 =0.75
{D5,D2,D4,D3}
4/4 =1.00
{D5,D3,D2,D1}
3/4 =0.75
5
{D5,D2,D3,D4,D1}
{D2,D5,D3,D1,D4}
5/5 =1.00
{D5,D2,D4,D3,D1}
5/5 =1.00
{D5,D3,D2,D1,D4}
5/5 =1.00
Average overlap score
(0 +1 + 1 +0.75 + 1)/5 = 0.75
(1 +1 + 0.67 + 1 +1)/5 = 0.93
(1 +0.50 + 1 +0.75 + 1)/5 = 0.85
Aggregated average overlap score =
(0.75+ 0.93 + 0.85)/3 = 0.8433 = 84.33 %
Conclusion and future work
In this paper, we have presented the development of an opinion-based multi-criteria product ranking (OMCR) approach to rank different alternatives of the online products, based on their reviews. The proposed approach seems very useful for online customers to make informed purchase decisions based on the concerns expressed by the existing customers in their reviews. The core functioning of the OMCR is based one FeatureRank and ProductRank algorithms. The FeatureRank algorithm aims to rank different features identified from meta-data and contents of the reviews, whereas ProductRank algorithm is used to rank different alternatives of the products using the features rank scores generated by the previous algorithm. The OMCR is also integrated with a visualization module to display both rank and sentiment polarity of different alternatives of the products. Though the evaluation results of the OMCR on smartphone and hard disk drive datasets are 83.67% and 84.33%, respectively, it can be further improved through introducing more appropriate review-and structure-based features. Review and user reliability is another important criteria that can be quantified and integrated with the OMCR to enhance its effectiveness.
References
1.
V.Belton and T.Gear, On a short-coming of saaty’s method of analytic hierarchies, Omega11(3) (1983), 228–230.
2.
E.Cano and M.Morisio, Hybrid recommender systems: A systematic literature review, Intelligent Data Analysis21(6) (2017), 1487–1524.
3.
M.Chae and J.Kim, Do size and structure matter to mobile users? an empirical study of the effects of screen size, information structure, and task complexity on user activities with standard web phones, Behaviour & Information Technology23(3) (2004), 165–181.
4.
C.H.Chen, L.P.Khoo and W.Yan, Evaluation of multicultural factors from elicited customer requirements for new product development, Research in Engineering Design14(3) (2003), 119–130.
5.
Y.Chou, C.Lee and J.Chung, Understanding m-commerce payment systems through the analytic hierarchy process, Journal of Business Research57(12) (2004), 1423–1430.
6.
M.C.Chuang, C.C.Chang and S.H.Hsu, Perceptual factors underlying user preferences toward product form of mobile phones, International Journal of Industrial Ergonomics27(4) (2001), 247–258.
7.
A.Denguir-Rekik, J.Montmain and G.Mauris, A possibilisticvalued multi-criteria decision-making support for marketing activities in e-commerce: Feedback based diagnosis system, European Journal of Operational Research195(2) (2009), 876–888.
8.
S.H.Han and S.W.Hong, A systematic approach for coupling user satisfaction with product design, Ergonomics46(13-14) (2003), 1441–1461.
9.
Y.-H.Hu, Y.-L.Chen and H.-L.Chou, Opinion mining from online hotel reviews a text summarization approach, Information Processing & Management53(2) (2017), 436–449.
10.
S.H.Han, K.J.Kim, M.H.Yun, S.W.Hong and J.Kim, Identifying mobile phone design features critical to user satisfaction, Human Factors in Ergonomics & Manufacturing14(1) (2004), 15–29.
11.
H.-Y.Hsieh and S.-H.Wu, Ranking online customer reviews with the SVR model, in: Proceedings of the 2015 IEEE 16th International Conference on Information Reuse and Integration, IEEE,2015, pp. 550–555.
12.
C.L.Hwang and K.Yoon, Multiple Attribute Decision Making: Methods and Applications A State-of-the-Art Survey,1st ed., Springer-Verlag, BerlinHeidelberg, 1981.
13.
G.Isiklar and G.Büyükózkan, Using a multi-criteria decision making approach to evaluate mobile phone alternatives, Computer Standards & Interfaces29(2) (2007), 265–274.
14.
A.Kamal, M.Abulaish and T.Anwar, Mining feature-opinion pairs and their reliability scores from web opinion sources, in: Proceedings of the 2nd International Conference on Web Intelligence, Mining and Semantics, WIMS'12, ACM, Craiova, Romania, 2012, pp. 15:1–15:7.
15.
E.Kujawski, Multi-Criteria Decision Analysis: Limitations, Pitfalls, and Practical Difficulties, Engineering Division, Lawrence Berkeley National Laboratory, Berkeley, Calif., URL: https://escholarship.org/uc/item/0cp6j7sj, 2003, pp. 1–8.
16.
K.Lakiotaki, N.F.Matsatsinis and A.Tsoukias, Multicrite-ria user modeling inrecommender systems, IEEE Intelligent Systems26(2) (2011), 64–76.
17.
Y.S.Lee, S.W.Hong, T.L.Smith-Jackson, M.A.Nussbaum and K.Tomioka, Systematic evaluation methodology for cell phone user interfaces, Interacting with Computers18(2) (2006), 304–325.
18.
M.Makrehchi and M.S.Kamel, Feature ranking fusion for text classifier, Intelligent Data Analysis16(6) (2012), 879–896.
19.
L.Mookiah, W.Eberle and M.Mondal, Personalized news recommendation using graph-based approach, Intelligent Data Analysis22(4) (2018), 881–909.
20.
J.-C.Pomerol and S.Barba-Romero, Multicriterion Decision in Management: Principles and Practice, vol. 25, 1st ed., SpringerUS, 2000.
21.
R.W.Saaty, The analytic hierarchy process-what it is and how it is used, Mathematical Modelling9(3-5) (1987), 161–176.
22.
T.L.Saaty, The Analytic Hierarchy Process: Planning, Priority Setting, Resource Allocation, 1st ed., McGraw-Hill, New York, 1980.
23.
J.L.Salmeron and I.Herrero, An AHP-based methodology to rank critical success factors of executive information systems, Computer Standard & Interfaces28(1) (2005), 1–12.
24.
M.C.Y.Tam and V.M.R.Tummala, An application of the AHP in vendor selection of a telecommunications system, Omega29(2) (2001), 171–182.
25.
M.Velasquez and P.T.Hester, An analysis of multi-criteria decision making methods, International Journal of Operations Research10(2) (2013), 56–66.
26.
W.Webber, A.Moffat and J.Zobel, A similarity measure for indefinite rankings, ACM Transactions on Information Systems28(4) (2010), 20:1–20:38.
27.
L.Xu and J.B.Yang, Introduction to multi-criteria decision making and the evidential reasoning approach, in: Working paper series, Paper No. 0106. ISBN:1 86115 111 X, 2001, pp. 1–21.
28.
K.Yang, Y.Cai, D.Huang, J.Li, Z.Zhou and X.Lei, An effective hybrid model for opinion mining and sentiment analysis, in: Proceedings of the 2017 IEEE International Conference on Big Data and Smart Computing,BigComp, IEEE, Jeju, South Korea, 2017, pp. 465–466.
29.
H.C.Yu, Z.Y.Lee and S.C.Chang, Using a fuzzy mul-ticriteria decision making approach to evaluate alternative licensing mechanisms, Information & Management42(4) (2005), 517–531.
30.
X.Yu, S.Guo, J.Guo and X.Huang, Rank B2C e-commerce websites in e-alliance based on AHP and fuzzy TOPSIS, Expert Systems with Applications38(4) (2011), 3550–3557.
31.
K.Zhang, R.Narayanan and A.Choudhary, Voice of the customers: Mining online customer reviews for product fea-turebased ranking, in: Proceedings of the 3rdWonference on Online Social Networks, WOSN’10, USENIX Association,Berkeley, CA, USA, 2010, pp. 11–11.