
Abstract
Improving network lifetime of Wireless Sensor Network (WSN) is the prime concern for researchers to enhance the monitoring duration and reducing risk due to automation. The node lifetime is mainly determined by - the number of bits transmitted and distance between the sender and receiver. The optimal selection of Cluster Head (CH) and relay node, avoids unnecessary loss of energy due to data sharing with long distance node. A Fuzzy logic based routing algorithm is designed to enhance the network lifetime by optimally selecting CH and relay node providing less number of bits transmitted. A threshold framework is designed to reduce the number of handshake signals, the Cluster Member (CM) starts its connection establishment and shares data once the threshold is reached, thereby improving the lifetime. The proposed algorithm when compared with LEACH protocol exhibits that the improvement with respect to lifetime is 1.44 times and with respect to throughput it is 1.17 times. Since the algorithm takes the average energy of cluster in account, equal distribution of load is observed. The unequal clustering exhibited by the proposed algorithm proves its resistance over Energy Hole and HOT SPOT problems.
Introduction
Continuous error free monitoring in the anti-third environment and in industrial application can only be satisfied through Wireless Sensor Network (WSN). This nature of WSN has driven many researchers in seeking a better routing algorithm to enhance the lifetime and monitoring duration [3, 34–36]. The lifetime of the WSN is mainly determined by the battery resource and resource to harvest energy. In case of power starving WSN, harvesting unit becomes absent seeking a novel Energy efficient routing protocol. The data retransmission, frequent election process to the network reduces the lifetime. Transmitting data to the inefficient node creates data loss and demands retransmission of the same data. The energy efficiency to the WSN can be brought through clustering architecture [1, 43]. The clustering architecture provides load sharing and extended network lifetime. The network lifetime is mainly determined by factors like a) individual node lifetime, b) optimal Cluster Head (CH) selection, c) next hop selection. The node energy dissipation is mainly determined by the distance between two nodes (sender-receiver) and number of bits transmitted. By optimally selecting the CH the energy dissipation due to transmission of data to a distant node can be minimized. Minimizing the information from sender to receiver would result in false data or unnecessary confusions among the nodes [2, 41]. However the data sharing could be done in a timely or threshold based framework resulting limited handshake signals [35, 36]. An amount of energy is lost during every handshake process for healthy data delivery. However this could also be minimized by reducing the number of handshake attempts without sacrificing healthy data transmission [6, 24]. Several authors [23, 38] have introduced the uncertain random renewal process, a novel technique in uncertain random process. Here it is assumed that the inter-arrival rates are random variables and the rewards mentioned are taken up as uncertain variables. In many papers, the data generation in the sensor node is considered to be Poisson in nature. The number of times that the radio turns on and off increases for higher data arrival rate. Most of the routing protocol does not account the energy dissipation due to radio on and off [4, 44]. In this paper the energy consumption of the sensor node is greatly reduced by fuzzy logic and stochastic modeling. The battery characteristics are modeled with fuzzy rules to make a fair decision on CH selection. The proposed algorithm also provides better throughput and resists energy hole attack in WSN. The fuzzy set is capable to map the regions of battery operating zone, distance between the sender and receiver into an evaluation range that possess lattice based structure [5, 45]. The fuzzy rules are formed through battery voltage curve, which clearly indicates the residual energy of the battery. The election of the sensor node as a CH is based on quality criterion like battery voltage, intra cluster distance and distance with the sink. The fuzzy helps in solving and taking precise decision in uncertain situations.
Related works
Major challenges on enhancing lifetime in WSN are provided in [20]. The Low Energy Adaptive Clustered Hierarchical (LEACH) protocol addressed in [43] elucidates the importance of clustering in WSN. The clustering scheme provides a novel solution to energy problem. The LEACH, a basic clustering protocol does not determine the residual energy, is unaware about HOT SPOT and energy hole problem [1, 30]. The LEACH algorithm does not guarantee a novel node to become a CH in each round. It is probabilistic method for CH election, does not provide CH rotation. Failure of CH rotation in an algorithm makes already elected CH to be a CH again. The LEACH –C algorithm [43] concentrates on clustering and HOT SPOT issue. However the clustering is not with respect to sink. The algorithm addressed in [12, 36] serves as the solution through mobile sink. Providing mobile sink can be addressed as better solution for a shorter Region of Interest (ROI) monitoring. The node mobility becomes unavailable with hazardous uneven monitoring zone. To improve the CH selection and increase the network lifetime many algorithms [10, 25] considers residual energy as one of the parameter, in this case the knowledge of residual energy is difficult to determine. The Fail Safe Fault Tolerant (FSFT) [9] and Thermal Aware Fail Safe Fault Tolerant (TA-FSFT) algorithm [14] provides solution to this approach by sensing battery voltage for CH determination. The Fuzzy based clustering scheme addressed in [32] elucidates the fuzzy based clustering algorithm for LEACH protocol. The article provides the solution to network lifetime based on fuzzy inputs (Battery power, Mobility and Centrality). The chance of being a CH is determined as Very Weak, Weak, Lower Medium, Medium, Higher Medium, Strong and Very Strong. The methodology does not consider energy dissipation due to handshake signal. However the healthy data transmission can only be ensured through proper relay node selection. The optimal threshold scheme addressed in [35, 36] provides solution to heterogeneous sensor network. The node deployment in agriculture and remote unattended monitoring is done with homogenous network widely. Vaibhav Godbole introduces a Fuzzy Clustering Algorithm (FCA) [42] which ensures to increase the network lifetime. In this method the radius of the cluster head is calculated based on two parameters namely; the residual energy and distance to base station. Fuzzy logic is employed to accomplish the radius calculation. The hot spot problem found in multi hop WSNs is eliminated because the load on the sensor nodes which are near the base station and which have low energy levels are reduced. This is because of the consideration of residual energy and distance to base station while calculating the radius. The routing algorithms designed in most of the article concentrates on reducing energy consumption with respect to distance. The possible way of enhancing the network lifetime is through a) limiting the number of bits transmitted b) reducing the distance between sender and receiver. This article concentrates the same by limiting the number bits transmitted- reducing the number of handshake signals.
Jiang et al. have introduced Fuzzy Logic Based Energy Optimized Routing (FLEOR) for WSNs which improves the network lifetime and achieves energy balance also [16]. Few parameters namely Degree of Closeness of node to the shortest path (DCSP), Degree of closeness of node to sink (DCS) and Degree of Energy Balance (DEB) is employed. DCSP ensures that the data forwarding path does not get deviated from the shortest path between the sender and sink. DCS determines the next hop neighbor node such that it is close to the sink which helps to save energy. It is proved that one hop is more energy efficient when compared to multi hop within one hop communication range of the sender. DEB uses the residual energy concept for selecting the next hop neighbor node. The above three parameters are given as inputs to the Fuzzy system and the output parameter is chance; which gives the next hop neighbor node. Energy efficiency goes with the first two parameters DCSP and DCS. Energy balance in routing goes with DEB. This algorithm provides good network lifetime and it performs well in terms of energy balance.
Chih-Lyang et al. [6] have developed a Fuzzy Decentralized Sliding mode control (FDSMC) for tracking the trajectory and avoiding obstacles of a car like mobile robot. To find the position of the CLMR and the obstacle, two Charge Coupled Device (CCD) cameras are installed. The images captured by the cameras are sent to the personal computer where the images are processed and using those details the reference trajectory for the CLMR is planned accordingly. Based on the reference trajectory the steering angle and the forward-backward velocity are calculated and is transmitted in a wireless fashion to CLMR. To perform the movements two motors are employed to control the steering angle and the forward-backward velocity. The two processors employed here are the personal computer and Digital Signal Processor. The personal computer is used to plan the reference trajectory and the digital signal processor is used to control the two dc motors. FDSMC consists of two parallel Fuzzy Sliding Mode Controls (FSMCs) which controls the CLMR.
Haining Shu et al. proves that Interval Type 2 Fuzzy Logic System (FLS) performs well when compared to the Singleton type 1 FLS [17]. In this paper, the simulation is carried for two placement scenarios namely square grid placement and hex grid placement. For the analysis of network lifetime, the minimum lifetime of the network is focused. In order to find this parameter, the following analysis is done: single node’s lifetime, how the position of the failed node’s are related, how many node failures results in network failure. Failure of multiple nodes might not result in network failure because the nodes that failed might not be neighbors. If two adjacent or neighboring nodes fail, then the network fails. The single node lifetime is modeled with the help of Gaussian Membership function with uncertain standard deviation. The sensor network lifetime analysis is done with the help of Interval Type 2 FLS named Type 2 Fuzzy Logic Lifetime Evaluator 2 (FLLE2). The fuzzy rules are framed separately for square grid placement and hex grid placement. The inputs to the Fuzzy system includes the remaining battery level of sensor nodes and the output is the minimum lifetime of the network. The Interval Type 1 FLLE1 and Interval Type 2 FLLE2 are compared for the two types of placements and it is proved that FLLE2 performs better.
In most of the clustering protocols the reclustering overhead poses to be a serious drawback. Peyman Naematollahi et al. introduced a Fuzzy-Based Hyper Round Policy (FHRP) technique [33] which is distributed, energy aware and scalable. The main aim of this paper is to improve the network lifetime by reducing the clustering overhead. In this procedure, the process is being split into hyperrounds. Each Hyper Round (HR) is divided into many rounds. Usually each round will have a set up phase but in this work each hyperround will have a single set up phase thereby reducing the clustering overhead. The HR length is not fixed and it varies based on the sensor node. To determine the length of hyperround fuzzy based approach is used. The inputs for the Fuzzy set include the relative distance and relative energy and HR length is the output. This methodology of dynamic reclustering reduces the clustering overhead which improves the network lifetime and scalability also.
Raja Al-Kiyumi et al. [39] introduced a novel approach named Distributed Energy aware Fuzzy Logic (DEFL) based routing algorithm. Here two important issues namely energy efficiency and energy balancing are considered. The fuzzy system implemented in this paper includes two fuzzy systems FS1 and FS2. Fuzzy System 1 (FS1) takes up the input as residual energy (RE); which is the remaining energy of a node. The output of the system is relay probability1 (RP1). If RE is low then RP1 will also be low. Fuzzy system 2 (FS2) takes up the input as the transmission energy (TE) and the energy drain rate (DR). The output of FS2 is Relay Probability (RP2). If TE is low; then RP2 will be high and if DR is high; then RP2 will be low. The inputs of FS2 might result in few conflicts but this can be resolved by the fuzzy approach. The relay probabilities paves way to obtain the link costs. The cost function of FS1 and FS2 are employed to obtain the aggregated cost function which gives the final link cost. Finally this algorithm proves to be energy efficient. This algorithm is scalable because of its distributed nature. It adapts according to the network conditions and balances both the energy efficiency and energy balancing parameters.
In this paper, the CH is selected based on the aggregated distance within the cluster, residual energy, and considering the distance between the sink and CH. When the CH reduces its energy below a particular value, reelection is claimed (i.e.) CH rotation is proceeded periodically to ensure the load being distributed evenly. The nodes are provided a fuzzy knowledge to determine the novel CH. The input to the fuzzy decision engine is given through input voltage, aggregate distance and distance to sink. A framework on limiting the handshake signal is also proposed based on the data arrival rate.
WSN plays a vital role in huge volume of monitoring applications whose lifetime mainly depends on energy consumption of individual nodes. Clustering technique is one way improving the network lifetime in which cluster heads forwards the data from node to base station. Hence, it becomes essential for optimal cluster head selection based on residual energy and distance. Fuzzy based optimal node selection highly improves the reliability of the cluster head selection process and it is highly applicable in clustering technique.
Proposed lifetime maximizing algorithm
The CH selection is done as the parameter of distance, residual energy and distance with sink of the corresponding nodes in the vicinity. The Average energy of the nodes in the vicinity provides better clustering and load sharing among nodes. The residual energy of the nodes is mainly determined by the voltage across the terminals, High battery terminal voltage signifies the presence of high residual energy across the battery. Figure 1 elucidates the relation of voltage and operation time.
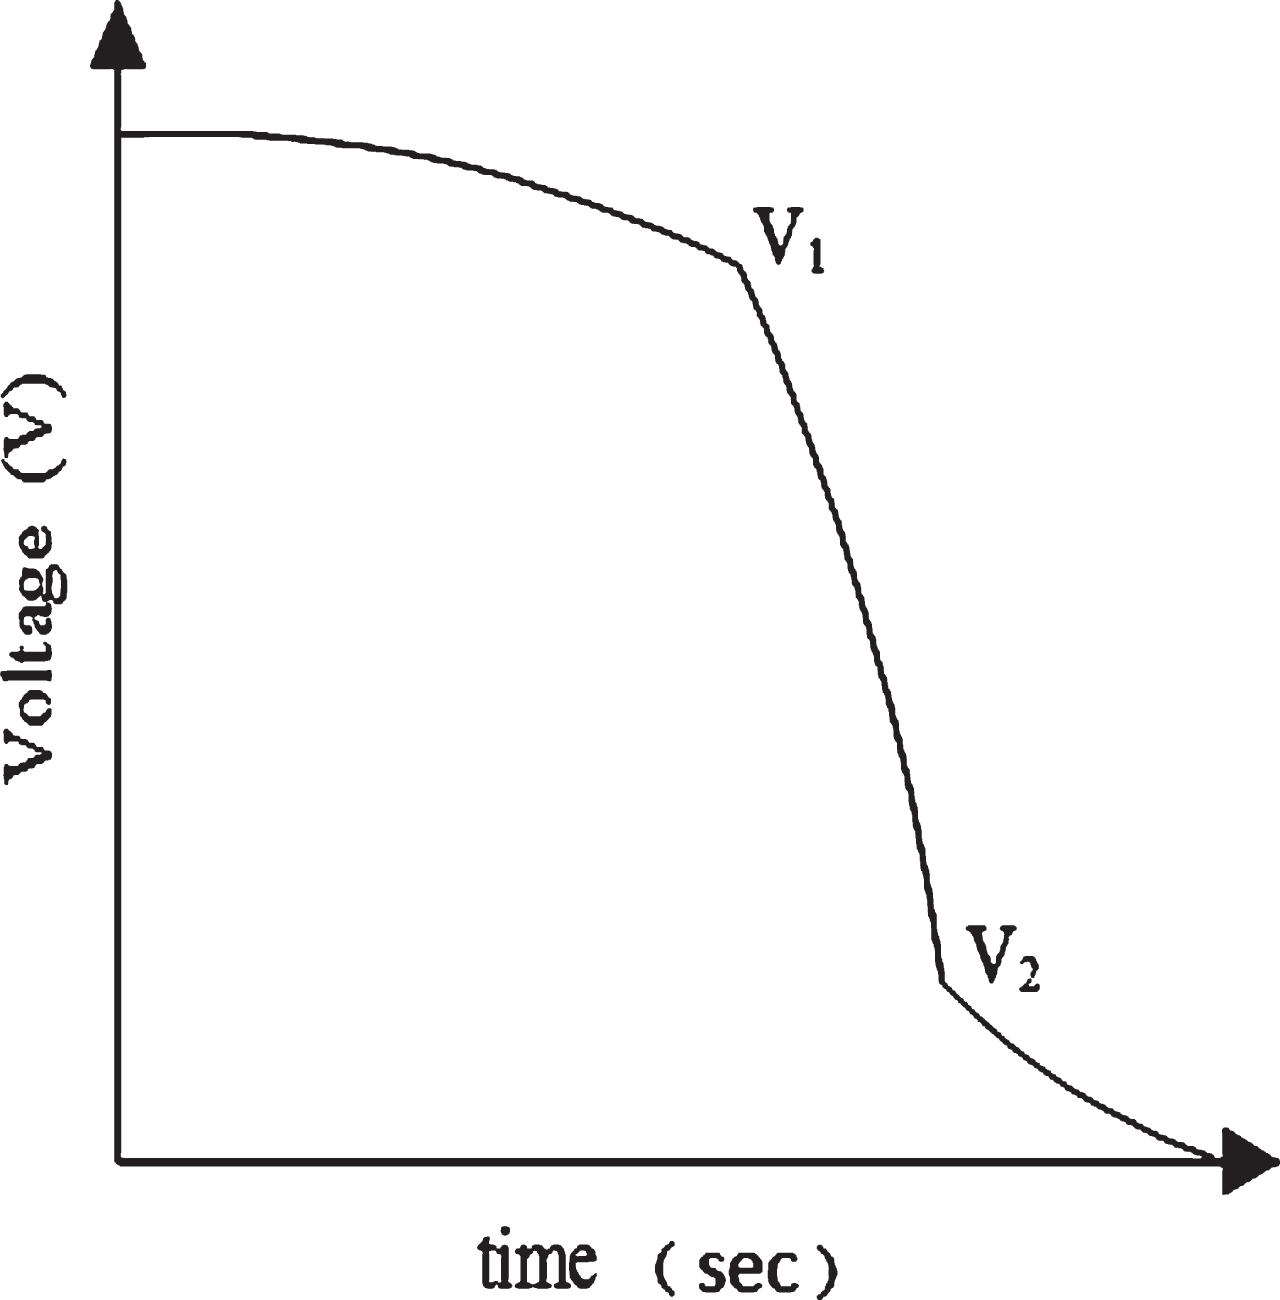
Battery voltage decay curve [30].
Equation (1) elucidates the battery decay process as given in figure.
V is the battery voltage, x1, y1, x2 and y2 are curve constants. The Voltage value of node is computed based on the Equation (1), V1 and V2 are battery cut off voltages used as threshold for CH selection [13, 14]. The battery decay after the point V1 would be drastic. The battery decay process is greatly determined by the load connected, connecting high load during the slope (V1 to V2) draws excess current to compensate the drop in voltage making it a chain effect. Since the CH in the network is overloaded, choosing a node having voltage greater than V1 would be solution to the problem addressed. About 95% of the energy consumed is through the transmitter and receiver unit, the energy consumed by the transceiving unit is determined by the radio model.
The transceiver module follows the second order radio model. The energy dissipated for the transmission and reception of a single bit is given in Equations (2) and (3). The energy dissipated is given in terms of the distance and the number of bits that has to be transmitted or received.
where
x : number of bits
d : distance
E txrx : Energy dissipated per bit to run the transmitter or the receiver circuit,
E rxd : Energy dissipated during receiving data
Efs,E mp : Energy dissipated per bit to run the
Transmit amplifier based on the distance
between the transmitter and receiver.
The CH selection is also determined by the intra cluster distance and average residual energy of the node in vicinity. Figure 2 illustrates the decision making engine inside the sensor node.

Decision engine inside the sensor node.
The routing table about the node position and current battery voltage is updated periodically through hello packet communication. The Fuzzy system takes the decision as discussed and selects the node role as a CH or CM. The distance between the nodes and current battery potential is shared through the hello packet. The node maintains the table on node position and node battery potential for reference and refreshes through the hello packet communication.
Fuzzy logic rule based architecture is designed for choosing the optimal CH selection. The present voltage of nodes in vicinity, their x, y location inside the Region of Interest (RoI) is given as the input to the Fuzzy logic decision making machine. Figure 3 illustrates the fuzzy input rule and output chance.
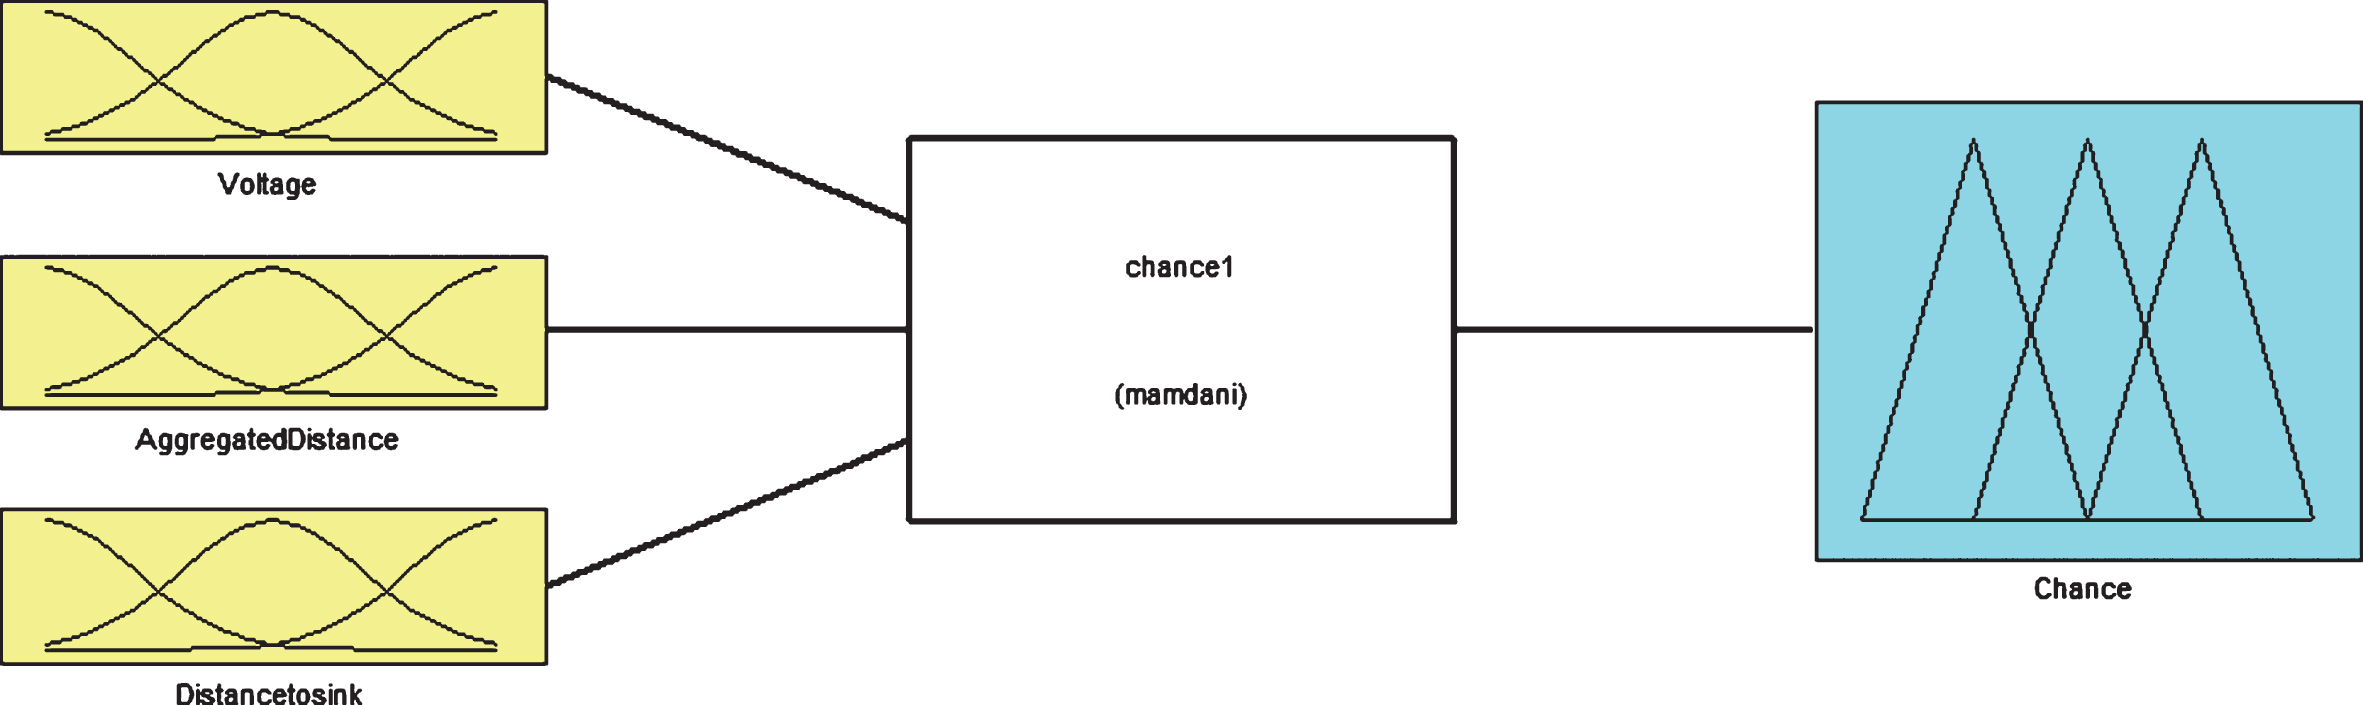
Fuzzy system (Mamdani).
Figure 3 illustrates the fuzzy relation with Voltage, Aggregate Distance and Distance to sink. The Mamdani model is used for detecting the failure of chance of being a CH (0, 1). Figure 4–6 illustrates the fuzzy rules for CH selection. The input to the fuzzy system is given by hello packet transmission and the nodes maintain the network topology.
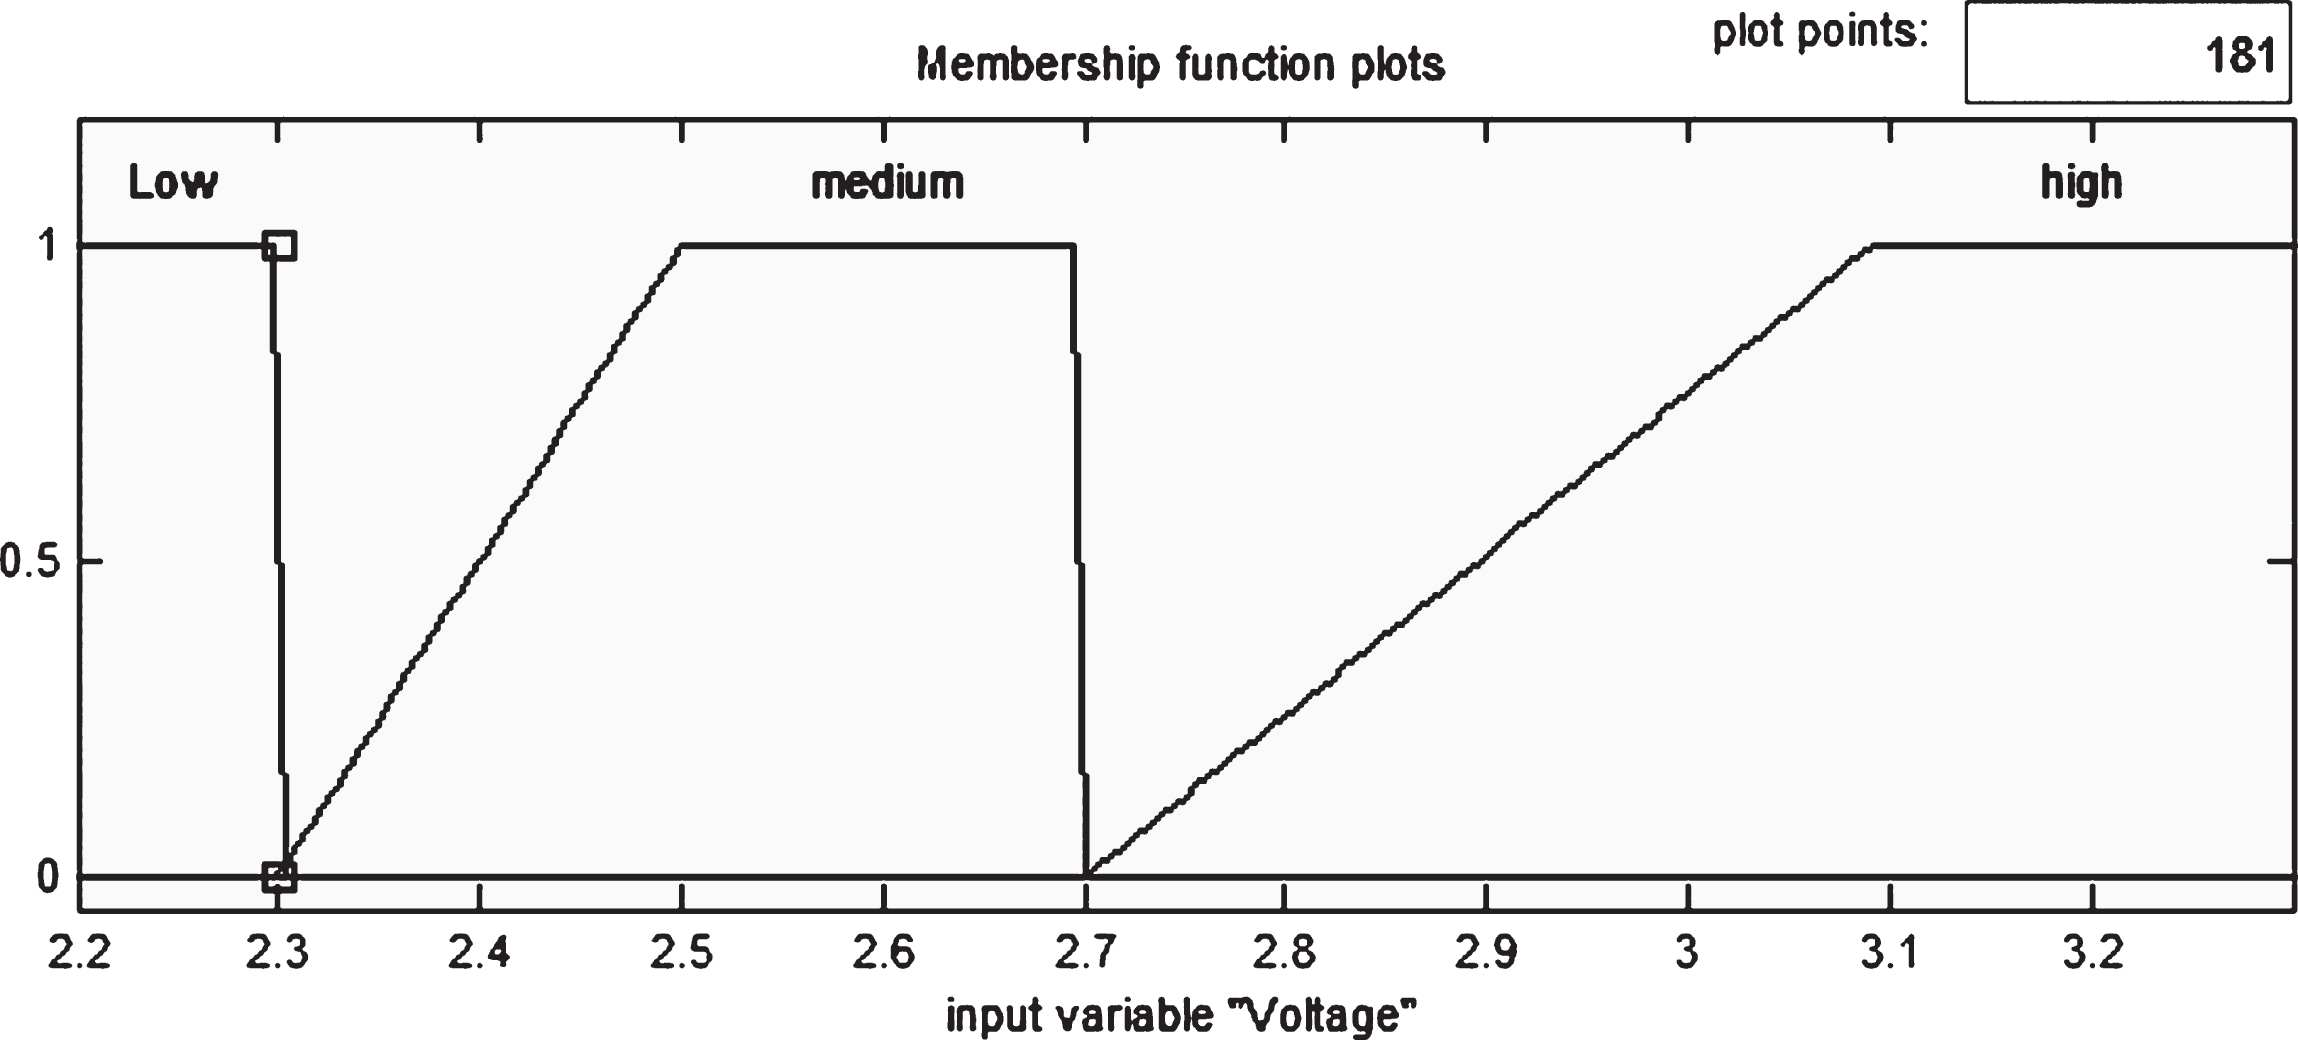
Fuzzy membership functions for voltage logic.
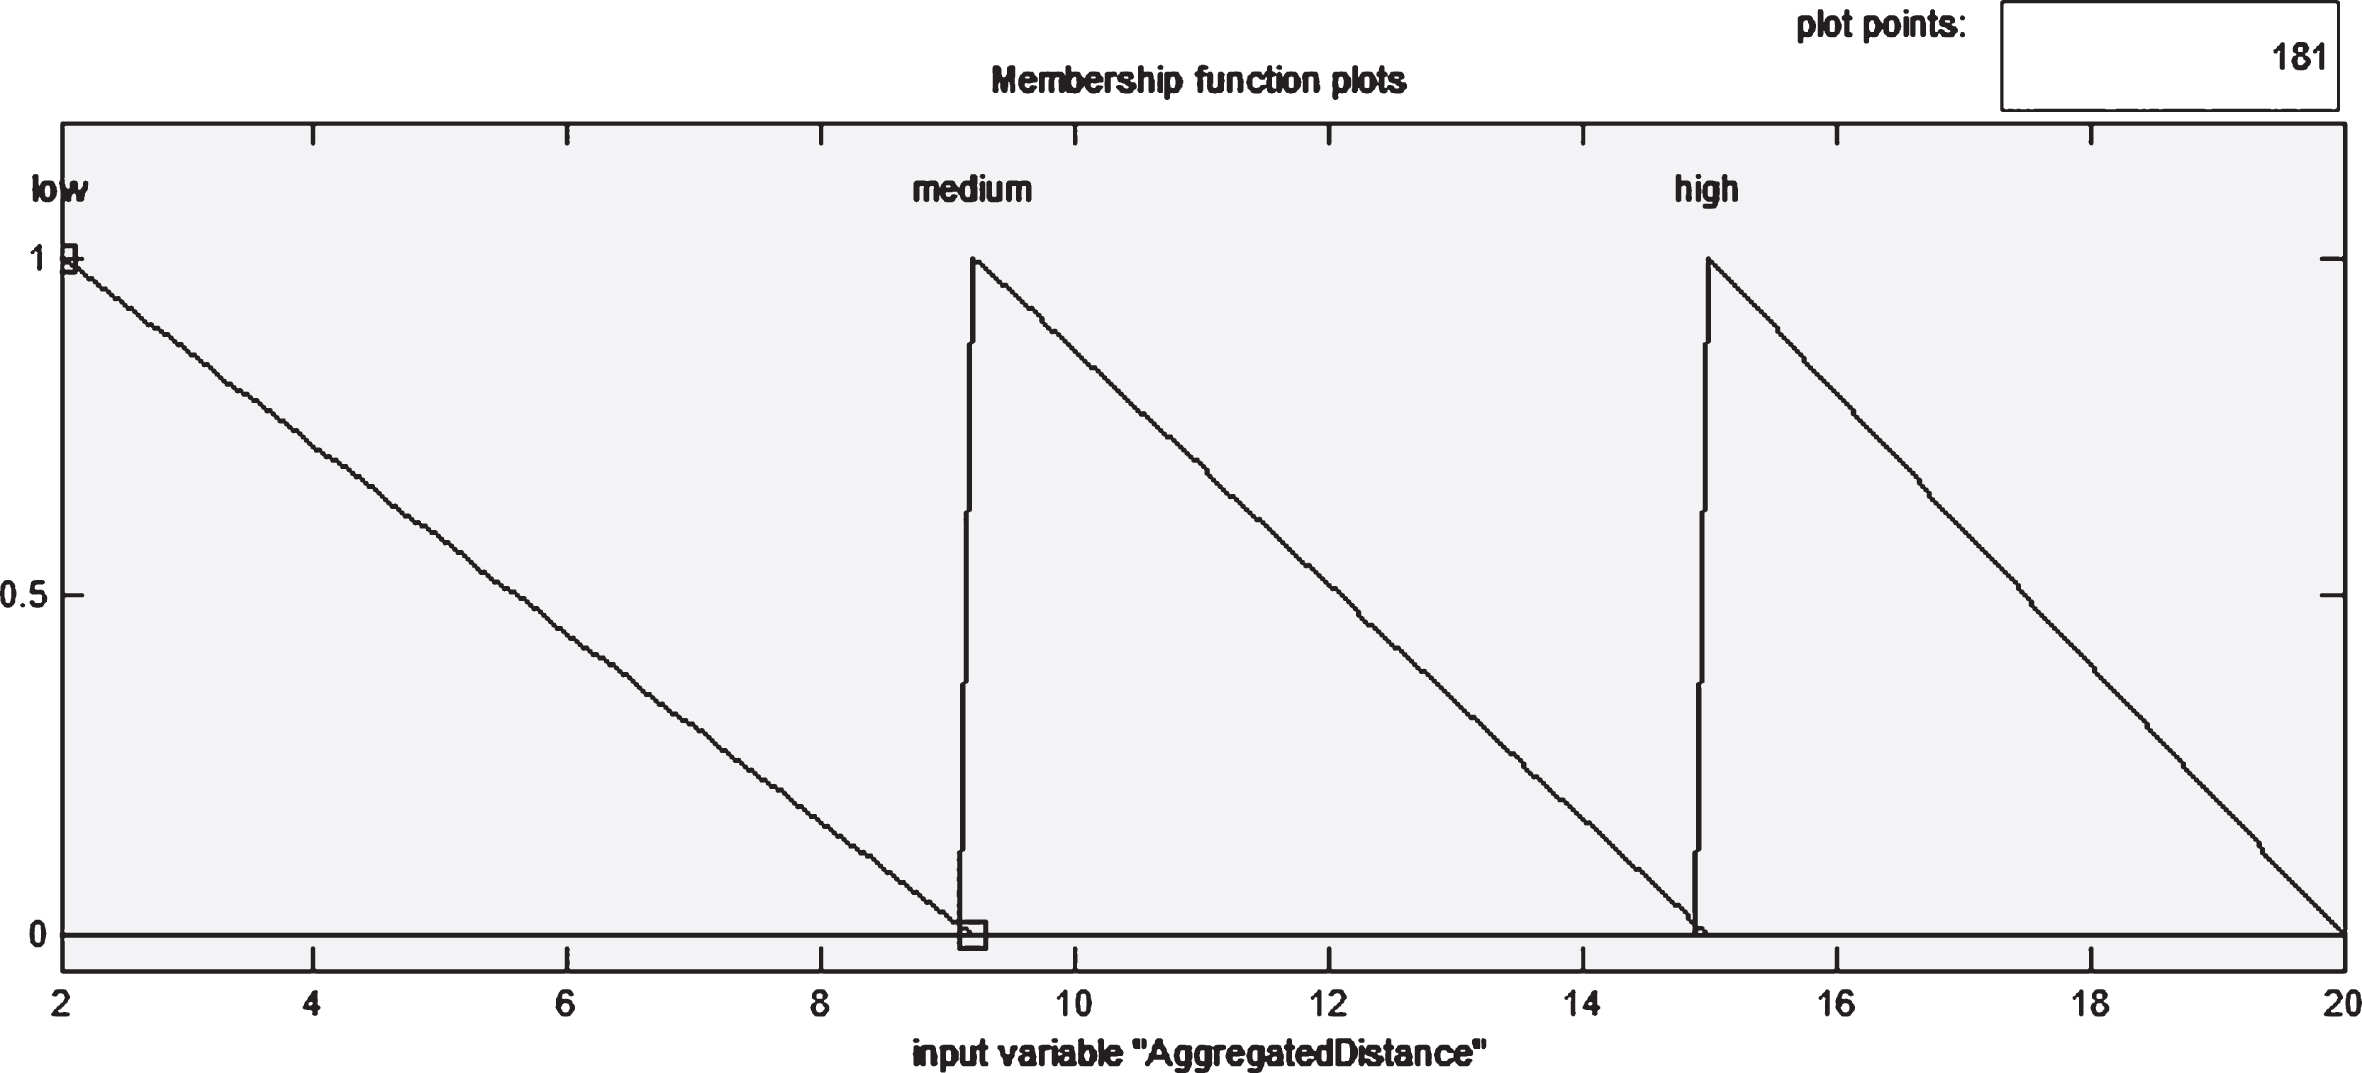
Fuzzy membership functions for aggregate distance.
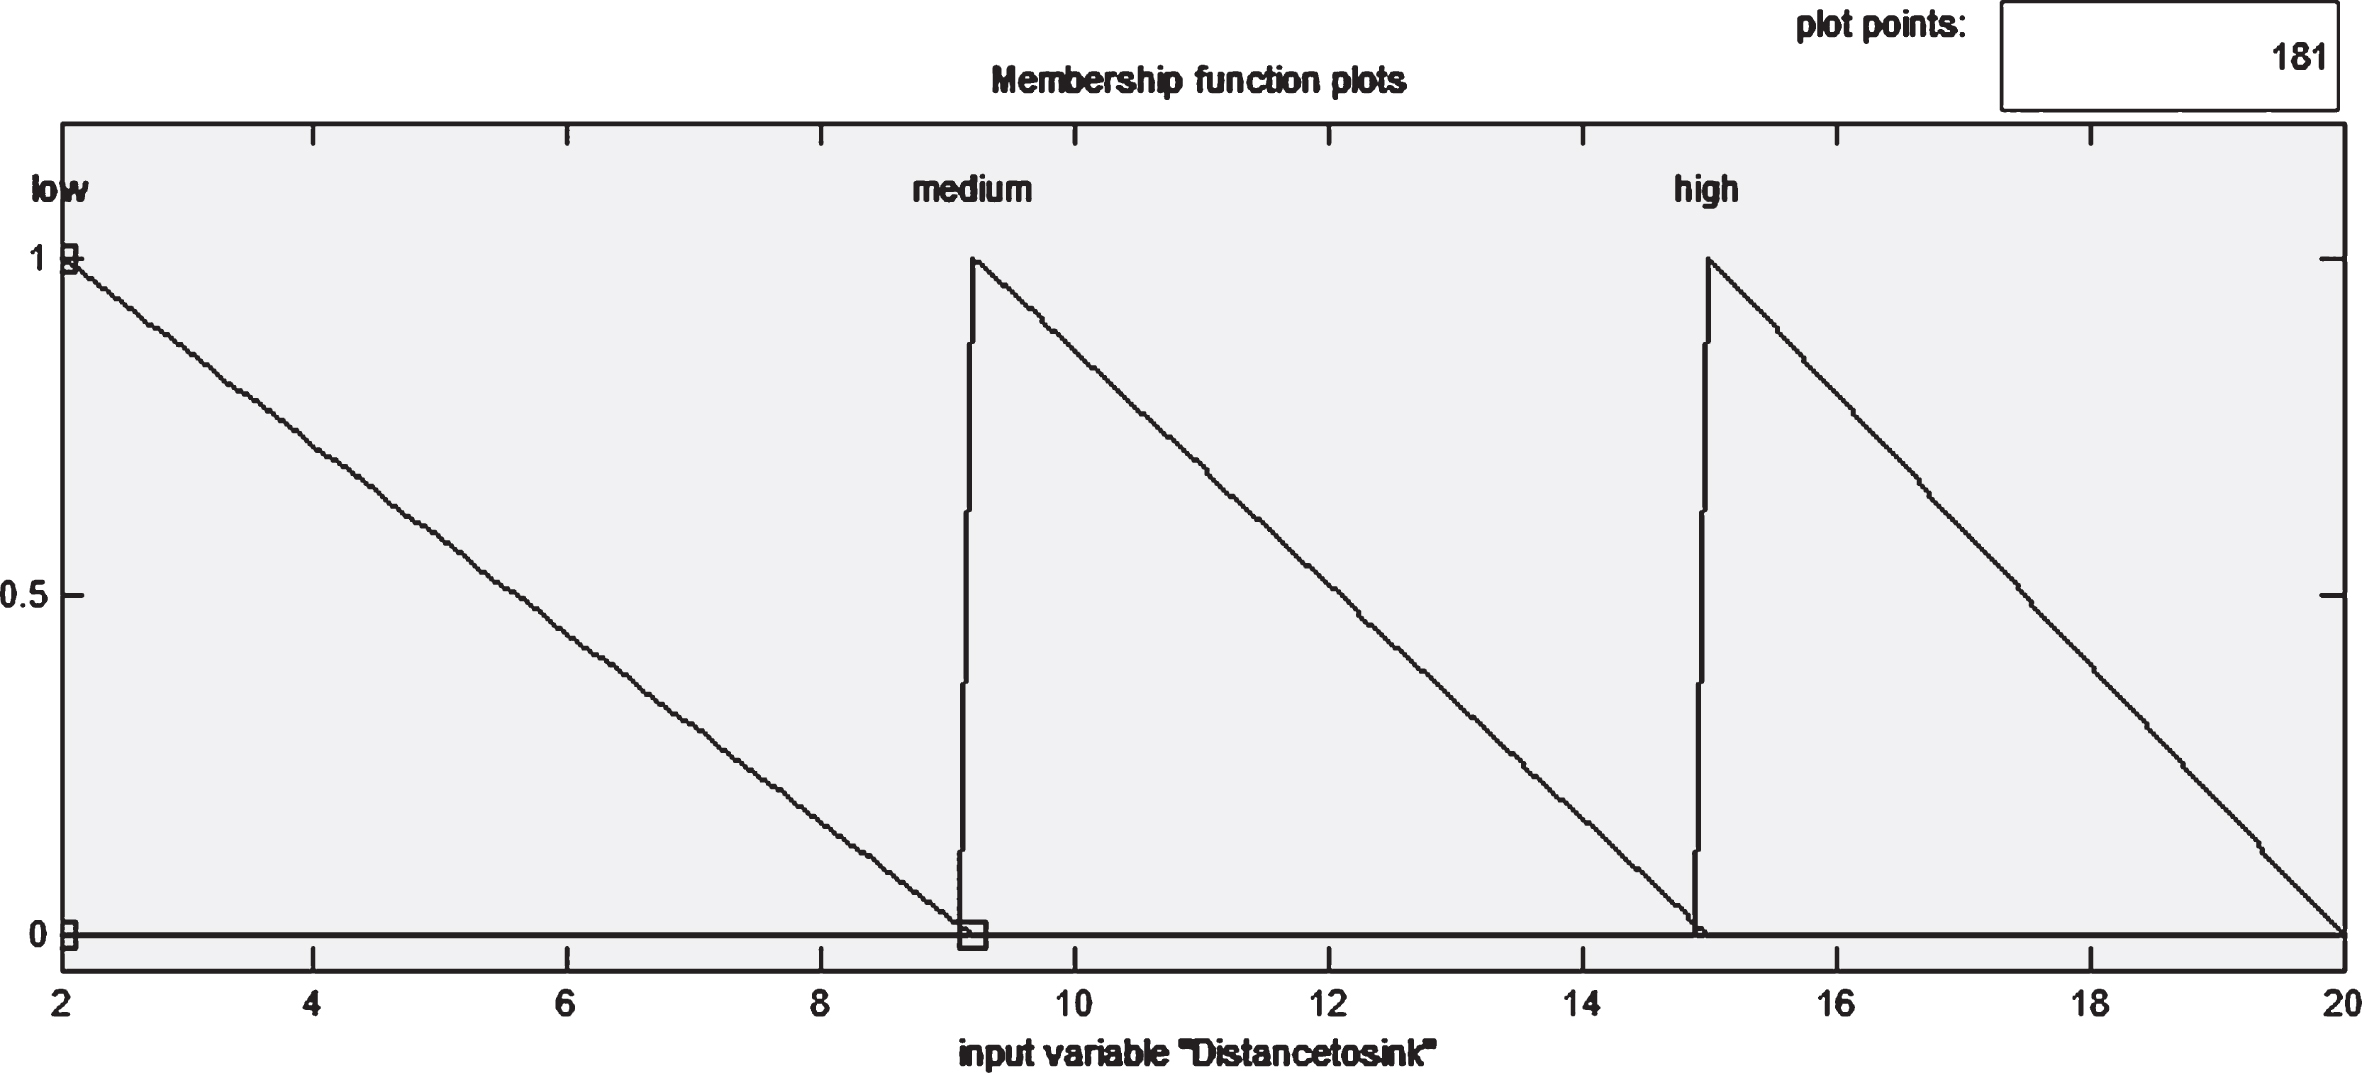
Fuzzy membership functions for distance to sink.
Table 1 illustrates the fuzzy rules involved in CH determination. Figure 7 relates the failure of chance of becoming a CH with respect to voltage, aggregate distance within cluster and distance between the corresponding node and sink. The chance of being a CH is determined as Best, Best-1, Best-2, Best-3, Best-4 and Worst. Once the nodes loose its energy below V1, the node claims a reelection and seeks a node to be a CH within its vicinity. Algorithm 1 provides the steps involved in CH selection.
Fuzzy rules
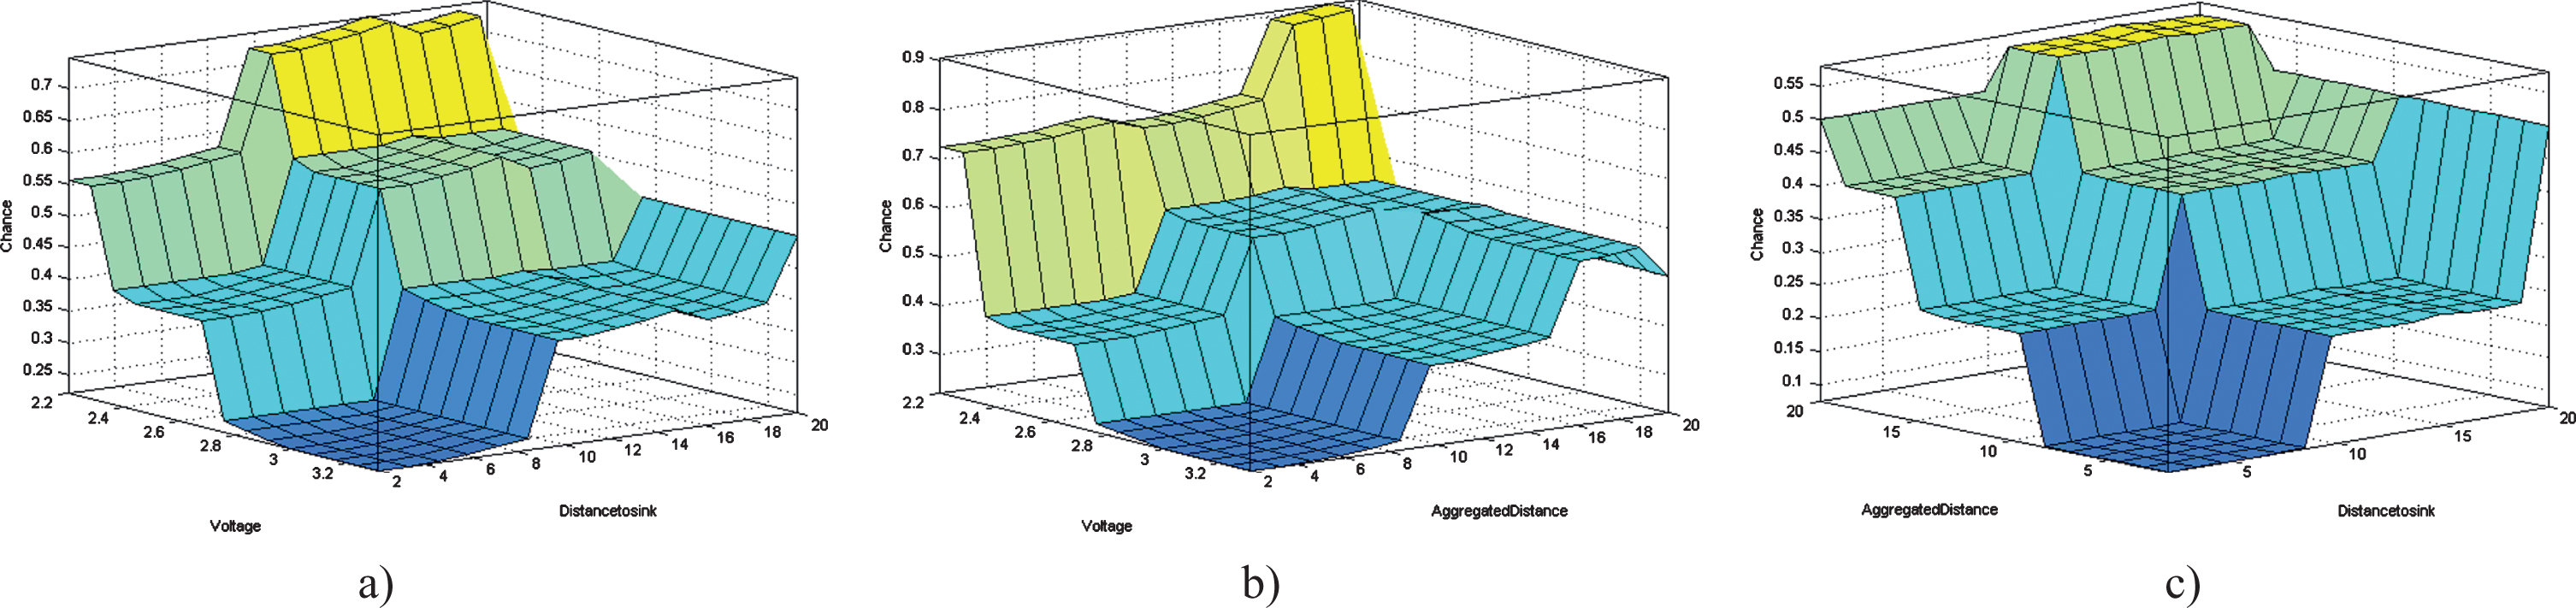
Fuzzy decision plot (a - Voltage and distance to sink b - Voltage and aggregate distance and c - Aggregate distance and distance to sink) Algorithm 1 CH selection steps.
INPUT: Node ID, Residual Energy of the nodes (Er), distance between nodes (d), Present voltage point in voltage curve (Vp)
Require: V p (Current battery voltage)
while (V p < V1)
if (Vneighbour > V t )
resign CH;
fuzzy(d, Vp);
appoint CH;
else
proceed CH role;
end
end
The threshold model proposed for CM is based on the arrival-rate of the data [5]. The arrival-rate of the data for the proposed model is considered to be Poisson in nature.
Let
r = efficient radio range
k = average number of nodes in the cluster
d = node distribution density
The probability of node having higher priority to become a CH over other participants is given in Equation (4).
The probability of a node to have lower priority to become a CH over other participants is given in Equations (5) & (6).
When the voltage level of node is less than or equal to the dismiss threshold V
th
, the clusters are reconfigured. The probability of cluster reconfiguration is given by Equations (7) and (8).
Terminologies –
λ Arrival-rate of the data
1/μ Mean service time
T Queue threshold
E(T) Average energy consumption of a sensor node with respect to queue threshold in joules
E[I] Average period of time the sensor node is in sleep state
E[C] Average period of cycle
T cy Average number of cycles per unit time
L Average number of packets
P I Probability that the sensor node in sleep state.
The optimal threshold to start the data transmission is presented below. Figure 8 elucidates the state operation of the transceiver unit.
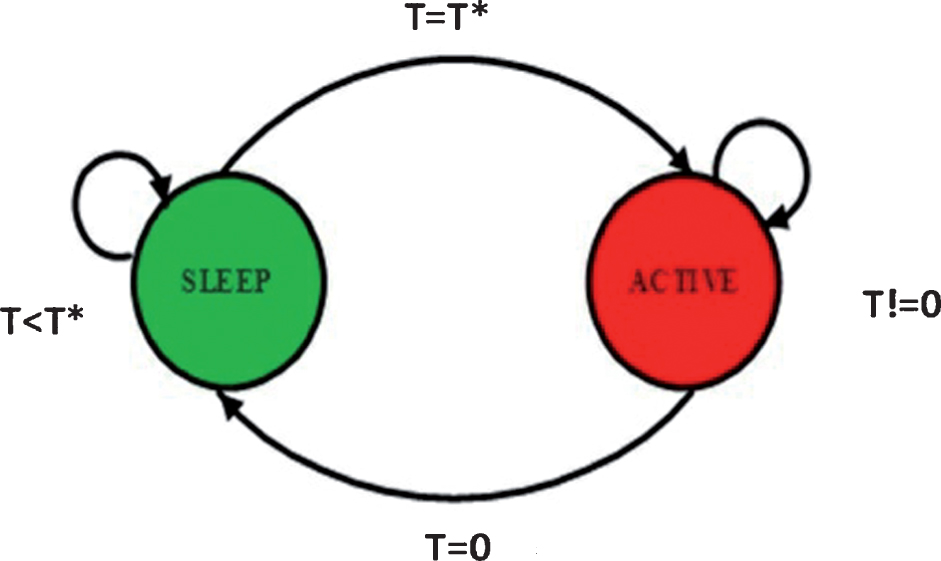
FSM of the transceiving unit.
The probability that the node in sleep condition is given by Equation (9). The calculation of threshold T* is as follows [5].
And E[I] is given by below Equation (10).
Since the total probability of P
I
and P
B
is 1 and P
B
= ρ,
Calculating E[C] from Equations (9) and (10).
Where ρ = λ/μ
The average number of cycles per unit time (T
cy
) is given by Equation (13).
Hence T
cy
is obtained from Equation (14) is given as,
Now, the average energy consumption of a sensor node, E(T) is expressed as,
Based on M/G/1 queueing model, the mean number of packets in sensor (L) is given in Equation (16)
E [s2] is the second order moment of service time and T is the queue threshold. Since the packet sizes are equal, a deterministic service time is considered, and the mean number of packets in the queue (L) is determined as,
Equating Equation (17) with Equation (10), E [T] is calculated. Hence the energy cost E [T] with respect to average number of packets and traffic intensity is given in Equation (18).
The following condition given by Equation (19) is used to determine the Optimal Threshold value. The optimal threshold value is denoted as T
opt
. It is the value of threshold at which minimum energy is consumed by the sensor node.
The optimal threshold value (T
opt
) obtained using the Equation (19) is as follows;
Figure 9 illustrates the optimal threshold T opt for various arrival rate.
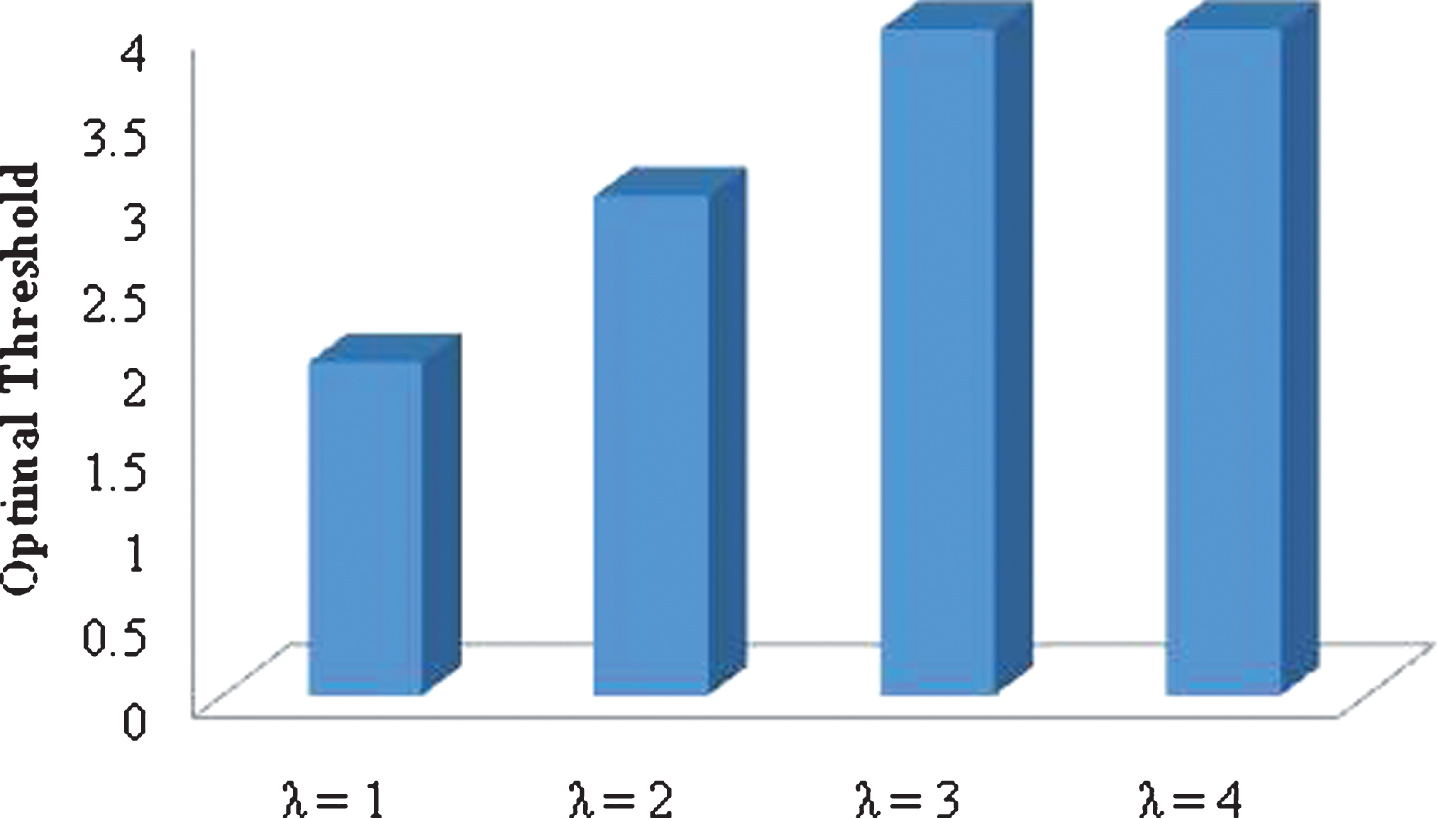
Optimal threshold (T*) with respect to arrival rate (λ).
The simulation of the proposed methodology is done using MATLAB with few criteria’s. The proposed protocol is compared with the standard LEACH and LEACH-C protocols.
The list of criteria’s considered for simulation is as follows: The sensor nodes are deployed in the Region of Interest. The nodes are energy constrained. The role of nodes is either a router or participant. The nodes are assumed to be static.
Table 2 illustrates the network parameters considered for evaluating the algorithms.
Simulation parameters
Simulation parameters
Figure 10 illustrates the Region Of Interest in which sensor nodes are randomly deployed. The location of sink is at (250, 750) to view the clustering approach towards sink.
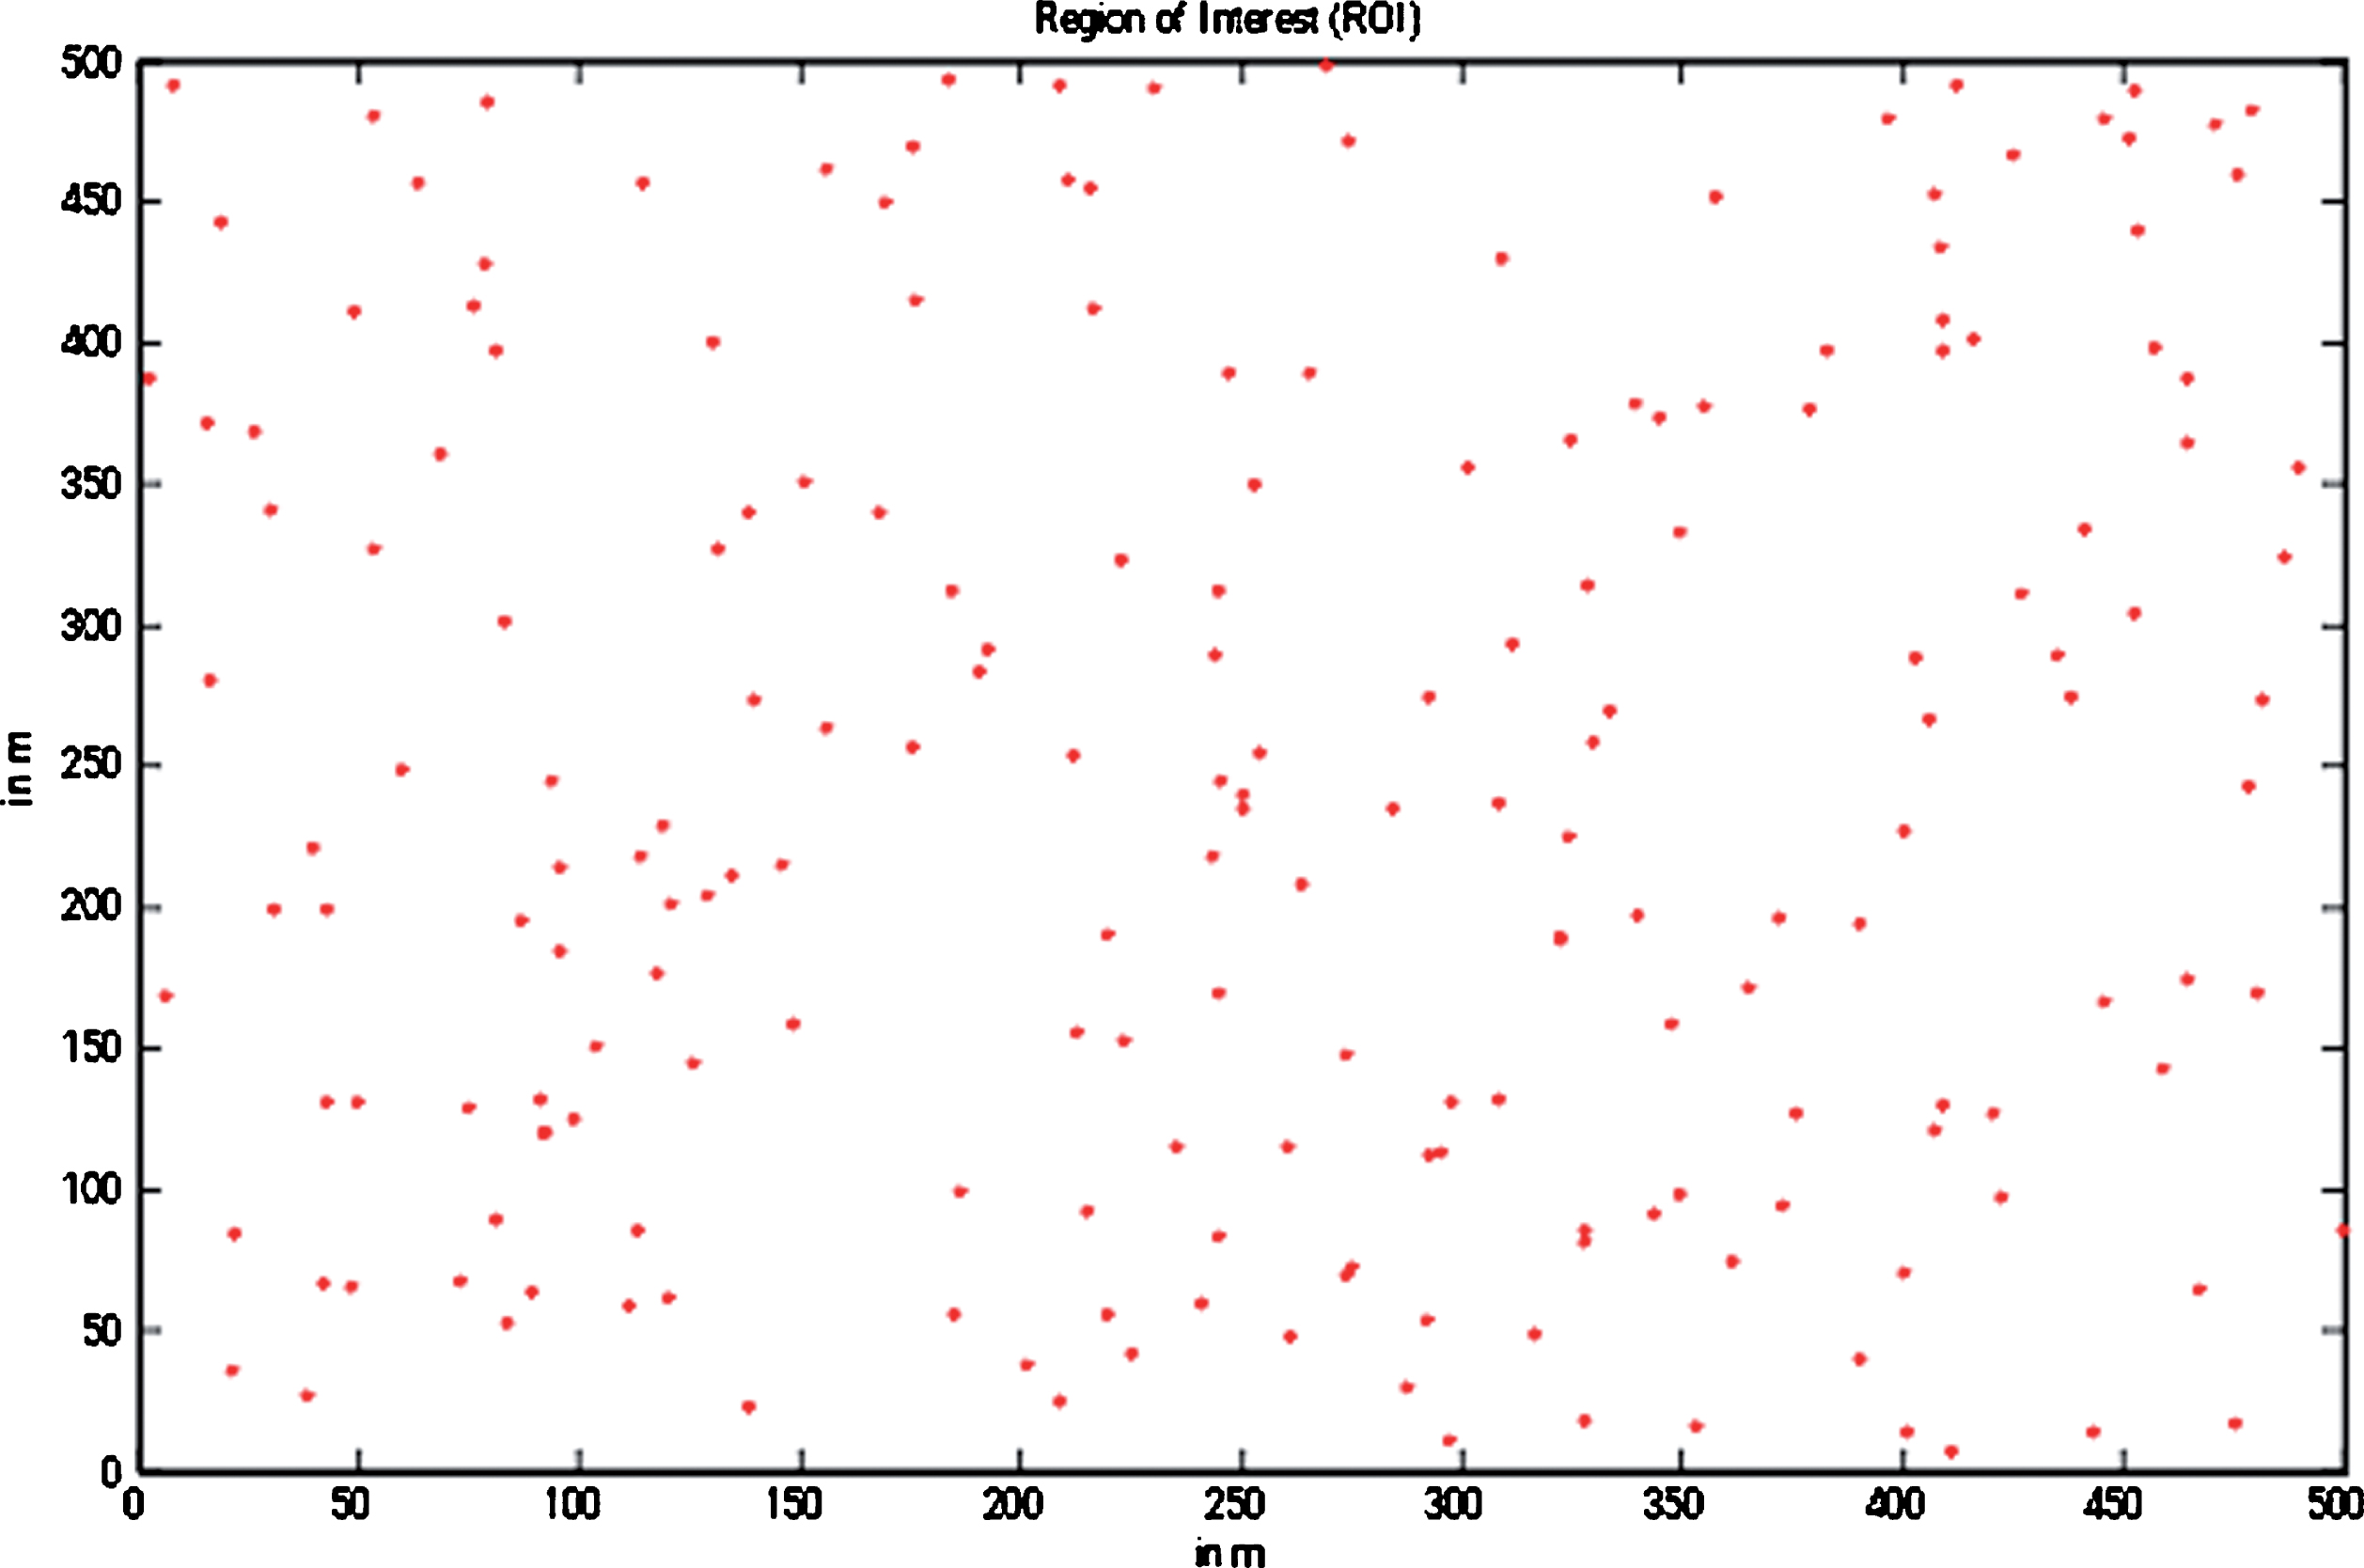
Node deployment inside the ROI.
The behavior of the proposed algorithm when compared with LEACH and LEACH-C protocol with respect to network lifetime is illustrated using Fig. 11.

Lifetime comparison of LEACH, LEACH-C and proposed algorithm.
The data arrival rate for all algorithms is considered as λ = 2. The figure conveys that network lifetime of the proposed algorithm is increased than that of LEACH and LEACH-C algorithms. The network lifetime of the proposed algorithm is 1.44 times longer than LEACH and 1.12 times longer than LEACH-C algorithm.
The first dead node (FDN) in the proposed algorithm occurs at 35th round. The network Half Node Alive (HNA) is observed after 443 rounds. Figure 12 indicates that the proposed mechanism proves to be better with the help of FND and HNA parameters.
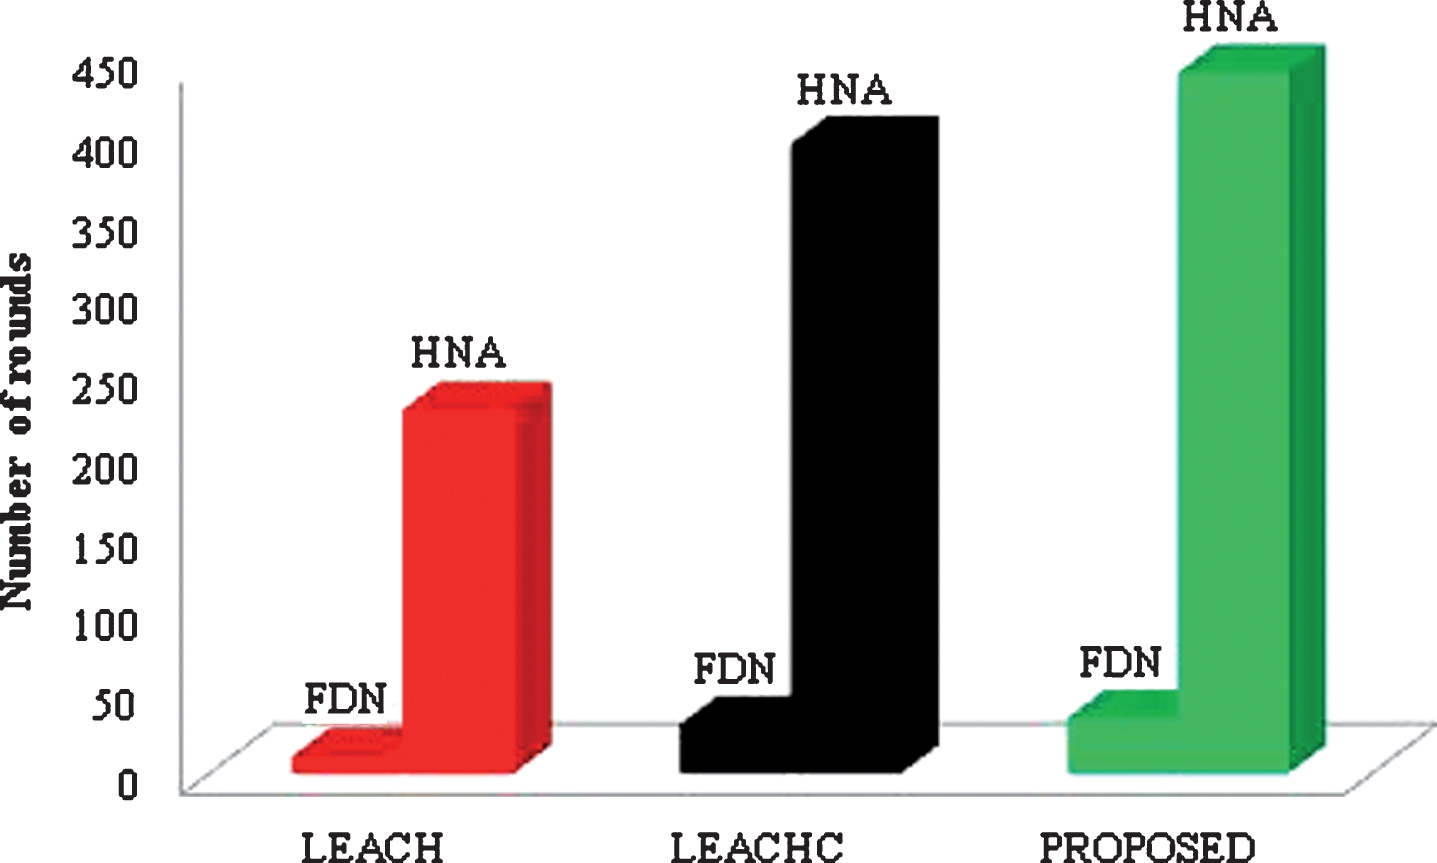
FDN and HNA comparison.
The difference between FDN and HNA is less in LEACH and LEACH-C algorithm, whereas the proposed mechanism provides better survivability to nodes and has high difference between FDN and HNA. Figure 13 illustrates the residual energy of three algorithms during the HNA. Figure 13 c) indicates the better survival rate of the proposed algorithm on comparing with other algorithms. More number of nodes has energy more than one joule in case of proposed. The clustering formation is with respect to the location of the sink. The number of nodes in the cluster near to the sink is less, whereas the clusters to the far away cluster have more number of nodes. This approach equally shares the network data providing high lifetime to the network.
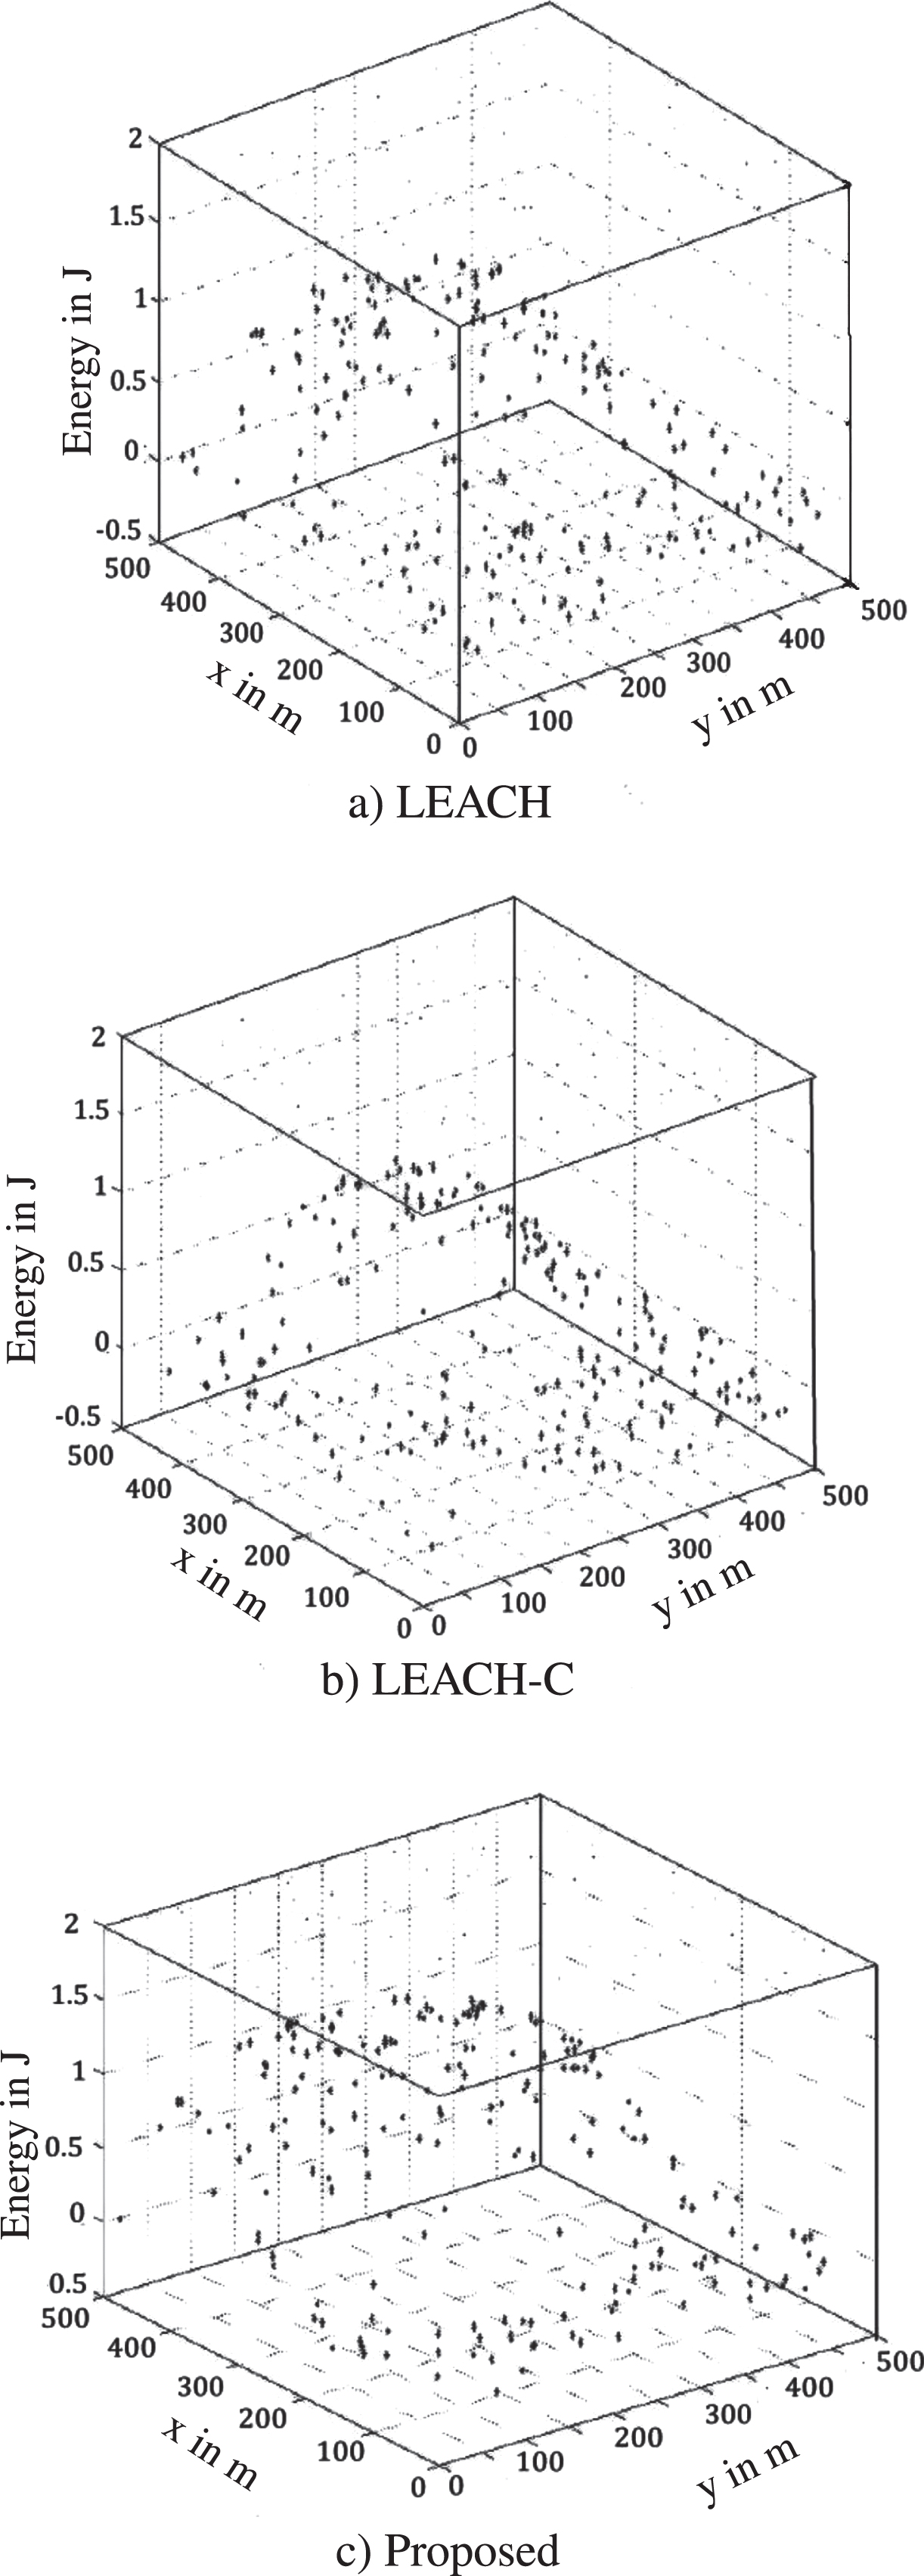
Residual energy of nodes at HNA, a) LEACH, b) LEACH-C, c) Proposed.
The alive nodes are evenly distributed promoting equal load sharing. Figure13 c) serves as a proof that the proposed method tends to overcome the energy hole and hot spot drawbacks. Figure 14 illustrates the Voronoi plot of the LEACH, LEACH-C and proposed protocol. The proposed methodology promotes unequal load distribution. It is achieved by having the clusters near the sink to be small in size and the clusters far away to be large in size. When compared to the existing LEACH and LEACH-C algorithms, the proposed mechanism has more number of clusters.
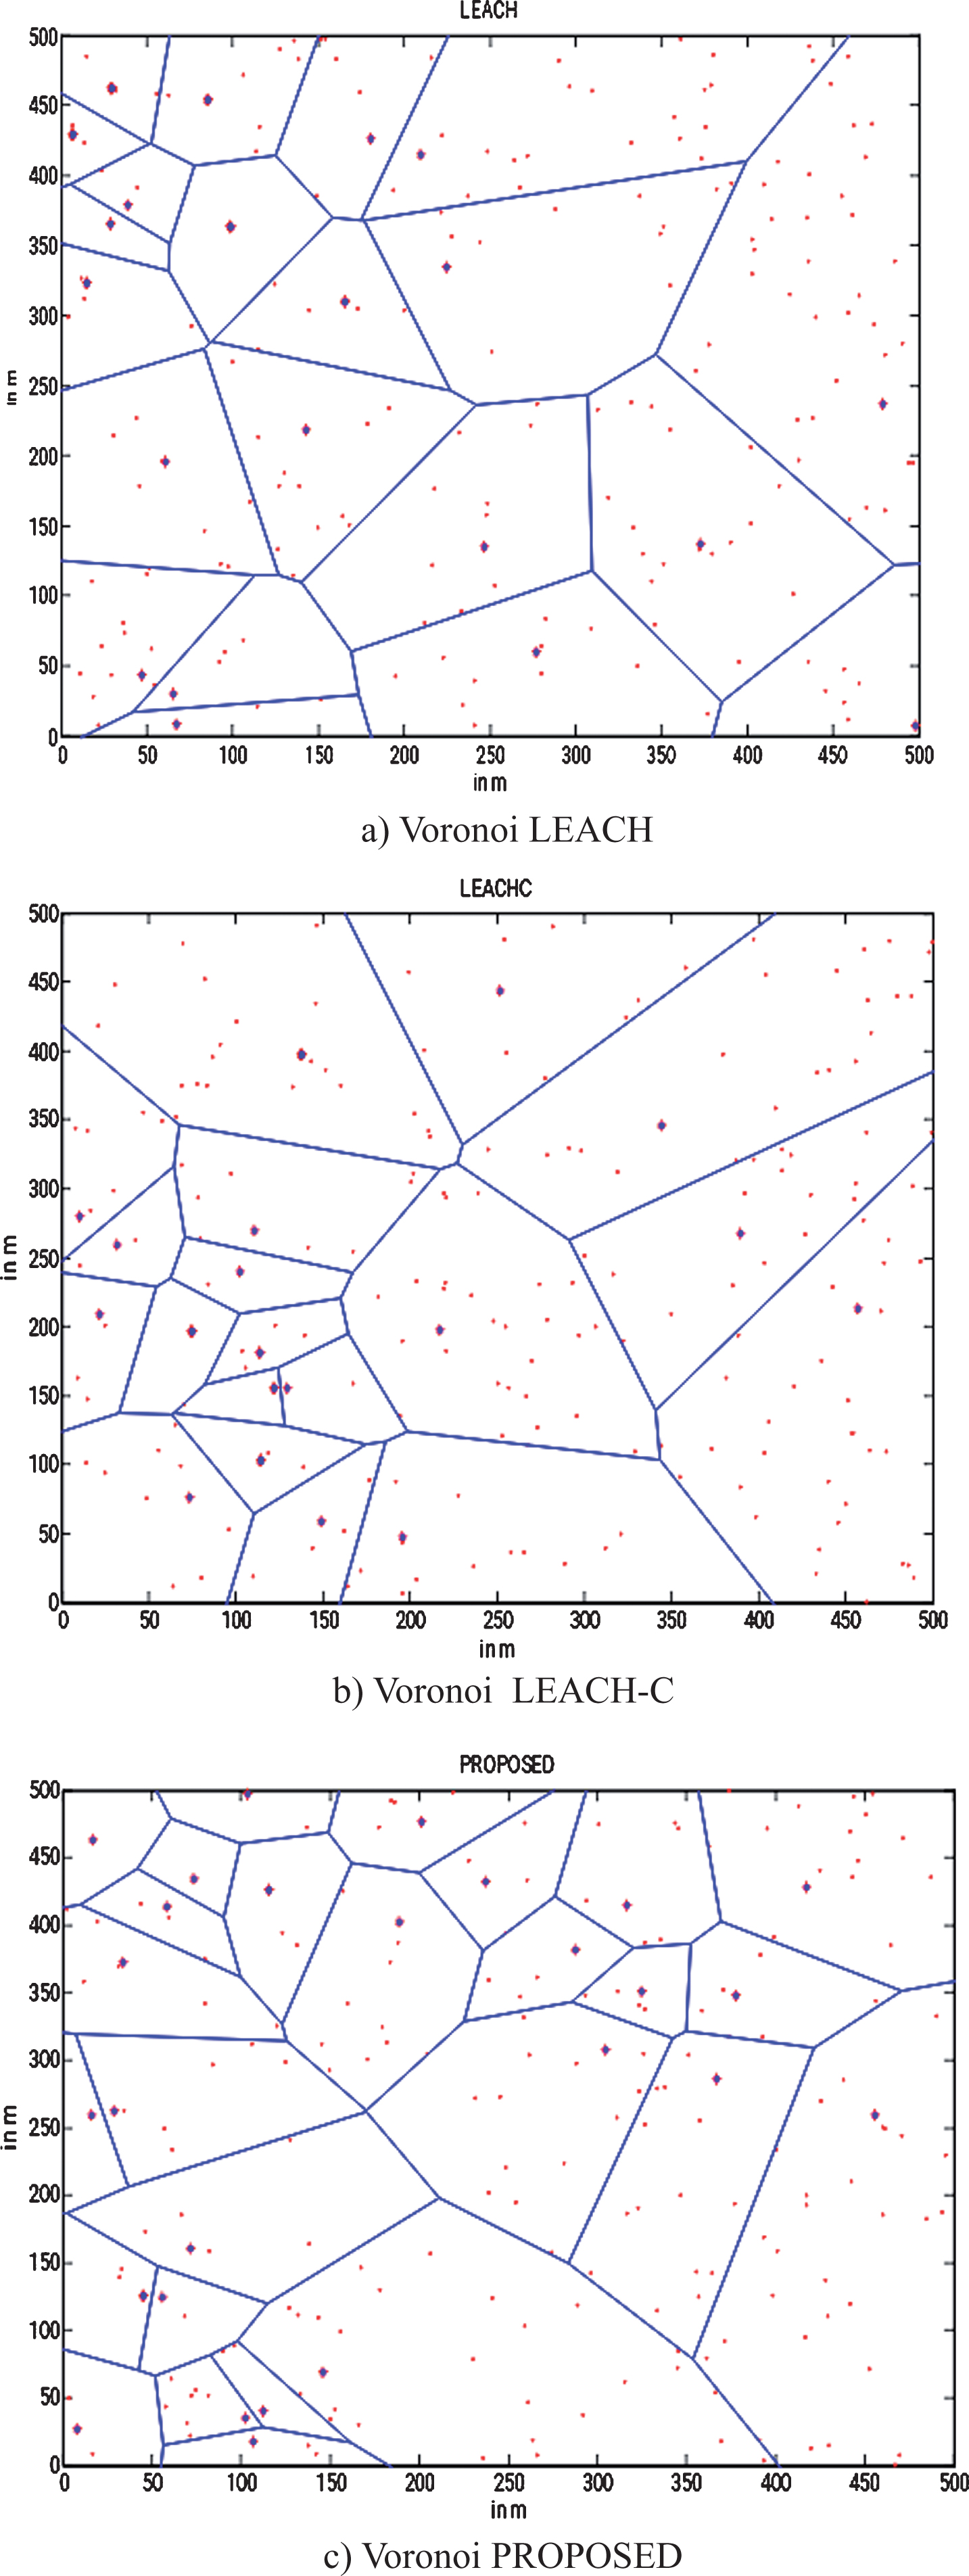
Voronoi representation of LEACH, LEACH-C and PROPOSED, Voronoi LEACH, Voronoi LEACH-C, Voronoi PROPOSED.
The throughput of the proposed mechanism is 1.17 times that of LEACH. It is clear from Fig. 15 that the proposed mechanism performance in terms of throughput is better than that of the existing LEACH and LEACH-C protocols.

Throughput comparison.
The average numbers of clusters in all cases are given in Fig. 16. The proposed methodology provides high clustering.
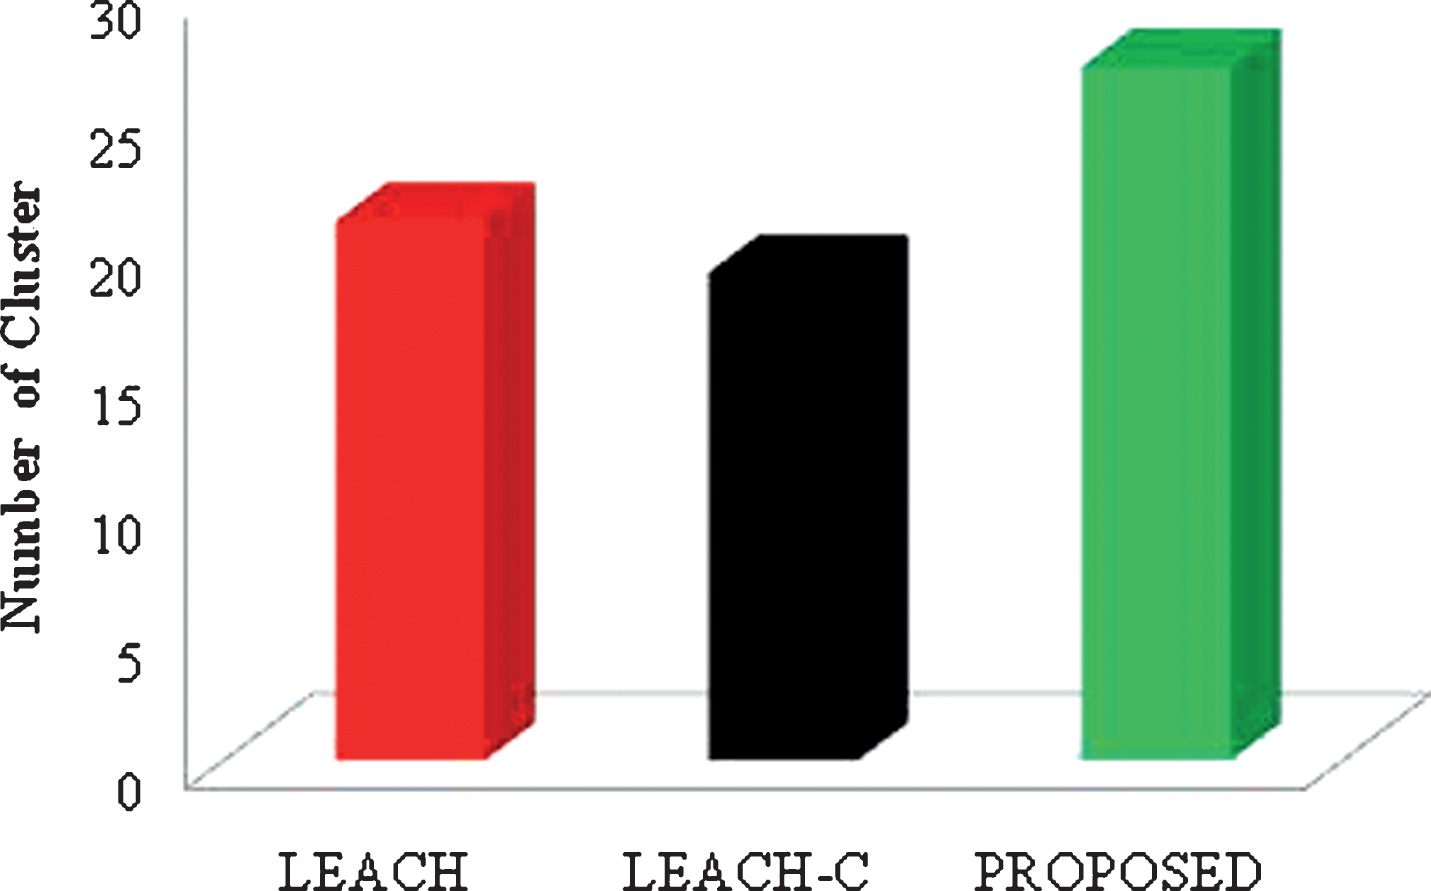
Average number of clusters in LEACH, LEACH-C and proposed.
The proposed method proves to be a promising protocol for enhancing the network lifetime. The reduction in distance and minimization of data transmission enhances the network lifetime. The fuzzy logic based algorithm provides novel election of CH avoiding energy hole and HOT SPOT. The CH rotation and relay node selection approaches ensures equal load distribution of the network. The results stands as the proof for our claim made. The VORONOI diagram exhibited by the proposed algorithm depicts the unequal clustering habit of the proposed algorithm. The cluster near the sink constitutes low members to balance the energy dissipated due to hoping the data from the far away cluster. As a future work of this paper real time implementation can be performed. Delay can be included as another performance parameter and the algorithm has to be made suitable for delay sensitive applications.