



Abstract
This paper presents a new electricity pricing methodology in distribution networks by imploying Distributed Generations (DGs). As long as the Locational Marginal Price (LMP) is used in the pricing of short-term operations as an efficient method, it can be performed in distribution network consequently. The proposed pricing method is modeled as an optimization problem with the specific control variables and objectives. The variables are LMPs and DGs power factors, and objectives are total losses and emission. Also, profit earned from reduction of loss and emission was allocated between DGs. Reduction of loss and emission was compensated by DGs production. As a result, more production resulted to high price of DG buses rather than market price. This price should be provided by Distribution Company (DISCO), and DISCO earns this money form the profit. Because of the multi-objective nature of the problem, a Multi-Objective Genetic Algorithm Optimization (MOGA) is implemented to solve. In order to validate the proposed method, a comparison between MOGA and Multi-Objective Particle Swarm Optimization (MOPSO) is performed consequently. The proposed method allows the decision-makers to apply their preferences among losses/emission reduction and DISCO’s benefit. furthermore, the feasibility of the proposed method is investigated using the IEEE-32 bus test system.
Keywords
Introduction
Recently, electrical distribution systems become large in size and complex in configuration leading to higher system losses. Thus, more investments are needed inevitably. Studies indicate that almost 10-13% of the total generated power is lost as line losses at the distribution level [1]. These losses lead the distribution feeder to increase the cost of energy and make the voltage profile undesirable. Fossil fuels which are commonly burned in different ways to generate electricity, produce greenhouse gases (GHGs) especially CO2. The result of this problem is environment pollution [2].
Environmental pollution and losses of distribution systems result to utilization of DGs in an effective way. In this view, the use of DGs can offer effective alternatives to provide a good solution to these problems. DG’s can employ to mitigate the loss of networks by changing transmission line flows [3]. This procedure can improve the reliability of system considering reducing losses [4]. Comparing to conventional thermal power, DGs use natural gas and other clean energies that can be more efficient, and also they reduce emission of greenhouse gases and dust. As a result, they have less detrimental effects on the surrounding environment. Therefore, DGs are considered environmentally preferable to the conventional source.
Although DGs could be beneficial in system management, there are some problems in their operation such as electricity pricing at DG connected buses [5]. In recent years, a lot of techniques have been developed for solving the electricity pricing problems at DG connected busses. The locational marginal pricing is discussed in [6].
LMP method is a well-known and popular strategy in electricity market transactions [7]. LMP can reflect the impact of power flows and contingency problem in specific lines. This approach provides individual nodal pricing, whereas the zonal method does not involve the monitoring of individual lines, assuming that all prices are the same in each zone. The LMP problem was solved based on demand response [8]. In [9], a method based on game theory was considered for LMP calculation in distribution networks. The energy balance, losses, and the network congestion and technical limits (bus voltage limits) were considered to determine the LMP value in each bus [10]. Fuzzy Q-learning was proposed for hour-head electricity marketing with renewable energy [11]. In [12] a new method was presented for optimal DG placement with the nodal pricing, by considering profit, losses reduction and the voltage improvement in distribution systems. In [13] LMP calculation was performed with distributed slack power flow formulation. In [14] the LMP calculation was obtained by a linear programming formulation with considering losses based on the information of network. All these methods suggested important features, but they have not included the following important features: Considering the other technical aspects of network such as emission in the LMP formulation.
Emission reduction is considered as a technical issue. Therefore, conventional emission reduction techniques are often carried out with technical methods such as installing filters, switching from conventional to Combined Cycle, or replacing existing generation resources [15]. These methods usually involve the cost, and the replacement of equipment. However, in the proposed method, by employing an economic approach, this technical issue has been remedied.
On the other hand, because reducing emission results in economic profit directly, considering the pollution as a parameter in calculating the price (LMP) can lead the DGs owners to apply maximum changes in order to get more profit. Encourage the DG unit’s owner to participate in the technical programs of network such as losses/emission reduction. Efficient reduction in the losses/emission of the network.
Applying mandatory policies on DGs will reduce their participation in meeting the networks’ objectives in the long term operation [16]. In this regard, if a method can optionally create the opportunity for DGs owners to gain more profit in proportion to their participation rate, it will achieve the acceptable improvement in the network. The proposed method of this paper, by applying a voluntary approach, provides the maximum participation of the DGs. The ability of decision maker to deal with the system priority among the different objectives such as losses/emission reduction, DG unit’s profit, etc.
In spite of predetermined scheduling and predictions, there are sometimes problems occurring in the network that can lead to transmission congestion and loads being not supplied. In such a circumstance, the priority of the decision making must be to reduce the loss in comparison with the emission reduction.
On the other hand, in case of intensified emission and its adverse effects, this priority can be made to reduce further emission.
The proposed method provides this capability to the operators. In this paper, the LMP problem in the distribution networks with consideration of the above mentioned features is solved using a Multi-Objective optimization algorithm called MOGA. In this algorithm, control variables are LMPs at DG connected busses, and power factor of DGs. Additionally, objectives of the problem are losses and emission of network, which should be minimized [17].
The conventional methods used to improve distribution network performance often involve costing [18–20], Sophisticated methods [21], adding/removing equipment [22, 23], or changing network configuration [24]. However, the proposed method, fulfills the network objectives by providing an economic-technical framework, only through the use of voluntary incentives resulting from the losses/emission reduction, without any additional cost, adding equipment, or making changes to the network configuration, satisfying the operators’ intended objectives.
In order to make the method more complete and practical, for future work, the following suggestions can be mentioned: Considering renewable resources with non-quadratic cost function Consider uncertainty in loads and prices
As the LMP calculation problem is a mixed integer nonlinear programming problem which cannot be solved by conventional methods properly, in this paper, an efficient evolutionary algorithm namely MOGA was used [25]. In addition, the considered problem refers to the simultaneous optimization of two conflicting objectives, i.e. losses and emission. Therefore, a Multi-Objective algorithm was used to obtain non-dominated (Pareto) solutions during the search process and store them in a repository. Since the objective functions are not the same, the size of the repository was controlled using a fuzzy clustering technique [26].
The resume of this paper is divided into sections: Section 2 presents the losses and emission calculation. Reduction of losses and emission for Multi-Objective problem and the proposed algorithm is presented in Section 3. In section 4, simulation results are provided to confirm the effectiveness of the proposed method. Finally, Section 5 presents the conclusion of the paper.
Formulation of loss and emission
In the first part of this section, the formulation of locational marginal pricing procedure is presented. Then, the formulation of emission and loss indices and the applied constraints in the problem are described.
Objective functions for pricing method
Due to the large number of feeders, connection and loads in the distribution network, one of the most important goals in the operation of this network is the loss reduction. On the other hand, the most environmental challenge about power generation is reducing emission from power plants due to undesirable environmental effects [27]. In this paper, LMPs are calculated at the DG buses based on the impact of corresponding DGs on the losses and emission reduction. Consequently, loss and emission are calculated as follows:
-
-
In the distribution network operation problem, the emission produced by conventional thermal power plants and DGs is calculated as follows:
where EDG,i is emission produced by ith DG and E grid is the emission produced by the substation bus connected to the network. These values are obtained by emission coefficients at DG units which are presented in Table 1 [28].
Emission coefficients of DG units and substation bus
Limitations and constraints of this LMP pricing problem are listed as follows:
- Distribution power flow equations:
P i and Q i are the net injected active and reactive power at ith bus, respectively. V i and δ i are the amplitude and angle of bus voltage, respectively. Y ij and θ ij are the amplitude and angle of admittance between ith and jth buses, respectively.
- Constraints of active and reactive power:
- Pmin,DG,i, Pmax,DG,i are the minimum and maximum active power of ith DG.
- Constraint of power factor:
- Constraint on Merchandising Surplus (MS):
As the losses and emission produced by DG units are minimized, the benefits of distribution company (DISCO) is increased consequently. This increased benefit is formulated as follows [28]:
In general, MS is greater than zero, and it must be minimized in a fair competition. In this regard, the MS constraint are considered as MS ⩽ ɛ, which ɛ is maximum deviation of the MS.
In this section, optimization algorithm has been introduced structurally. Then, the modeling of multi-objective optimization problem has been studied as a multi-objective approach. Furthermore, the best compromise solution for the aforementioned problem has been investigated. At the end of this section application of proposed algorithm for problem with interconnected bus has been studied.
In this paper, the decision maker is assumed to be honest since the pricing process in electrical distribution networks is carried out under the supervision of an independent entity called ISO (Independent System Operator) or IDSO (Independent electric Distribution System Operator) [29]. Therefore, none of the participants can behave in a dishonest way [30].
However, in the general process of decision making, several methods have been proposed by the authors. For example, the authors in [31] develop a mixed integer linear programming aimed to obtain the optimum solution to the proposed consistency improving model in certain real decision-making situations.
The personalized individual semantics (PIS) model is proposed to personalize individual semantics by means of an interval numerical scale model for supporting linguistic group decision making [32]. Also the similar method is applied to solve linguistic GDM problems with a consensus reaching process in [33]. Also, the decision makers may express their opinions dishonestly to obtain their own interests, which is referred to as strategic manipulation or non-cooperative behavior [33, 34]. This procedure is described in the following.
As a practical example in the distribution network, let X = {x1, x2, x3} be the set of alternatives that each one represents one of the distribution network operation states. x1 reflects the state of the network that the DGs do not contribute to improvement of the emission conditions and are exclusively used to reducing network losses. x2 states the condition of the network that the DGs do not contribute to the loss and exclusively reduces emission. Finally, x3 represents the normal state of the network, with DGs contributing both to reducing emission and reducing loss.
Also, let A = {a1, a2} the set of predefined attributes that a1 represent network loss and a2 represent the network emission, and w = {w1, w2} the associated weight vector of the attributes, such that w1, w2 ≥ 0 and w1 + w2 = 1.
In the event of an intensification of emission, corresponding to the reduction of emission, the amount of the w2 will be greater than the w1. On the other hand, In the event of a contingency on the network and the need to release the network capacity, the w2 will be greater than the w1, proportionally.
Let be the decision matrix given by the V = [v nm ] 3×2 decision maker that is shown in Table 2, where v nm denotes the preference value for the alternative x i ∈ X with respect to the attribute a1 and a2, representing how well alternative x n verifies attribute a m ∈ A. It should be noted that all predefined attributes are quantitative and measurable.
Decision matrix of the network
Decision matrix of the network
In order to normalize the decision making matrix into a corresponding standardized individual’s decision matrix
If weighted average (WA) operator is chosen as aggregation operator F with an associated vector w = {w1, w2}, the decision evaluation value of the alternative x
n
is shown as follows:
Due to ranking of alternatives, if Q
k
= {x
n
|D (x
n
) > D (x
k
) , n = 1, 2, 3} is considered as the set of the alternatives whose decision evaluation value is greater than that of the alternative x
k
, and |Q
k
| be its cardinality, the alternative x
k
such that D (x
k
) = max {D (x1) , D (x2) , D (x3)} might verify as well that |Q
k
| = 0, while alternative x
m
such that D (x
j
) = min {D (x1) , D (x2) , D (x3)} might as well have |Q
k
| = n - 1, and therefore this alternative will be ranked in 1st and 2nd positions. Thus, the ranking position of an alternative is shown in the following [34, 35].
A multi-objective decision problem is defined as follows: Consider an N-dimensional decision variable vector q ={ q1, …, q
N
} in the solution space Q, the problem is to find a vector q* that minimizes a set of K objective functions r (q*) = { r1 (q *) , …, r
K
(q *) }. A series of constraints such as W
j
(q *) = b
j
for j = 1, …, m which limit the decision variables are confined the solution space (Q). The perfect multi-objective solution which simultaneously optimizes each objective function is almost impossible [36]. Then, the main goal of the multi-objective optimization problems is to obtain a set of Pareto optimal solution. Since Pareto optimal set is assemble of the solutions, genetic algorithm which is one of multi-point search methods is suitable to derive the Pareto optimal set [37]. Most of the other multi-objective algorithms are dependent on the user to set their parameters simultaneously. On the other hand, the multi-objective GA does not force the user to prioritize, scale or weigh objectives. Therefore, GA has been nominated as the most popular heuristic approach to the multi-objective design and optimization problems [22]. Multi-objective optimization problem is formulated as follows [38]:
Subjected to the following constraints:
By solving the proposed multi-objectives problem, the pareto optimal solutions are obtained. Consequently, the best comprised solution (BSC) should be selected for proposed microgrid scheduling problem. In this regard, the max-min fuzzy satisfying criterion is utilized to select the BCS. In this method, firstly, the Fuzzy Membership Function (FMFs) are calculated [38, 39]. This procedure can be mathematically expressed as follows:
In a Multi-Objective optimization problem, the concept of optimality is replaced by non-dominated solution (Pareto optimality) [26]. A general Multi-Objective optimization problem can be formulated as follows:
For any two solutions X1 and X2, the solution X1 dominates X2 if the following two conditions are satisfied:
If any of the conditions are unacceptable, X1 cannot dominate X2 otherwise X1 dominates X2, and named non-dominated solution.
According to the proposed model for solving Multi-Objective problem, the algorithm’s output is a set of non-dominated solutions, and the decision maker wants to select one solution as the best compromise solution among the obtained non-dominated solutions. To reach this aim, the following section should be considered:
Section 1: Each objective function should be converted to a membership function by (18):
Section 2: The normalized membership function of kth non-dominated solution should be calculated as:
Section 3: The solution which has maximum μ k is selected as the best compromise solution.
To apply the intended algorithm to Multi-Objective LMP calculation the following steps should be performed:
At the first, all buses have identical price equal to market price.
Repair the first population to make it feasible
Fitness evaluation of P0.
Apply the sorting process for each solution based on the fitness evaluation
Do
it = it + 1
Crossover: generate the set R i of offspring of size N
If p > p m , then activate the Mutation process
Apply the sorting process for each solution in R i
Fitness evaluation for P i
Update the non-dominated list Q i
Evaluate and select best N solution from P i
While stopping criteria
Also, the flowchart of the proposed algorithm is shown in Fig. 1.
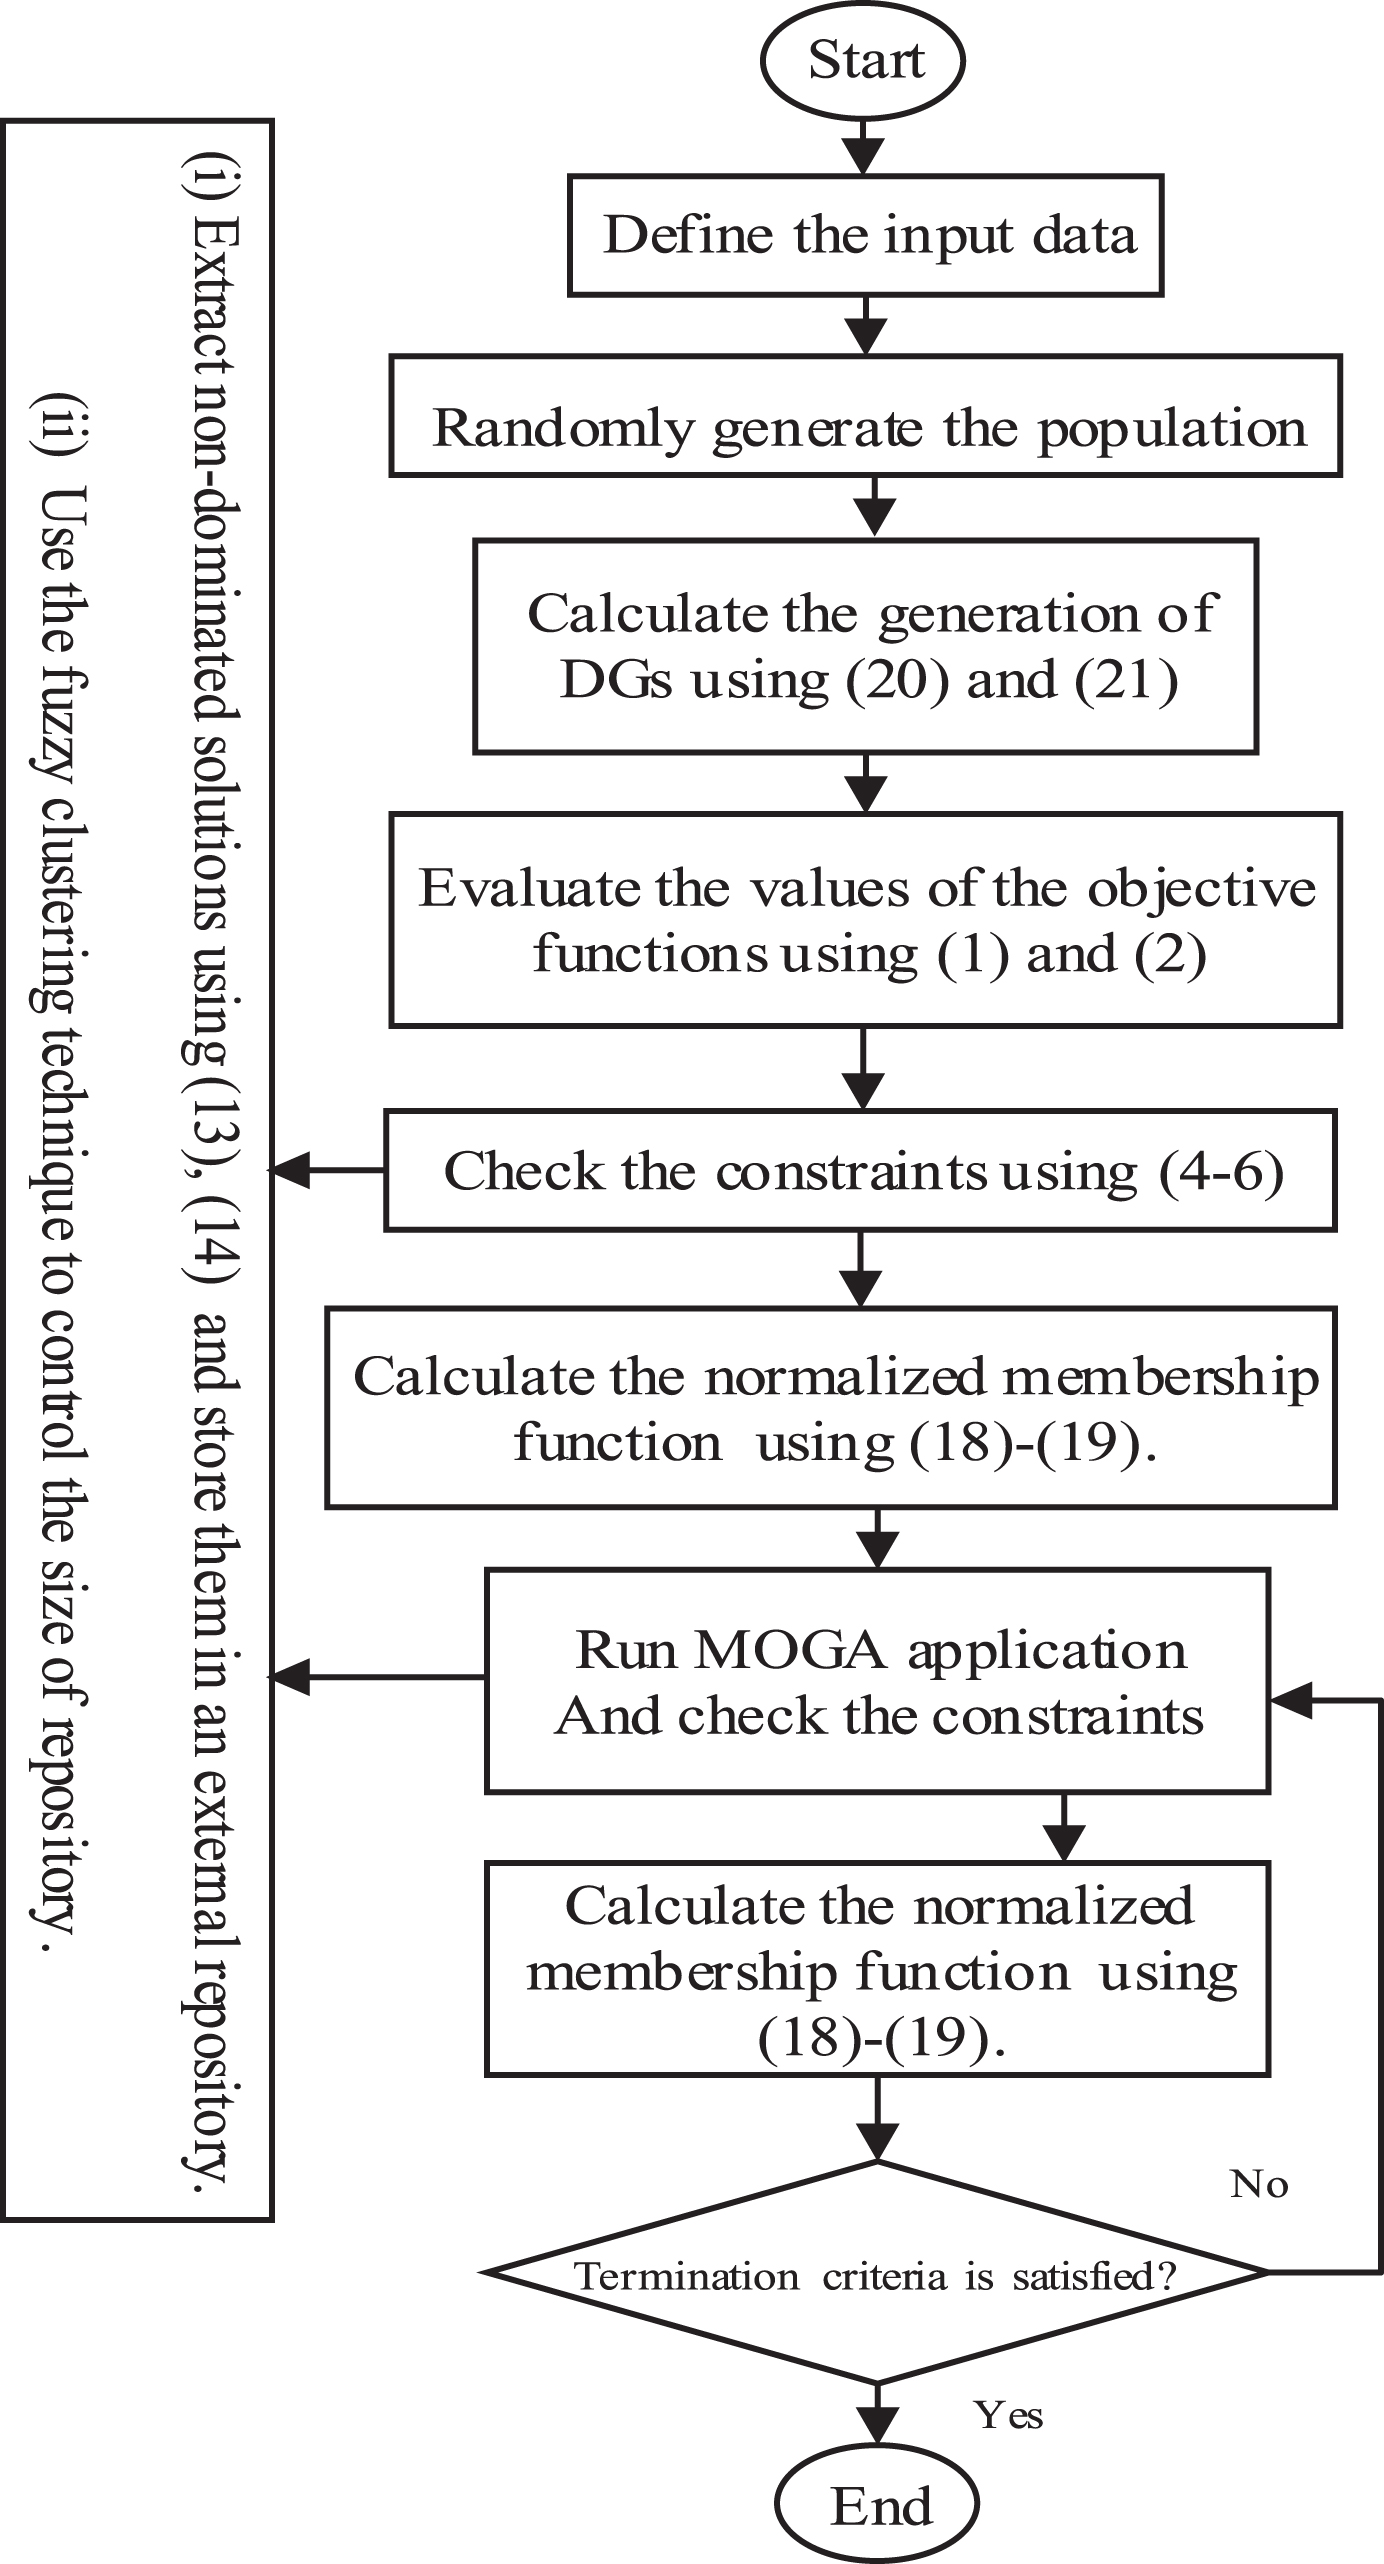
Flowchart of the proposed MOGA algorithm for LMP calculation problem.
In this section, the Multi-Objective LMP calculation in distribution networks is tested on a 32-bus distribution test system with four DGs. The proposed test system is a hypothetical 12.66 kV system including a substation, two feeders, and 32 buses. The system data is given in [28] and the single line diagram of this system is shown in Fig. 2. The initial loss of system is 202.47 kW and the initial emission is 3617.365 kg. The DG units are placed in 5,11,25,30 buses. Emission coefficients for these DGs are shown in Table 1. The of DG units in the term of coefficients of equation a, b, c are presented in Table 3.

Single line diagram of 32-bus distribution test system.
Characteristics of DGs
First, to evaluate the superiority of the MOGA algorithm rather than MOPSO algorithm, the loss and emission were optimized by these two mentioned algorithms separately. In this comparison the market price is equal to 28 ($/MW). Table 4 presents the results of both algorithms in the case that loss is considered as the objective function. Also, in Table 5, the results of algorithms are presented considering that emission is the objective function. As shown in Tables 4 and 5, the results of MOGA algorithm are much reliable than the MOPSO algorithm. This superiority may result to more reduction of loss and emission.
Results of optimizing the loss for MOPSO and MOGA Algorithms in 500 trials
Results of optimizing the loss for MOPSO and MOGA Algorithms in 500 trials
The results of the proposed MOGA algorithm in confronting with LMP calculation are presented in Tables 6–8. In these tables, the proposed method is compared with other two conventional LMP calculation methods namely uniform price method and marginal losses method [6]. In Tables 6 and 7, DG units’ nodal price and their generation for various market prices are presented, and the results of these three methods is compared. As the market price increases, the generation of DGs and nodal price is increases using all three methods consequently. In fact, the generation of DGs is adjustable with new nodal price, but generation and price of DGs for the proposed method are more than marginal losses and uniform price methods. More active power of DGs and high price of DG connected buses emphasize on the efficiency of this method in comparison with other methods. Due to the fact that more generation of DGs causes lower loss and emission, we can approach to our aim i.e. decreasing mentioned objectives. For starting the of DGs, coefficient ‘b’ in (15) must be lower than market price. As shown in Table 6, for market price equal to 20($/MW) all DGs are turned off and have not any generation. When the DG are turned off and does not generate active power, the price of DG buses are equal to market price equal to 20 ($/MW). The results of this problem are shown in the first row of Table 7.
DG units’ nodal price for various market prices
DG Units’ Generation for Various Market Prices (Deterministic Framework)
Loss and emission of network for Various Market prices
Furthermore, as shown in Table 6, as the market price increases, the DG’s power also increases. For example, in the case that the market price is equal to 28 ($/MW), DG1 generates 753.74 kW, and in the other case that the market price is equal to 26 ($/MW), it generates 588.595 kW. When the market price is equal to 30 ($/MW), DG2, DG3 and DG4 generate 1000 kW active power. It’s due to the constraint of DG’s capacity, they can produce up to 1000 kW, but by (20) the generation of DGs calculated more than 1000 kW, and DGs are forced to generate maximum capacity of active power. If the capacity of DG increased, in the intended market price, more power can be reached.
Table 8 shows the optimized value of loss and emission for various market prices. As shown in this table, as the market price is increases, the loss and emission in all pricing methods increases. So, the proposed method makes more reduction in comparison of marginal losses and uniform price methods. Decreasing of these objectives causes extra benefit for DISCO. These benefit is equal to 1 MW power costs 1 $ and 1 kg emission costs 5.94 $. These values are λ1 and λ2 in simulation respectively. Based on allowance price of emission and market price, decreasing these objectives are equivalent with identical cost that delivered to DISCO. Also, DISCO allocates the benefit of reduction of loss and emission to DGs in order to generate more active power, and aims to reduce loss and emission of distribution network. DGs need more money to generate extra power and DISCO supplies more money to generate more active power of DGs. As the generation of DGs active power increases, the allocated cost to DGs increases consequently.
In Fig. 3, final solutions of LMP problem by MOGA algorithm are presented. As shown in Fig. 3, behavior of emission index is in contrast with the loss index. This means that increase in loss results to decrease in emission. Non-dominated solutions are extracted from many answers of optimization, and finally no answer dominates other answer, and it is named non-dominated solutions. Figure 3 demonstrates that non-dominated solutions are reasonable. The solution with larger membership function value is chosen the best solution for Multi-Objective optimization problem during the search process of MOGA algorithm.
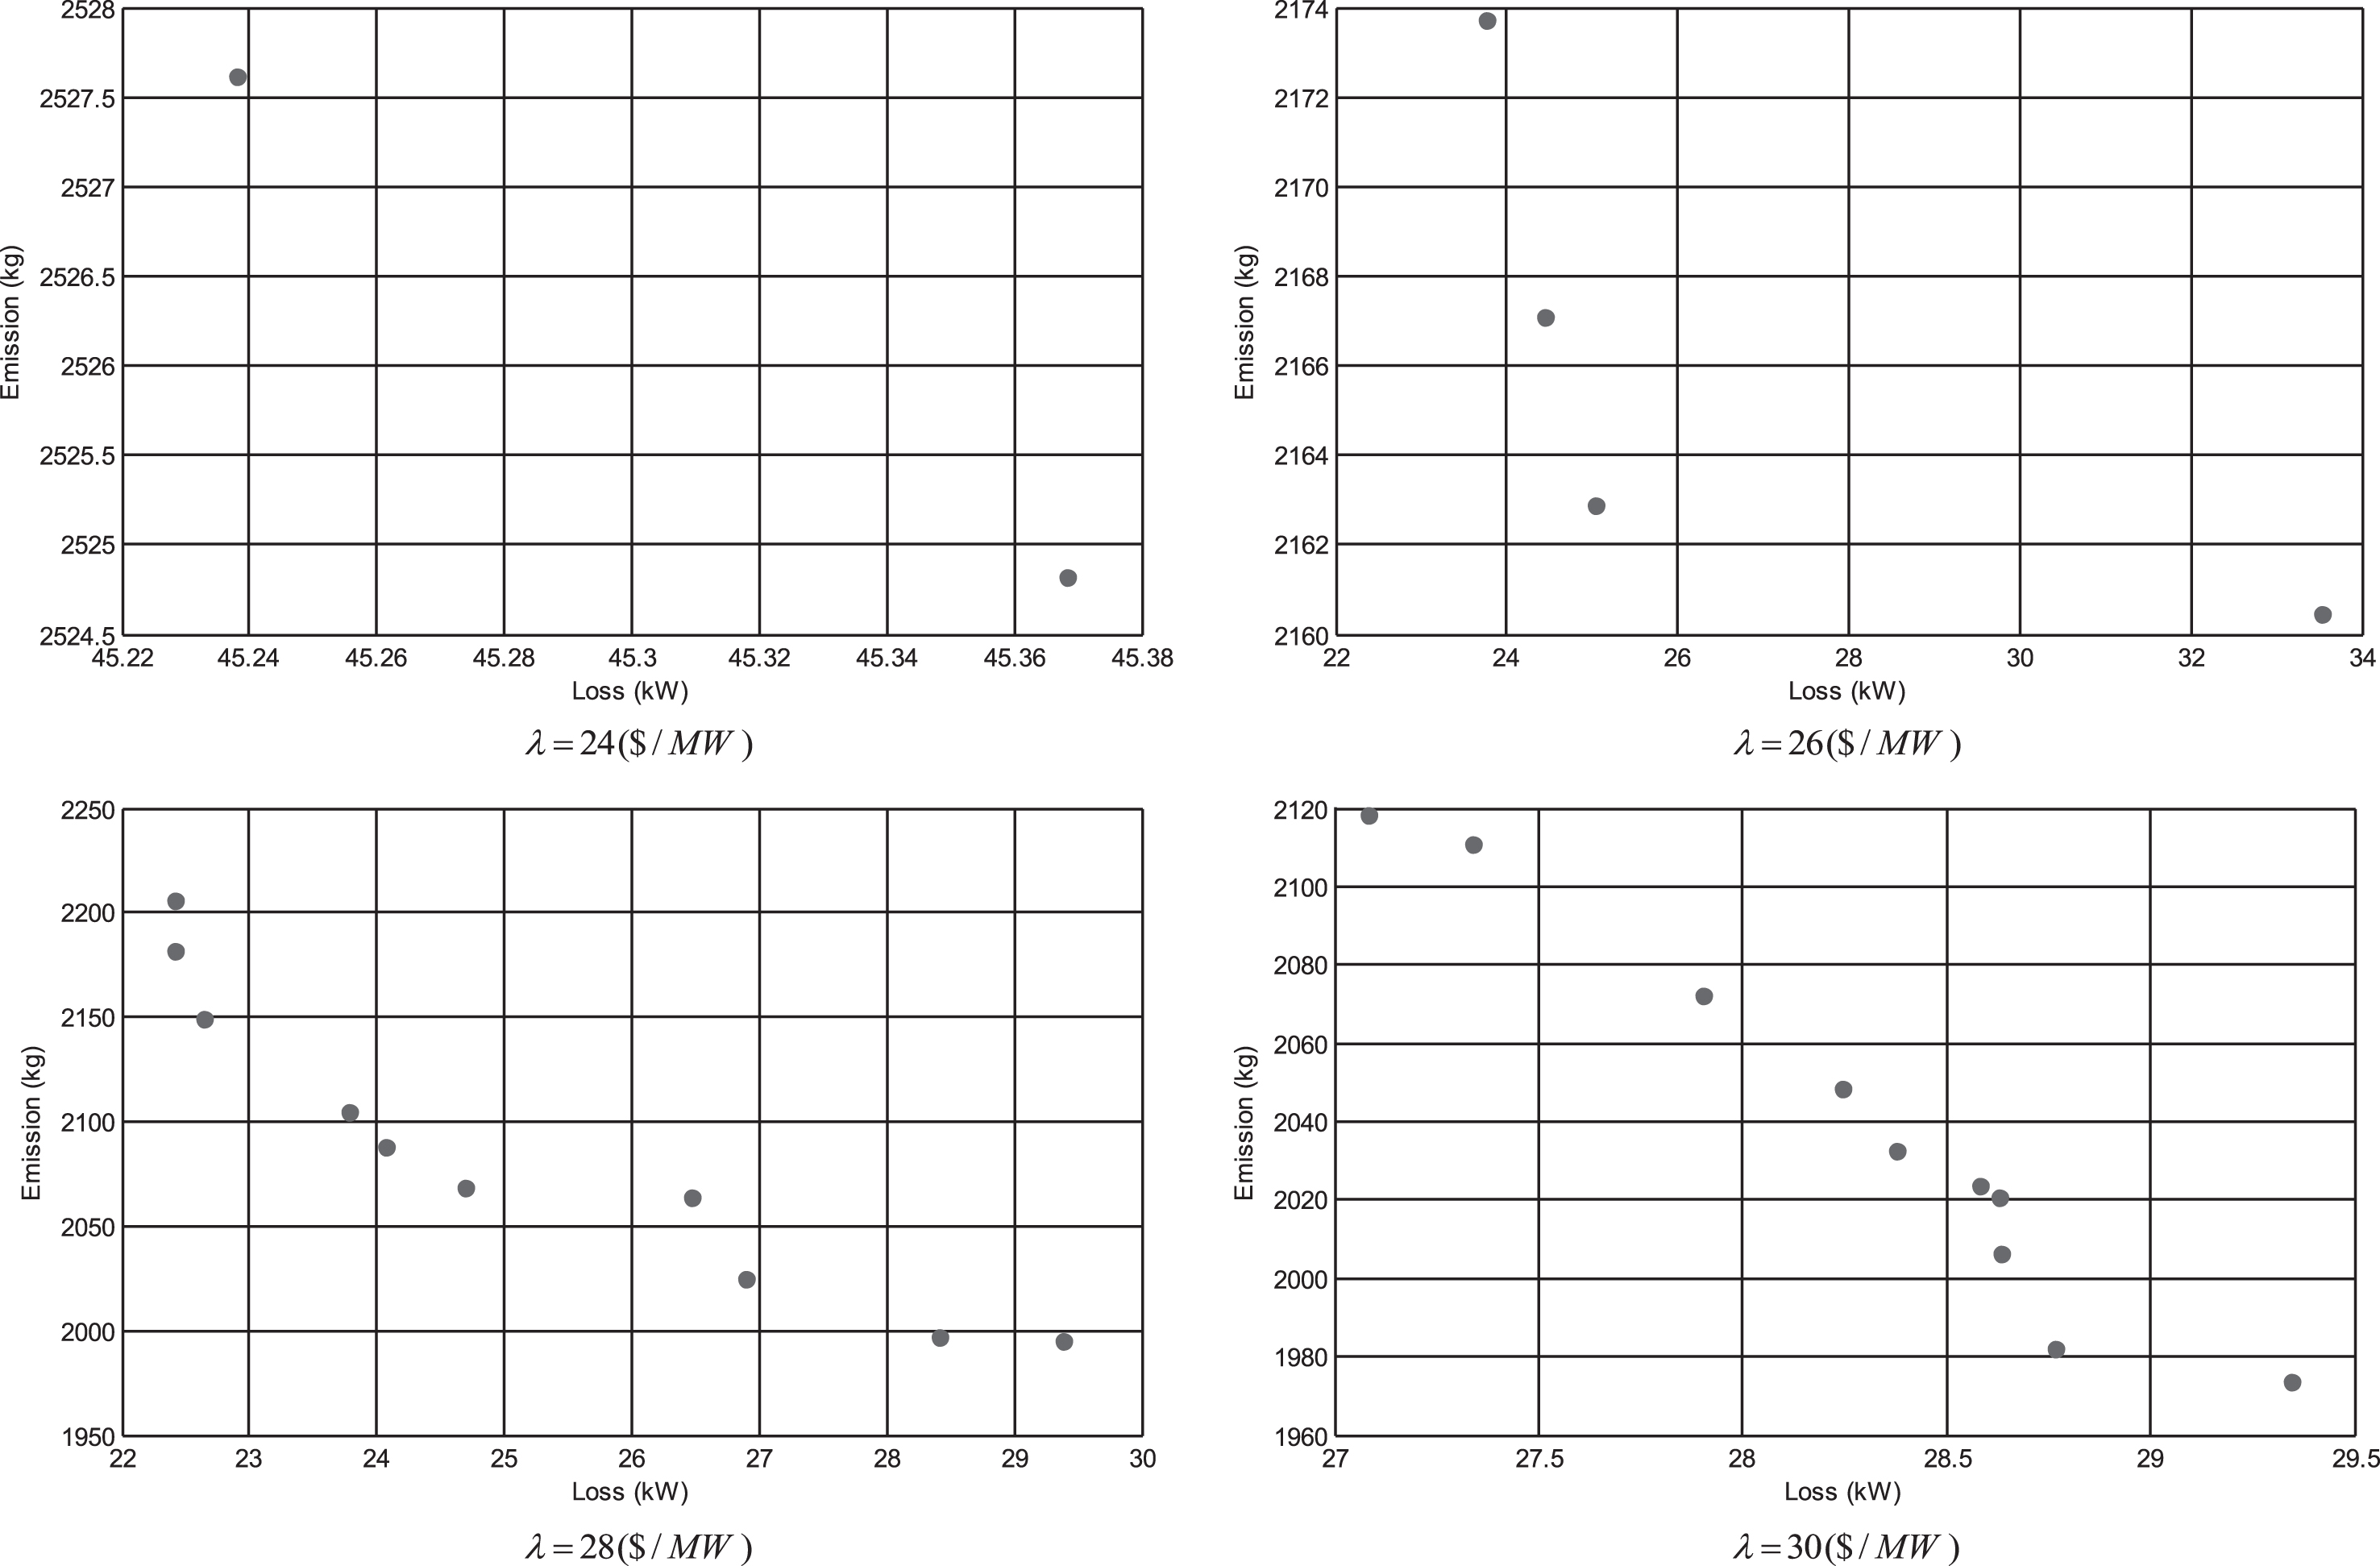
Obtained non-dominated solution using MOGA algorithm for various market prices when objectives are power loss and emission.
Also, in Tables 5–7 the results corresponding to the solutions with minimum emission and maximum loss in Fig. 3 are considered. This selection is based on the allowance price of 1 kg emission and market price. The price of 1 kg emission is higher than 1 MW loss, and the reduction of emission causes more benefit rather than reduction of loss and brought more money to DISCO.
A Multi-Objective optimization based on MOGA is considered to optimize the losses and emission in presence of DGs for various market prices in this paper. the DG generation is directly related to the price of its bus. As the price increase, the generation of DG would be increased. One of the most important advantages of the Multi-Objective formulation is that it has several non-dominated solutions allowing the decision-makers to select the best solution based on the performance of network. Furthermore, the suggested method which is based on non-dominated solution is much efficient rather than the other multi-objective methods. One of the most important advantages of the Multi-Objective formulation is that it has several non-dominated solutions allowing the decision-makers to select the best solution based on the performance of network. Therefore, in the process of reducing losses/emission, depending on the circumstances in the decision making procedure, the share of each objective in proportion to the allocated benefit, can be reduced or increased.
Also, the simulation results confirmed that the proposed method is a reliable answer to the distribution pricing problem.