
Abstract
Hypothesis tests are a statistical decision-making tool for testing if a hypothesized parameter value is supported by the sample data or not. Vagueness and impreciseness in the sample data require fuzzy techniques to be employed in the analysis. These techniques can be based on intuitionistic fuzzy sets, hesitant fuzzy sets, type-2 fuzzy sets, neutrosophic sets, or spherical fuzzy sets. In this paper, Z-fuzzy numbers are used to capture the vagueness in the sample data and develop Z-fuzzy hypothesis testing. A Z-fuzzy number is represented by a restriction function that is usually a triangular or trapezoidal fuzzy number and a reliability function representing the confidence level to the restriction function. Illustrative examples for left and right sided hypothesis testing and sensitivity analyses are presented.
Keywords
Introduction
Hypothesis tests (HTs) are used for testing if a hypothesized parameter value is true or not, based on a confidence level. There are three types of HTs with respect to the side of the tail: left sided, right sided, and two sided HTs. The hypothesized parameters may be the population mean, population proportion, population variance, difference between two population means, difference between two population proportions, equality of two population variances, population mean for paired samples, and many other HTs for population correlation coefficient and regression coefficients, etc. They are often used for statistical decision making in the theory and practice.
In probability theory, probabilities are based on observations. More observations provide more accurate estimation of probabilities. However, probabilities do not represent degrees of partial truths for describing the imprecision by membership degrees. If vagueness and impreciseness exist in the considered data set and the uncertainty is represented by a possibility distribution rather than a probability distribution, fuzzy statistical tools should be preferred.
Zadeh [34] defined Z-fuzzy numbers as ordered pairs of fuzzy numbers Z = (A,B) for a real-valued uncertain variable X. The first component A represents the restriction on the X values and the second component B represents the reliability of the first component. In other words, a Z-fuzzy number is an approach to define a fuzzy event (A) with the confidence level (B) to this event that the decision maker believes.
Z-fuzzy numbers have been extensively employed in the literature after its introduction. Especially, the interest to Z-fuzzy numbers has emerged after the year 2014. Z-fuzzy numbers can be also applied to fuzzy hypothesis testing problems when a possibilistic approach is preferred for the solution.
This paper presents the first attempt to Z-fuzzy hypothesis testing in the literature. A step by step methodology for the left sided and right sided hypothesis tests are developed based on Z-fuzzy numbers. An illustrative example on customers’ satisfaction for photovoltaics panels is given. Also, a sensitivity analysis is presented to determine in which significance levels the decision is changed.
The rest of the paper is organized as follows: Section 2 gives a literature review on Z-fuzzy numbers. Section 3 presents a literature review on fuzzy hypothesis testing with respect to each of the fuzzy set extensions. Section 4 includes the preliminaries of Z -fuzzy numbers. Section 5 presents the steps of the proposed Z-fuzzy hypothesis testing method. Section 6 demonstrates the application of the methodology. The last section concludes the paper.
Literature review: Z-Fuzzy numbers
Zadeh [34] introduced Z-fuzzy numbers to the literature for making more reliable decisions. Kang et al. [10] developed a method for transforming Z-fuzzy numbers to classical fuzzy numbers according to the fuzzy expectation of a fuzzy set. Yager [62, 63] showed that the Z-valuations essentially induce a possibility distribution over probability distributions associated with the probability that A is equal to B. He presented an illustration of a Z-valuation that can be used to make decisions. He also presented a representation of Z-valuations in terms of Dempster-Shafer belief structures, which allows type-2 fuzzy sets to be employed. Kang et al. [11] developed a new MCDM method based on Z-fuzzy numbers to deal with linguistic DM problems. Aliev et al. [58] handled the theoretical aspects of discrete Z-fuzzy arithmetic operations such as addition, subtraction, multiplication, division, square root of a Z-fuzzy number and other operations. Aliev et al. [59] developed a fully Z-fuzzy number based linear programming (Z-LP) model to better fit real-world problems. They proposed a method to solve Z-LP problems, which utilizes differential evolution optimization and Z-fuzzy number arithmetic developed by the authors.
A literature review on Z-fuzzy numbers based on Scopus database gave a list of 76 publications on different subject areas. It is seen that there is a large acceleration in the number of Z-fuzzy papers after year 2014. The same search shows that Computer Science, Mathematics, and Engineering are the top three subjects, which Z-fuzzy numbers are applied.
Literature review on fuzzy hypothesis tests
Sometimes there are not enough precise data to analyze the problem with the classical hypothesis testing approach. Hence, statistical hypotheses testing has been generalized to vague hypotheses for more than two decades. In a fuzzy hypothesis test, the data may be composed of fuzzy numbers or the tested parameter may be a fuzzy number. Alternatively, both the data and the tested parameter may be fuzzy numbers. Fuzzy hypothesis testing with the emergence of new types of fuzzy sets found the opportunity to expand the research area.
Fuzzy hypothesis tests have been often handled in the literature from different points of view. The first significant works on fuzzy hypothesis tests have been proposed by using ordinary fuzzy sets. Several extensions of ordinary fuzzy sets have been developed by various researchers in the literature. Figure 1 shows these extensions together with their researchers.
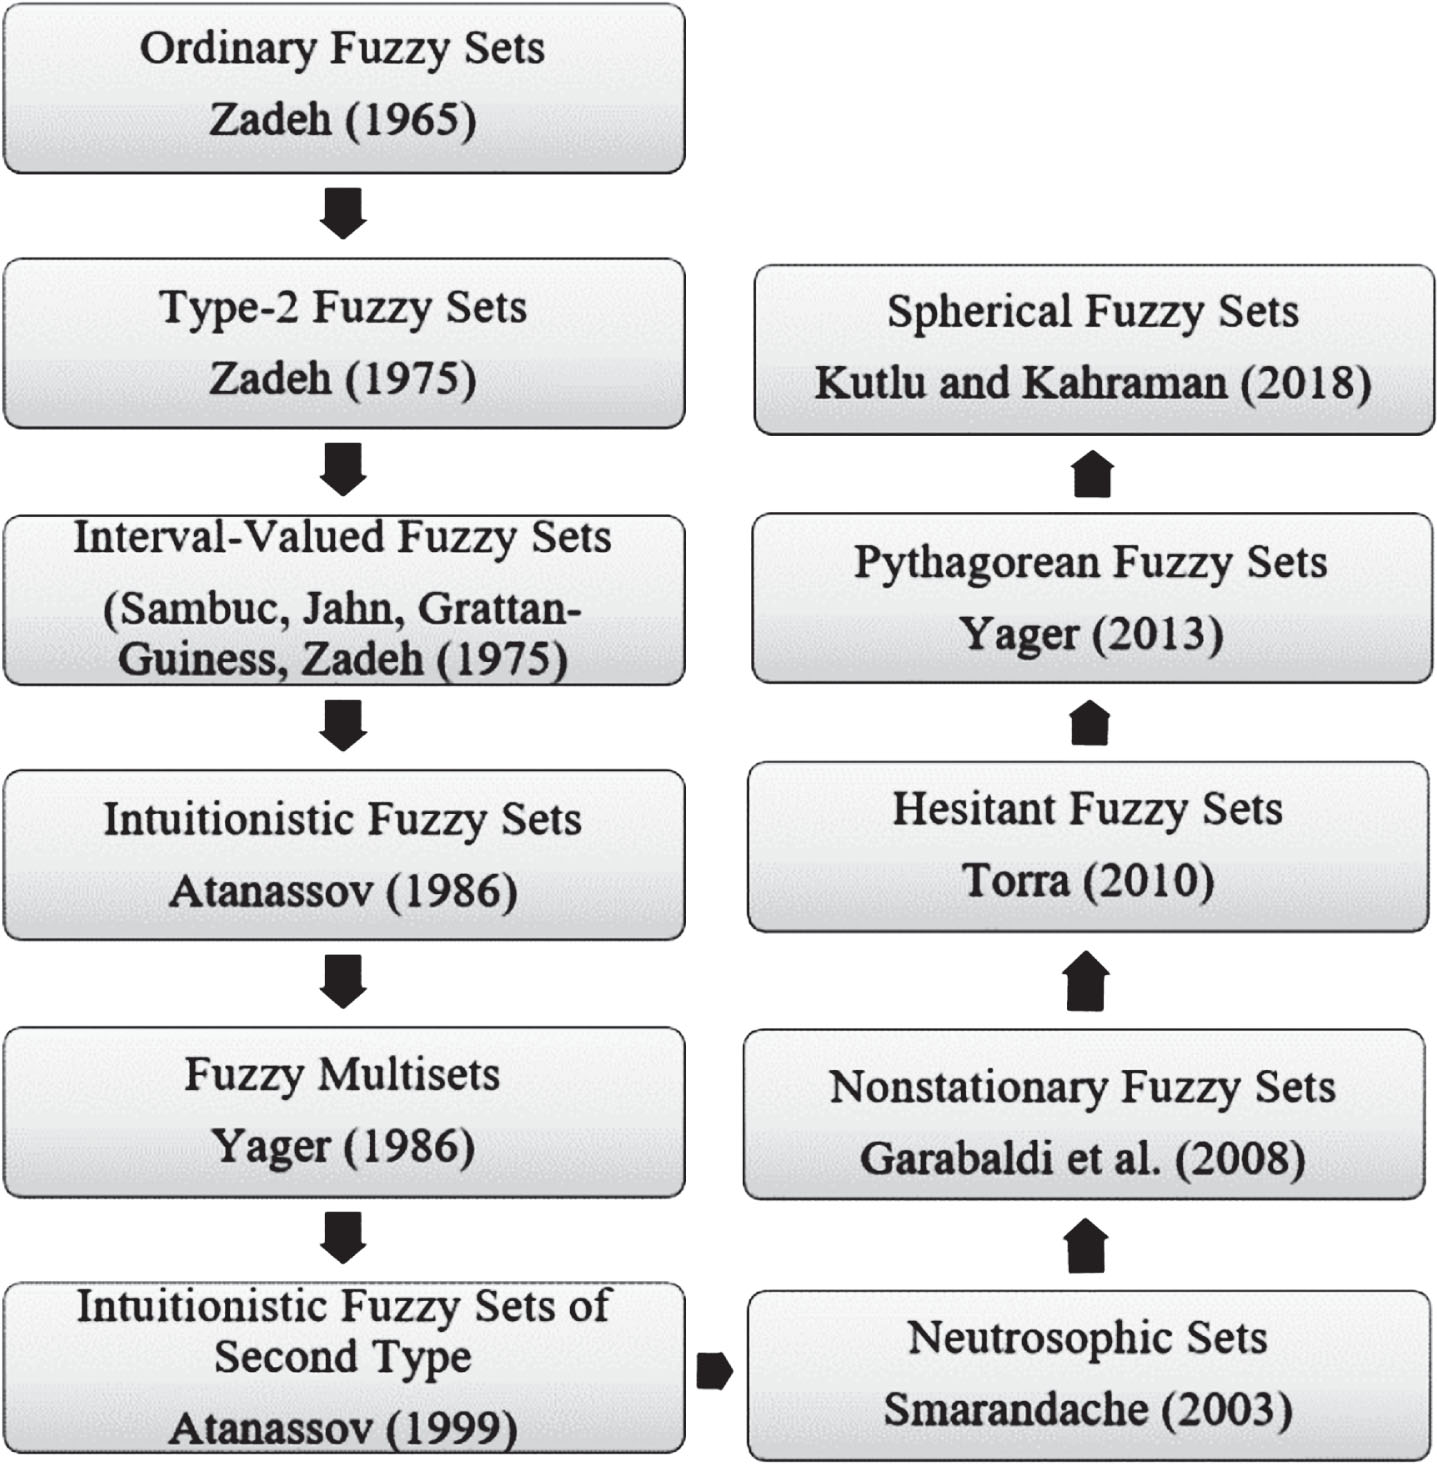
Extensions of fuzzy sets.
In the following, these extensions are briefly explained except interval-valued fuzzy sets (IVFS), fuzzy multisets (FM), and nonstationary fuzzy sets (NFS) since IVFS, FM, and NFS that are rarely used by researchers. Then, a literature review on their usage for hypothesis tests is presented.
Zadeh [32] introduced the fuzzy set theory to the literature. The first type of fuzzy sets is ordinary fuzzy sets, which are represented by only a membership degree for an x value is given as:
Among the types of fuzzy sets, ordinary fuzzy sets are the most used sets in fuzzy hypothesis testing. In these works, either the data are fuzzy, or the hypotheses are fuzzy. Some representative works are as follows: [1, 71]. Also, some representative studies on statistical decision making and statistical convergence using fuzzy sets are as: [47–50].
Zadeh [33] developed type-2 fuzzy sets since ordinary fuzzy sets (type-1 fuzzy sets) were criticized by some researchers. A type-2 fuzzy set
There are few works on type-2 fuzzy hypothesis testing in the literature. Garcia et al. [24] presented a general inference engine based on interval type-2 fuzzy logic systems to contrast statistical hypothesis on means. Ganesh and Jaimaruthi [2] introduced a procedure for hypothesis testing for imprecise data based on interval type -2 generalized hexagonal fuzzy numbers.
Let U be a universe of discourse. An intuitionistic fuzzy set
For any intuitionistic fuzzy set
Intuitionistic fuzzy sets are a generalization of Zadeh’s [32] ordinary fuzzy sets. These sets involve the degrees of membership and non-membership together with experts’ hesitancies. Intuitionistic fuzzy sets have provided a new point of view to hypothesis testing, which is called intuitionistic fuzzy hypothesis testing. There are few papers on intuitionistic fuzzy hypothesis testing in the literature. Akbari and Arefi [41] presented a nonparametric approach to test statistical hypotheses based on intuitionistic fuzzy data. They defined a confidence interval based on intuitionistic fuzzy data. Zainali et al. [72] introduced a new approach for statistical hypotheses testing for population variance based on an intuitionistic fuzzy sample. Hesamian and Akbari [17] proposed a statistical method for testing intuitionistic fuzzy hypotheses by extending the concepts of type-1, type-2, power test, and p-value which can be used in both parametric and non-parametric statistical tests with intuitionistic fuzzy hypotheses. They illustrated their method with examples for both parametric and non-parametric cases. Anuradha and Kalpanapriya [13] proposed a heuristic statistical method for testing intuitionistic fuzzy hypotheses of one factor and two factor ANOVA model using intuitionistic fuzzy data samples and they present some numerical examples using R studio to clarify their method. Akbari and Hesamian [40] extended the classical Neyman–Pearson lemma based on a random sample of exact observations to test intuitionistic fuzzy hypotheses. They provided some examples to illustrate their method and compare with an existing model.
Hesitant fuzzy sets are defined as follows:
To the best knowledge of the authors, there is no published paper on hesitant fuzzy hypothesis testing.
Let U be a universe of discourse. Neutrosophic set
Smarandache [16] discussed neutrosophic hypothesis testing in his book including Neutrosophic Hypothesis Testing Errors and Neutrosophic Level of Significance.
Let U be a universe of discourse. A Pythagorean fuzzy set
For any Pythagorean fuzzy set
To the best knowledge of the authors, there is no published paper on Pythagorean fuzzy hypothesis testing.
Kutlu Gündoğdu and Kahraman [15] developed the spherical fuzzy sets. The novel concept of spherical fuzzy sets provides a larger preference volume for decision makers to assign their judgments about membership, non-membership and hesitancy degrees. Decision makers can define their hesitancy information about an alternative with respect to a criterion in a larger domain. Membership, non-membership and hesitancy degrees of decision makers are assigned independently providing that their squared sum is at most equal to 1. The definition space constructs a unite sphere divided by 8.
To the best knowledge of the authors, there is no published paper on spherical fuzzy hypothesistesting.
Z Fuzzy numbers: Preliminaries
Zadeh [34] defined a Z-fuzzy number as an ordered pair of fuzzy numbers, (A, B) where A is a restriction function and B is a reliability function defined to represent the reliability level to the restriction function. Z-fuzzy numbers aim at providing a basis for computation with numbers which are not totally reliable.
A Z-fuzzy number

A simple Z-fuzzy number.
Consider a Z-fuzzy number
Firstly, the second part (reliability) can be converted into a crisp number by using Equation (8).
Alternatively, the defuzzification formula in Equation (9) can be used for triangular fuzzy numbers.
Then, the weight of the second part (reliability) is added to the first part (restriction). The weighted Z-fuzzy number can be denoted as
Thus, the Z-fuzzy number is converted to a regular fuzzy number. A regular fuzzy set can be denoted as

Regular fuzzy number converted from Z-fuzzy number.
If the restriction and reliability functions are defined as in Fig. 4, where their heights may be any value between 0 and 1, the calculations can be modified as follows:
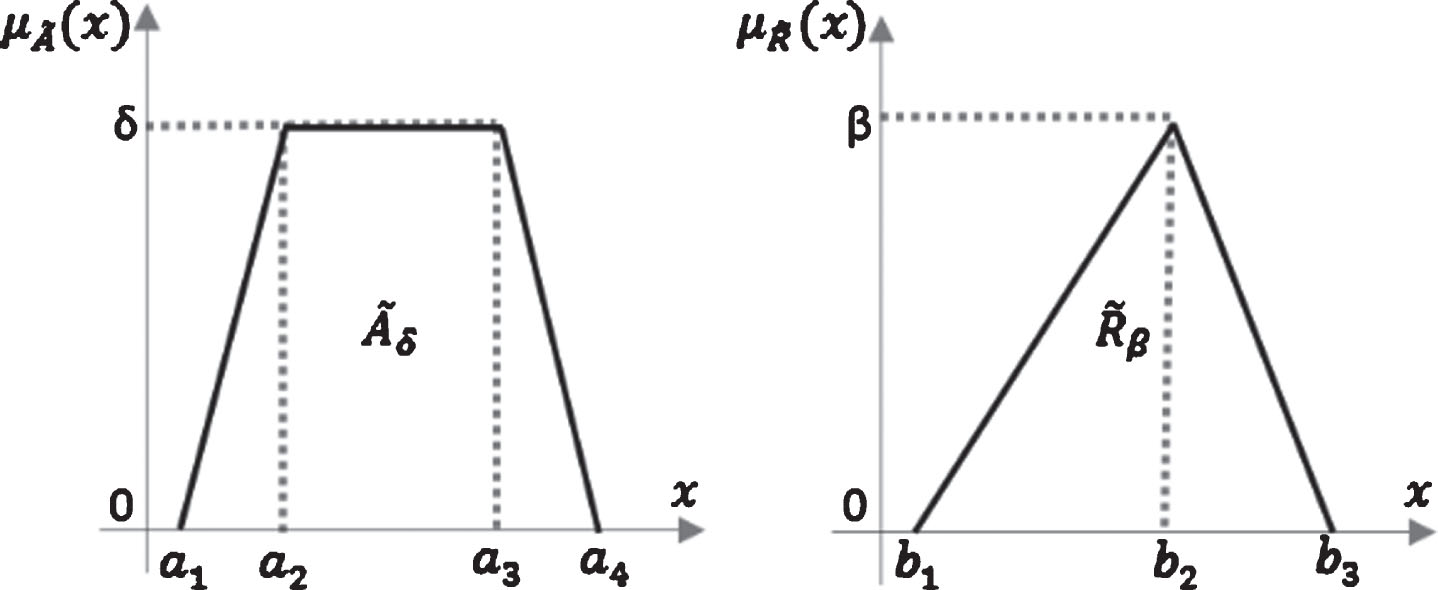
A simple
Let
In this case, restriction and reliability functions are defined as in Equations (10) and (11), respectively. The reliability membership function in Equation (11) is substituted into the defuzzification formula given in Equation (8). Thus, Equation (12) is obtained.
Thus, we have:
Then, the weighted
The regular fuzzy number converted from Z-fuzzy number can be given as in Equation (14).
In classical hypothesis testing, various random variables can be used such as
Step 1. Collect Z-fuzzy data including restriction and reliability values as given in Table 1.
Z-Fuzzy data
Z-Fuzzy data
Step 2. Defuzzify the reliability values and transform Z-fuzzy numbers to regular fuzzy numbers as shown in Table 2.
Regular fuzzy numbers
Step 3. Compute the mean of the regular fuzzy numbers,
When a regular fuzzy number is triangular, it is denoted as a trapezoidal fuzzy number by duplicating the middle value.
Step 4. Construct the left and right side functions of the mean as in Equations (17) and (18), respectively.
Step 5. Set the hypothesis tests with respect to one of the left, right, or two sided tests as given in Table 3.
Possible hypothesis tests
Step 6. Compute the confidence limits (CL) by using the significance level, sample size and standard deviation.
For left sided hypothesis testing:
For right sided hypothesis testing:
For two sided hypothesis testing:
Step 7. Determine the place of the value in the null hypothesis on the membership function of confidence limits as illustrated in Fig. 5.
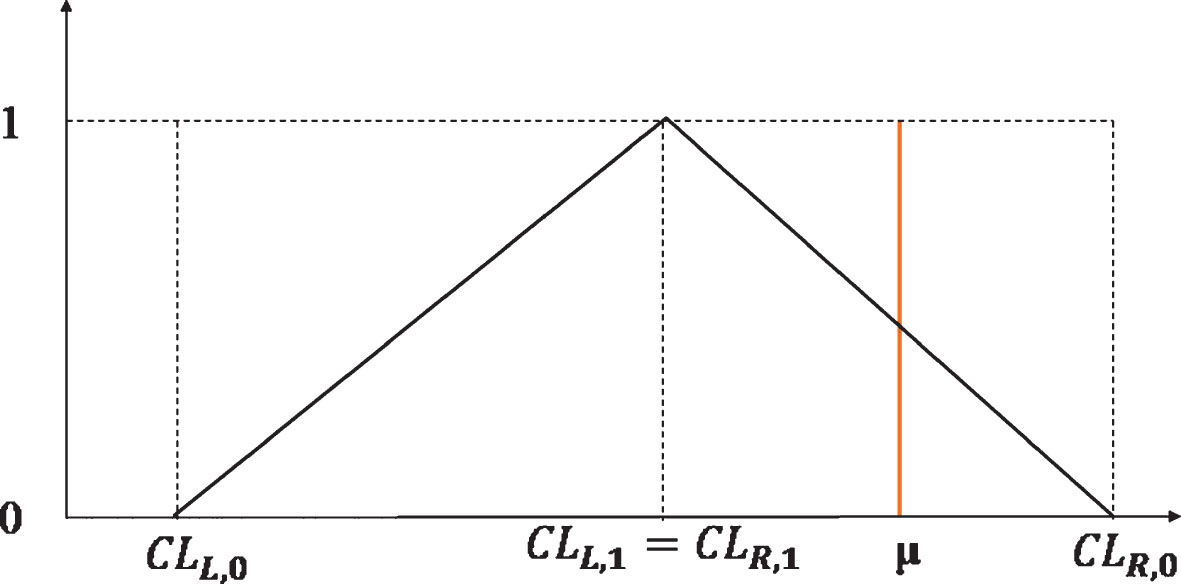
Graph for decision making.
Step 8. Make a decision about if the null hypothesis is rejected or not rejected.
A photovoltaics panel seller investigates the customers’ satisfaction degree of their product. The seller conducted a survey to determine the satisfaction degree of the 15 customers who bought the considered product at least one year ago. The seller wonders if the customers’ satisfaction degree is less than 65. The significance level (δ) is determined to be 5%. The standard deviation of the satisfaction degrees is estimated as σ = 5.
Step 1. The satisfaction degrees have been collected as triangular fuzzy numbers together with their reliability data. Restriction data show the satisfaction degrees on a 0-100 scale whereas reliability data are on a 0-1 scale (See Table 4).
Z- Fuzzy data
Z- Fuzzy data
Step 2. The reliability values were defuzzified and the Z-fuzzy numbers were transformed to regular fuzzy numbers (See Table 5).
Defuzzified reliability values
Step 3. We computed the mean of the regular fuzzy numbers,
Step 4. We constructed the left and right side functions of the mean (See Table 6).
Left and right side functions of the mean
Step 5. We set the hypotheses as follows.
Step 6. We computed the left and right confidence limits
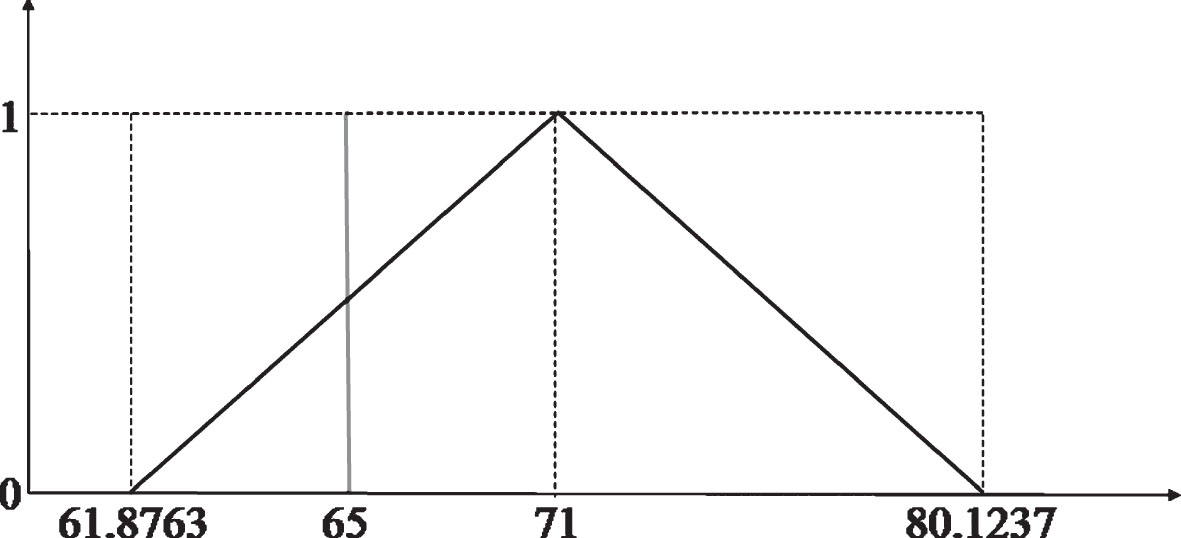
Step 7. We determined the location of the value in the null hypothesis on the membership function of confidence limits as shown in Fig. 6.
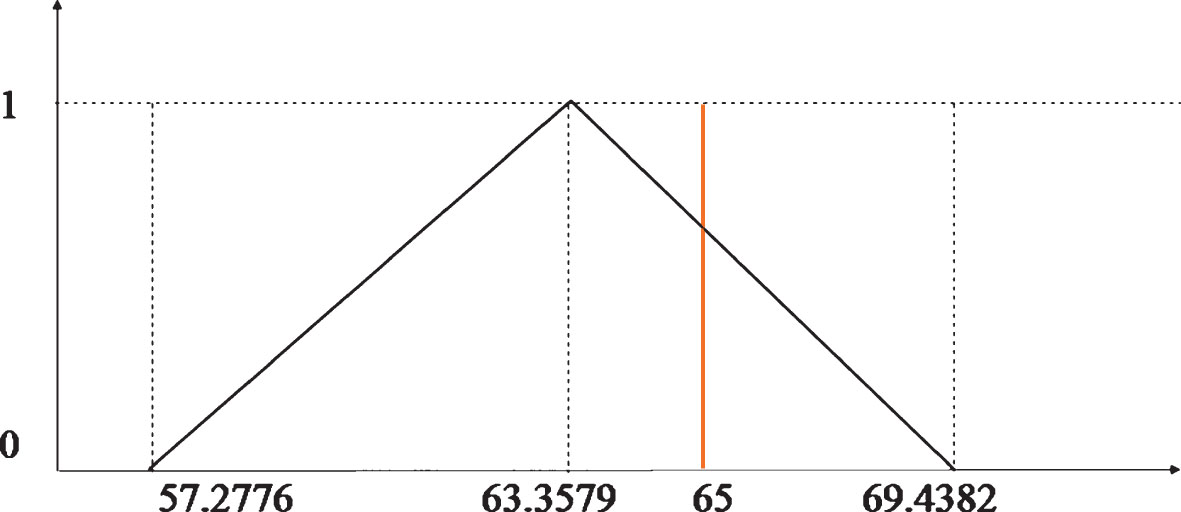
Left sided hypothesis test.
Step 8. We “rather reject” the null hypothesis since the hypothesized value is between [63.3579, 69.4382].
Now let’s assume the seller wonders if the customers’ satisfaction level is larger than 70.
We “accepted” the null hypothesis since the hypothesized value is larger than the fuzzy confidence interval [53.0302, 65.1908] as shown in Fig. 7.
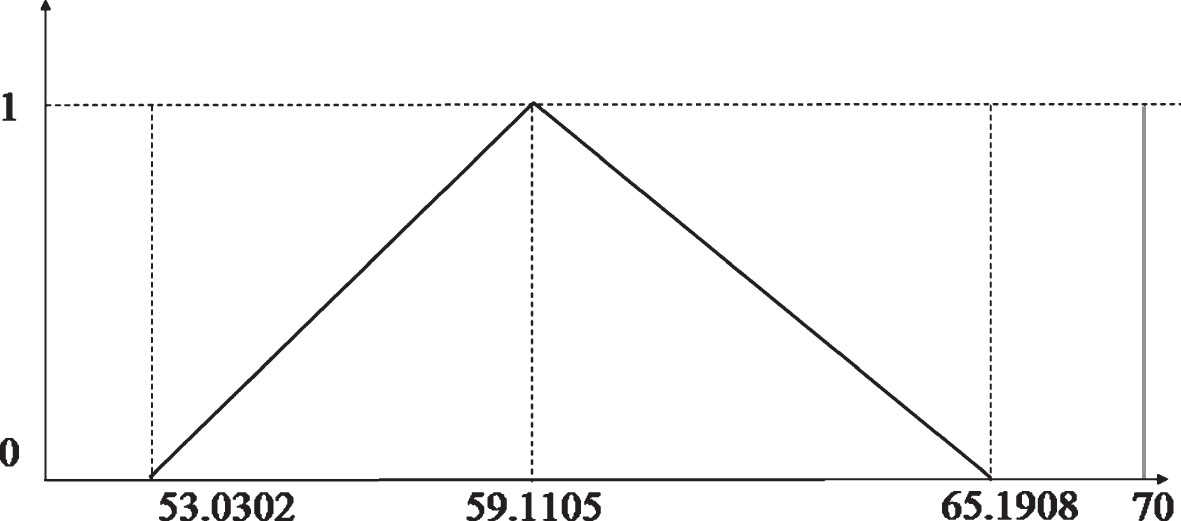
Right sided hypothesis test.
We compared our method with the classical fuzzy hypothesis testing using the left sided hypothesis testing. For this aim, we considered only the restriction data given in Table 4, ignoring the reliability data. In this case, the new average of the fuzzy restriction data is calculated as (64,71,78). The left and right membership functions of the average are obtained as in Table 7.
Left and right side functions of the mean
Left and right side functions of the mean
We computed the left and right confidence limits
Figure 8 illustrates the result of the classical left sided hypothesis testing. The decision is now “rather accept” whereas it was “rather reject” in the Z-fuzzy hypothesis testing approach.
Classical fuzzy hypothesis testing result for comparison.
In this sub-section, we analyzed the sensitivity of our decision with respect to the significance levels. When the left sided test is considered, we observed that our decision is quite insensitive to the changes in significance levels. However, when the significance level becomes 0.00175 or less, the decision turns to be “Rather Accept H0”. On the other hand, the null hypothesis is “rejected” when the significance level is at least 0.9635. The calculation results are presented in Table 8.
Sensitivity analysis for left sided test
Sensitivity analysis for left sided test
When the right sided test is considered, we observed that our decision is quite insensitive to the changes in significance levels. However, when the significance level becomes 0.9815 or greater, the decision turns to be “Rather Accept H0”. The calculation results are presented in Table 9.
Sensitivity analysis for right sided test
Hypothesis testing under vagueness is a research area that a lot of publications have been made in the literature. However, there is a large gap for hypothesis testing by using the new extensions of ordinary fuzzy sets. Intuitionistic fuzzy HTs, Pythagorean fuzzy HTs, neutrosophic HTs, spherical fuzzy HTs are open areas for hypothesis testing in the literature.
A Z-fuzzy number is a kind of extension of ordinary fuzzy sets, defining a fuzzy event with its reliability function. In this paper, we attempted to develop Z-fuzzy hypothesis testing and presented illustrative examples together with a sensitivity analysis.
For further research, we suggest trapezoidal type Z-fuzzy numbers to be employed in hypothesis testing. Another possible further research area is to study on how a full Z-fuzzy approach without converting a Z-fuzzy number to a regular fuzzy number can be developed.