Twitter is a popular microblogging platform, which facilitates users to express views and thoughts on day-to-day events using short texts limited to a maximum of 280 characters. However, it is generally targeted by socialbots for political astroturfing, advertising, spamming, and other illicit activities due to its open and real-time information sharing and dissemination nature. In this paper, we present a socialbots analysis-driven graph-based approach for identifying coordinated campaigns among Twitter users. To this end, we first present statistical insights derived from the analysis of logged data of 98 socialbots, which were injected in Twitter and associated with top-six Twitter using countries. In the analysis, we study and present the impact of socialbots’ profile features, such as age and gender on infiltration. We also present a multi-attributed graph-based approach to model the profile attributes and interaction behavior of users as a similarity graph for identifying different groups of synchronized users involved in coordinated campaigns. The proposed approach is experimentally evaluated using four different evaluation parameters over a real dataset containing socialbots’ trapped user profiles. The evaluation of identified campaigns in the form of clusters reveals the traces of spammers, botnets, and other malicious users.
Nowadays, a majority of the people, particularly the younger generation, are registered on one or more Online Social Networks (OSNs) that facilitate them to connect and keep in touch with their family members, friends, acquaintances, and colleagues irrespective of their geographical location and boundary. People use OSNs generally for news propagation, entertainment, gaming, thought-expression to raise social issues and awareness, information diffusion, and so on [1–4]. On the contrary, affordable accessibility, wider reachability, and easy to use functions of OSNs attracted criminals and defaulters to use them for various illicit activities, such as spamming, cyberbullying, cyberstalking, identity theft, and so on [5, 6]. Kayes et al. [7] described the threats and privacy issues faced by the OSN service providers and their users, including a description of the threats-generating entities. They also provided a detailed description of the existing mitigation strategies. Meanwhile, researchers have proposed various spammers and malicious accounts detection approaches for different OSNs [8, 9].
Socialbots and coordinated campaigns in OSNs
In OSNs, cybercrimes and illicit activities are generally committed using fake profiles in various forms, such as sybils, sockpuppets [10]. In sybil attack, an adversary creates multiple fake profiles in an OSN to compromise the trust network [11], whereas, in case of sockpuppets, adversary creates multiple fake profiles to deceive other users of the network to carry out opinion manipulation, astroturfing, and other sophisticated attacks [12]. Although fake profile creation is easy in OSNs, manually handling them is neither economically feasible nor scalable. Therefore, depending on the end objective, malicious users automate these profiles in different forms, such as spambots, clickbots, cyborgs, and so on [13]. Socialbots are computer programs to handle OSN profiles and emulate human behavior to pass themselves as real human beings to gain the trust of other users to further exploit it for malicious and illicit activities [14]. Socialbots that are injected in an OSN for spamming are called social spambots, whereas socialbots that are assisted by the human during their operations are called cyborgs [13]. In OSNs, socialbots are generally state/government-sponsored and used as a tool for political astroturfing, propaganda diffusion, etc. against rivals [15, 16]. Twitter, as a microblogging platform to express views and ideas on any topic of interest and get updated by others, seems to be an ideal platform to socialbots for such sophisticated attacks because prime objectives of these socialbots are generally opinion and behavior manipulation of network users. In OSNS, socialbots are also used to generate low-quality contents [17]. Therefore, to understand the working behavior of socialbots, their infiltration efficacy, and categories of vulnerable users and their geographical regions, we injected 98 socialbots in Twitter, monitored them, and logged their activities for analysis at different levels of granularity.
In OSNs, injected socialbots are assisted by existing fake profiles and socialbots. Fake accounts and socialbots are generally created in large numbers, which operate in a coordinated manner to deceive benign users towards opinion manipulation, propaganda diffusion, and spamming [16–18]. These malicious campaigns are operated by adversaries in a way that they seem genuine. However, users involved in such campaigns have a certain level of similarity in terms of activity behavior, content, and account properties. The malicious socialbots operating in a coordinated manner are harmful to both OSNs and their users. Therefore, the characterization and detection of coordinated campaigns in OSNs is a vital and challenging research problem. To this end, this paper presents a multi-attributed graph-based approach for identifying coordinated campaigns in Twitter.
Our contributions
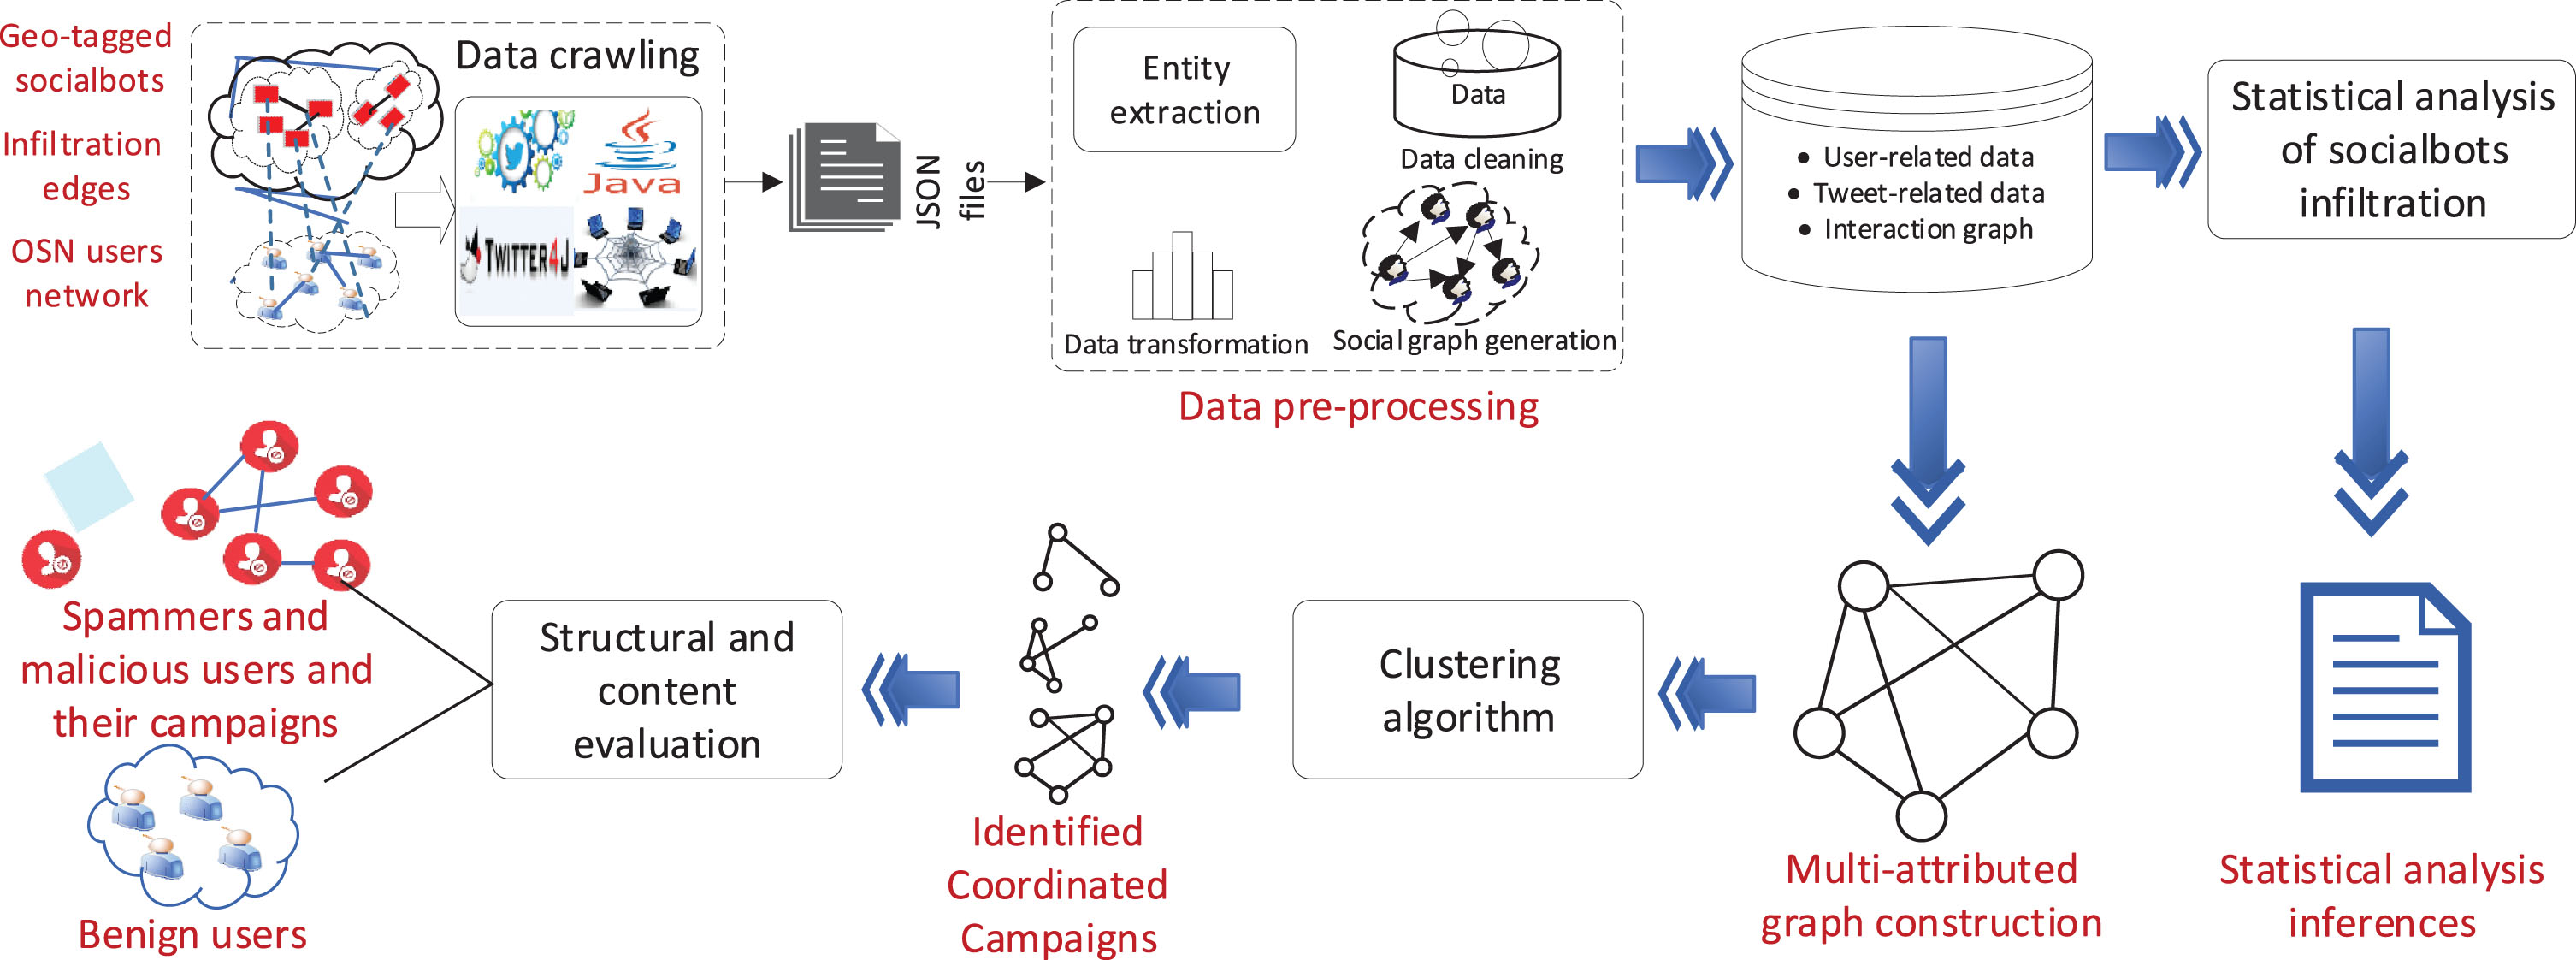
In the existing literature, researchers have performed several socialbots injection experiments to observe their impact and infiltration efficacy [14, 20]. To the best of our knowledge, none of them has ever analyzed the regional association of socialbot profiles on their infiltration performance. This work, which is an extension of one of our previous works [21], analyzes the geographical association of socialbots on their infiltration performance. On analysis, we noticed several interesting observations. In OSNs, during evolution as influential users, socialbots are assisted by trapped users who could be either benign or malicious. Malicious users generally operate in coordination towards a certain campaign, such as political astroturfing and advertisement. Therefore, to detect the coordinated campaigns among Twitter users, we present a multi-attributed graph-based modeling approach for identifying a synchronized group of users based on their profile attributes and activities. The multi-attributed graph is converted into a similarity graph, and Markov clustering is applied to identify different groups of coordinated and synchronized users, such that the attribute and behavior similarity among the intra-cluster users is high and that among the inter-cluster users is low. The identified clusters are evaluated using four different evaluation metrics. The proposed approach is experimentally evaluated over a real-world Twitter dataset of socialbots’ trapped users. Figure 1 presents a work-flow of the proposed approach. In short, the main contributions of this paper can be summarized as follows:
A thorough statistical analysis of the infiltration capabilities of socialbots of different geographies, in terms of the impact of their profile features on infiltration.
A multi-attributed graph-based approach to model users’ profile features and activities for identifying coordinated campaigns in Twitter.
A detailed analysis of identified user groups to reveal the traces of spammers and botnets operating in Twitter.
Work-flow of the proposed approach for analysis and detection of coordinated campaigns among Twitter users.
Related works
The large amount of data generated through OSN users’ activities has opened the door for various research problems, such as sentiment analysis, predictive analytics, emotion analysis, and customer behavior analysis [22, 23]. However, OSNs have also provided a very fertile ground for adversaries to carry out various illicit activities using different forms of malicious profiles. With the evolution of OSNs, a new breed of the bot called “socialbot” has proliferated these networks for illicit purposes [24]. In the existing literature, there is many instances, where socialbots and their misuse have been observed and reported in the form of propaganda diffusion, political astroturfing [16, 17], identity theft [25], spear-phishing [18], fake news diffusion [26], and so on. As the problem evolved, researchers tried to conceive their working behavior and its impact on manipulating the structural properties and users’ discourse in different OSNs. To this end, some live competitions
1
,
2
have been organized to inject and observe the impact of socialbots in social networks. Boshmaf et al. [14, 27] presented a complete description of socialbots network creation and operation process and discussed the existing inherent vulnerabilities of OSNs which are exploited by the ill-intended spammers and bots. In [14], Boshmaf et al. thoroughly analyzed the economic feasibility of organizing the socialbots attack, and presented a categorization of different bot detection approaches. Meanwhile, Aiello et al. [28] injected and analyzed the efficacy of a socialbot to infiltrate users in aNobi, a popular OSN in Italy among book-lovers to manage and review the books. On analysis, the authors found that the injected socialbot having no reputation reached among the top influential users of the network, just by browsing and investigating other users’ profiles. It proves that even passive socialbots can be infiltrative. On the contrary, authors in [20, 29] used an active approach for infiltration and targeted the selected groups of users to analyze the infiltration performance. Elyashar et al. [20] injected socialbots to breach users of a technical organization using the information revealed by them on Facebook, demolishing the belief that security-aware users cannot be infiltrated. On the other hand, Zhang et al. [29] programmed socialbots to exploit the Twitter’s strategy to suspend only originators, not distributors of the spam messages and used it for users’ influence score manipulation. In another experiment, Freitas et al. [19] injected 120 socialbots in Twitter and operated them for 30 days. The authors performed the factorial experiment to find out effective infiltration strategy and inferred that highly active socialbots were more successful in infiltrating network users. Meanwhile, 38 socialbots were suspended by the Twitter. On analysis, authors found that socialbots posting automated tweets were more vulnerable to get detected and suspended by the Twitter’s defense mechanism. In another experiment, two socialbots were injected in Twitter and it is observed that they easily manipulated reputation metrics, such as Klout-score [30]. Authors also found that one of the two socialbots gained the Klout-score close to celebrities and influential users.
In an interesting observation while crawling tweets related to Syrian crisis, Abokhodair et al. [15] unearthed a social botnet network of 130 bots. In the paper, the authors presented their evolution in terms of activities and influence and further analyzed their difference from benign users in terms of tweets’ content. Cresci et al. [31] experimented with three different types of accounts –genuine, conventional spambots, and social spambots, and found that though Twitter defense mechanism is efficient in detecting conventional spambots, but it fails to detect social spambots. Through crowdsourcing, they further concluded that even human users are not good enough in differentiating the social spambots from traditional spambots. Authors also characterized the users who are susceptible to be misled by socialbots. Similarly, Wald et al. [32] characterized and predicted users who can be easily persuaded to either interact with or reply to socialbots. The authors further used various features ranking techniques to rank the characterizing features and found that Klout-score is the most effective feature to predict the users’ interaction and reply with socialbots. In an approach, Fazil et al. [33] grouped the socialbot targets into three categories –active, reactive, and inactive, depending on their connection formation behavior with the socialbots. Further, they trained machine learning-based classification models for the categorization of three categories of users. In the existing literature, researchers have also proposed several approaches to characterize and detect the socialbots on different OSNs [8, 34]. Recently, Conference and Labs of the Evaluation Forum (CLEF) organized a competition [35] in which participants were asked to profile OSN users to classify them as bots or real-humans. The participants were also asked to present a gender prediction approach for the profiles detected as human. A total number of 56 teams participated in the competition, and their approaches were evaluated over two datasets –one containing English language bots and the other containing Spanish language bots. Finally, 46 teams submitted the notebook paper. Over Spanish dataset, character and word n-gram features-based approach by [36] performed best with an accuracy of 93.33%, whereas Johansson’s approach [37] showed the best performance with an accuracy of 95.95% over the English dataset. Towards coordinated campaign detection, Gao et al. [38] presented a posts similarity-based approach to characterize and detect the spam campaigns in Facebook. Authors created a graph based on the similarity of the content of posts and URLs that are further processed to identify the subgraphs, representing the different spamming and malicious campaigns.
Socialbots injection experiment
This section presents a detailed description of socialbots injection process –starting from profile creation to running the whole socialbots network for approximately four weeks including the description of activities performed by them.
Profile creation and distribution
The presence of a person in an OSN is determined by an account having some of his/her personal information, such as name, address, age, gender. Accordingly, we manually created the socialbots’ profiles and adjusted their features as per the requirements rather than purchasing profiles from third-party vendors or generating them using automated profile creation tools
3
. Profile attributes were adjusted to disguise them as real human beings. Created profiles were associated with top-six Twitter using countries
4
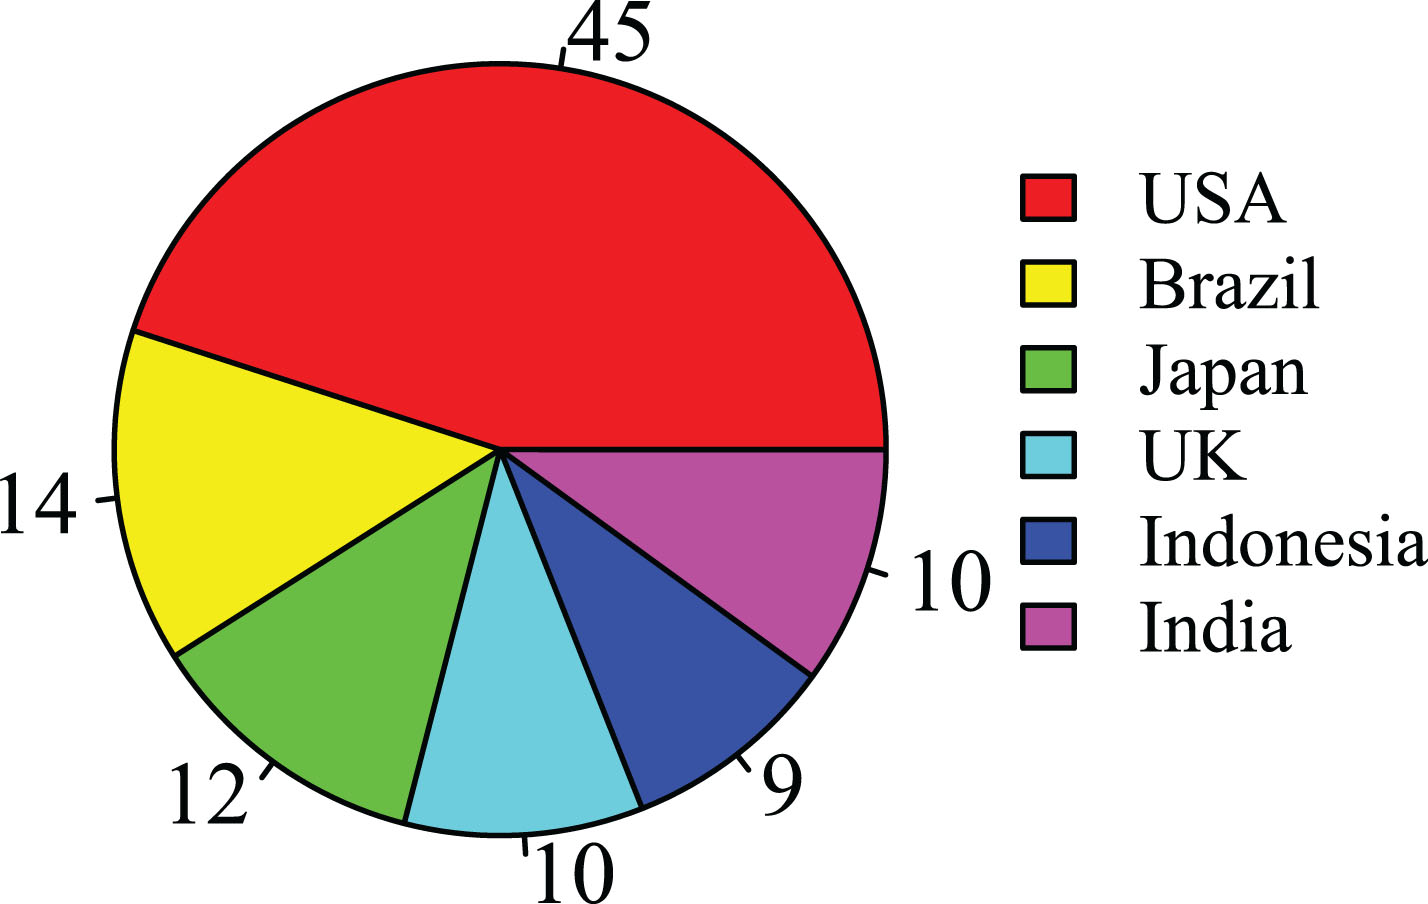
, in terms of their user-base (in millions). Figure 2 shows worldwide Twitter users’ distribution of top-six countries in which the USA leads the list, followed by Brazil, Japan, and so on. Number of socialbots allocated to top ith country is proportional to its user-base (in millions) to the sum of user-bases of top-six countries as given in equation 1, where and are the number of assigned socialbots and user-base of top ith country, respectively. Figure 3 shows the number of socialbots assigned to each country, where numbers are slightly different from calculated ones using equation 1 to make the socialbots count of each country be at least 10% of the total number of socialbots i.e. 98. Initially, it was 100 but right after the beginning of the operation, two profiles were not working properly. Therefore, we dropped those two socialbots and the rest of the experiment was performed with only 98 socialbots. Among the 98 socialbots, male and female profiles were 47 and 51, respectively following the Twitter’s gender distribution, though it provides no option to reveal the gender, which is implicitly revealed by name, profile picture and description, etc. Therefore, these characteristics were adjusted accordingly for every socialbot depending on his/her gender. Further, within a country, equal numbers of male and female socialbots were created. We used the profile picture to exhibit age except a few for whom the date of birth was provided. We adjusted the socialbots’ age as per the Twitter age distribution
5
. However, during every step of profile creation, we did our best to follow the Twitter distributions to determine the values of socialbots’ profile attributes. Profiles were created between 1st November 2015 to 3rd January 2016. The pictures used in the profiles were crawled from the innermost pages of Google Image. We generally used pictures, which were little-bit blurred or face was not straight. However, to protect users’ privacy, profile pictures were deleted after the experiment and not distributed to any third party/person. These profiles were operated through computer programs in a deceptive manner to imitate human behavior, and consequently to term them as socialbots. To this end, an application named TrueBot was developed and hosted on a LinuxApache web server.
Twitter user distribution (in millions).
Country-wise socialbots distribution.
Socialbots injection and operation
Once the socialbots profiles creation process was completed, we started operating them using the TrueBot computer program to manage their activities in Twitter. In a social network, activities of a profile can be performed either through the Web or through application programming interfaces (APIs) of the underlying platform. The APIs are generally provided by the OSN platforms to facilitate their access to the third-party applications. Twitter provides two types of APIs –REST API and Streaming API. Since socialbots are the computer programs to operate social media profiles, they access and operate profiles using the APIs.
As discussed in Section 3.1, we developed an application called TrueBot to access the Twitter platform. Profiles were authenticated using TrueBot application to access the Twitter network, generating a set of four keys and tokens –consumer key, consumer secret key, access token, and access token secret when the profiles were authenticated for the first time. Thereafter, future interactions of profiles with Twitter are authenticated using the keys and tokens of the respective profiles. In the experiment, following the first authentication, profiles were activated at any time between 30 minutes to 8 hours for the first-time activity. Activity at first-time activation was performed based on the value of a random variable r, as given in equation 1, where random number of celebrities between 5 to 10 were followed for r=1. Celebrity handles were chosen from a database having a large number of celebrities handles. In the alternate case of the equation 1, 10 to 20% of socialbots of his/her country were followed within a random period of 30 minutes to 2 days. Future activation times for profiles were determined at present activation. All activities were performed using the REST API functions. Target users of socialbots were crawled either from the followers list of a celebrity of their home country or from the followers list of one of their followers. During the experiment, profiles were programmed to maintain the followers to followees ratio as at least 0.25 to evade existing socialbots detection approaches, which utilize network-based features. As a result, for a socialbot, whenever this ratio drops below 0.25, many followed users were unfollowed to adjust the ratio at 0.25. Similarly, socialbots were programmed to respond every following request to build a trust relationship in the network. In the experiment, socialbots were programmed to tweet using either of the three approaches –(i) tweeting quotes from a database, (ii) crawling tweets related to trending topics and hashtags and tweeting them as their own with some tuning or just retweeting them, or (iii) crawling and posting tweets from the followers’ timelines. Tweets were not generated using automated tweets generation techniques because though advanced language technologies can generate tweets, they are not semantically good enough. Tweets generated using language technologies can easily be identified by benign users. The socialbots network was operated for approximately four weeks between January 6, 2016, to February 2, 2016.
Socialbots evolution
In this section, we analyze the evolution of the socialbots during the experiment in terms of the number of grabbed followers. To this end, we divided the experiment duration in weeks and plotted the number of followers of each socialbot on the first day of each week of the experiment, which is shown in figure 4. It can be observed from this figure that socialbots failed to attract a sufficient number of followers in the first week as it was their evolution period, and they were also less interactive outside their network. Meanwhile, socialbots were programmed to establish trust through mutual followings. This figure also shows that the socialbots started trapping followers in the second week, and during the third and consecutive weeks they attracted a sufficient number of followers. On the contrary, some socialbots failed to attract users resulting in very few followers for them, as shown in sub-figures of figure 4. In addition, socialbots associated with India, Brazil, and the USA grabbed more followers and grew frequently. Figures 4(e) and 4(c) show slower growth rate for socialbots associated to Indonesia and Japan who were unable to attract users. Another interesting observation is that socialbots associated with the Brazil and UK started attracting a large number of followers in the fourth week until the suspension of the whole network by Twitter on the first day of the fifth week of the operation. We have also analyzed the effect of tweets frequency on infiltration and did not found any correlation, which is contradictory to the result presented in paper [19]. A fascinating observation is that even inactive users, in terms of tweets frequency, were successful to grab a large number of followers, whereas highly active users failed to grab followers.
Followers count growth for each socialbot across all six countries.
Ethical aspects
The socialbots injection experiment was conducted for academic research purpose to understand the impact of socialbots on the Twitter users of different geographies. In this experiment, we filtered radical and suspicious tweets during the tweets crawling from trending topics and followers’ timeline. Socialbots were programmed to retweet or tweet only those contents that were already floating on the Twitter. In addition, saved quotes were manually verified to not include inflammatory, racial, controversial, or provoking content. In light of the ethics-related issues discussed in [39], we have identified a set of ethical considerations which are presented in Table 1 that were compiled during and after the experiment. In the experiment, socialbots do not follow any users for any illicit intention.
Ethical considerations and their compliance
S.no.
Ethical consideration
Compliance
1
User consent
We did not inform the users because that may affect their normal behavior in the network.
2
Indirect exposure
Since we did not crawl the information of the followers of socialbots’ followers, there is no question of indirect exposure.
3
Exposure of human weaknesses
We identified certain human weaknesses towards socialbots or while accepting friend request from a known user.
4
Waste of resources
We did not create a large number of profiles that can make any burden on the Twitter network.
5
Impact on statistics
Creation of merely 98 socialbot profiles is negligible with respect to the existing Twitter user-base, and it cannot make any impact on the network statistics.
6
Exposure of sensitive information
We planted the socialbots using the APIs provided by Twitter. Therefore, we did not crawl information which is either sensitive or not provided by Twitter.
7
Confidentiality
We have not uploaded the data on any archive, and never shared it with any third person.
8
Anonymity
We have stored the crawled data in an encrypted format to ensure the privacy of the users.
Moreover, the experiment was done after its clearance from the departmental research ethics committee. During or post-experiment, we have not shared any private or public information of the crawled users to any third party and further ensure that it will not be shared in the future as well. Throughout the experiment, we tried our best not to violate Twitter’s terms of service
6
and privacy policy
7
at any level.
Infiltration performance analysis
In this section, we present an analysis of profile features efficacy towards manipulating network structure and users’ trust. The exploratory data analysis is performed at two levels of granularity –generic analysis and country-specific analysis, which are further explained in the following sub-sections.
Generic analysis
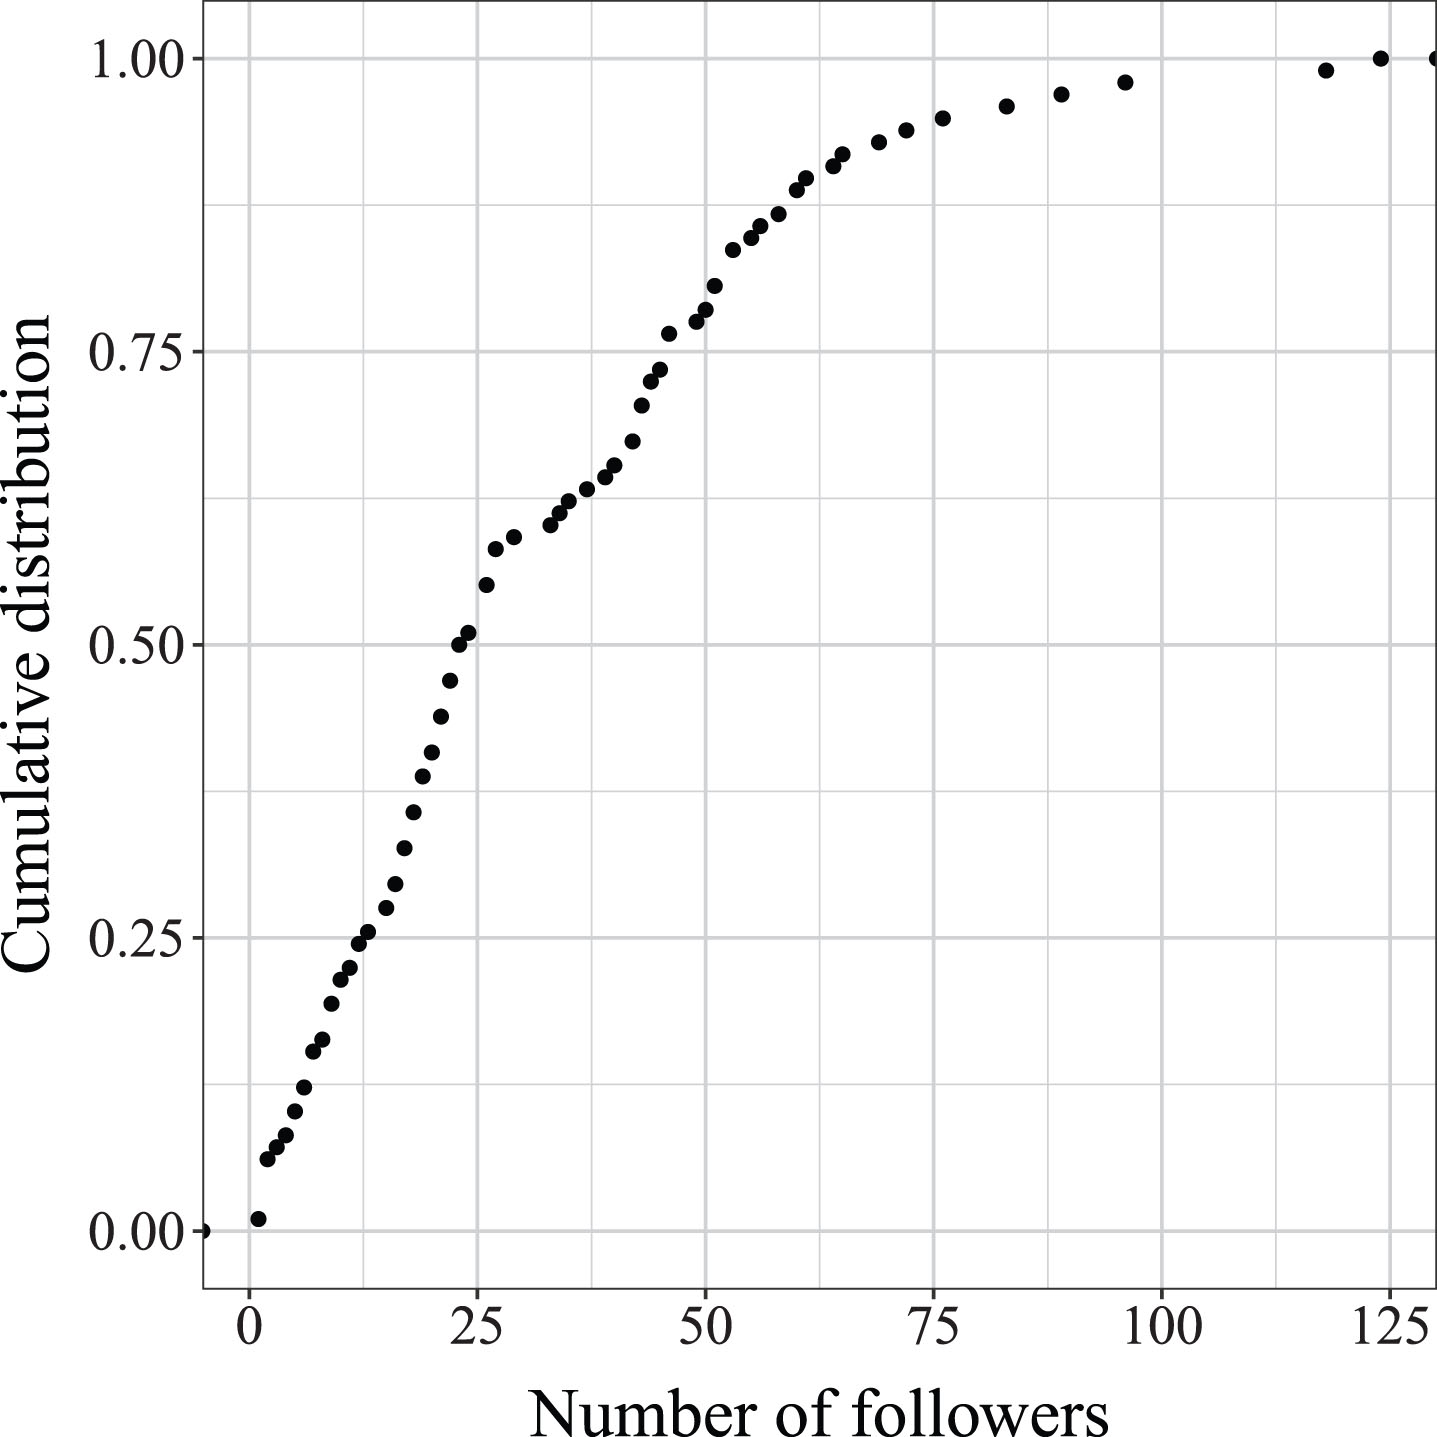
This section presents statistical analysis results, considering all the socialbots as a single entity without any grouping. In the line, first, we analyzed the effect of socialbots profile picture and inferred age in persuading other users to follow them or follow back (if socialbot has followed first). In Twitter, users infer the age of other users based on their profile picture, bio descriptions, alphanumeric in the handle, and so on [40, 41]. Therefore, based on age, the attributes of the socialbot profiles were adjusted accordingly. Figure 5 shows the number of followers grabbed by the socialbots of different ages. In the injection experiment, socialbots ages were assigned between 10 to 75 years. Further, the socialbots were categorized into three age groups representing young adult (younger than 25 years), matured adult (between 25 and 50 years), and old-age socialbots (older than 50 years). On analysis, matured adult socialbots were the most infiltrative with an infiltration rate of 38 users per socialbot. In contrast, young adult and old socialbots were mildly infiltrative, with an average infiltration rate of 28 and 30 users, respectively. High infiltration (follower rate) for matured socialbots represents that these users use Twitter for thought expression and to get updated with other users’ views rather than using it as an entertainment platform. Further, we performed a statistical significance analysis using two sample t-test to analyze the difference in the infiltrative power of every pair of three socialbot groups. On significance analysis, the difference in the infiltration power of each pair of socialbot groups was statistically insignificant. To have a better understanding, the cumulative distribution of the number of followers grabbed by socialbots is shown in figure 6. It can be observed from the figure that it follows an exponential distribution, and 58% of the socialbots have less than 25 followers.
Number of followers vs. age of socialbots.
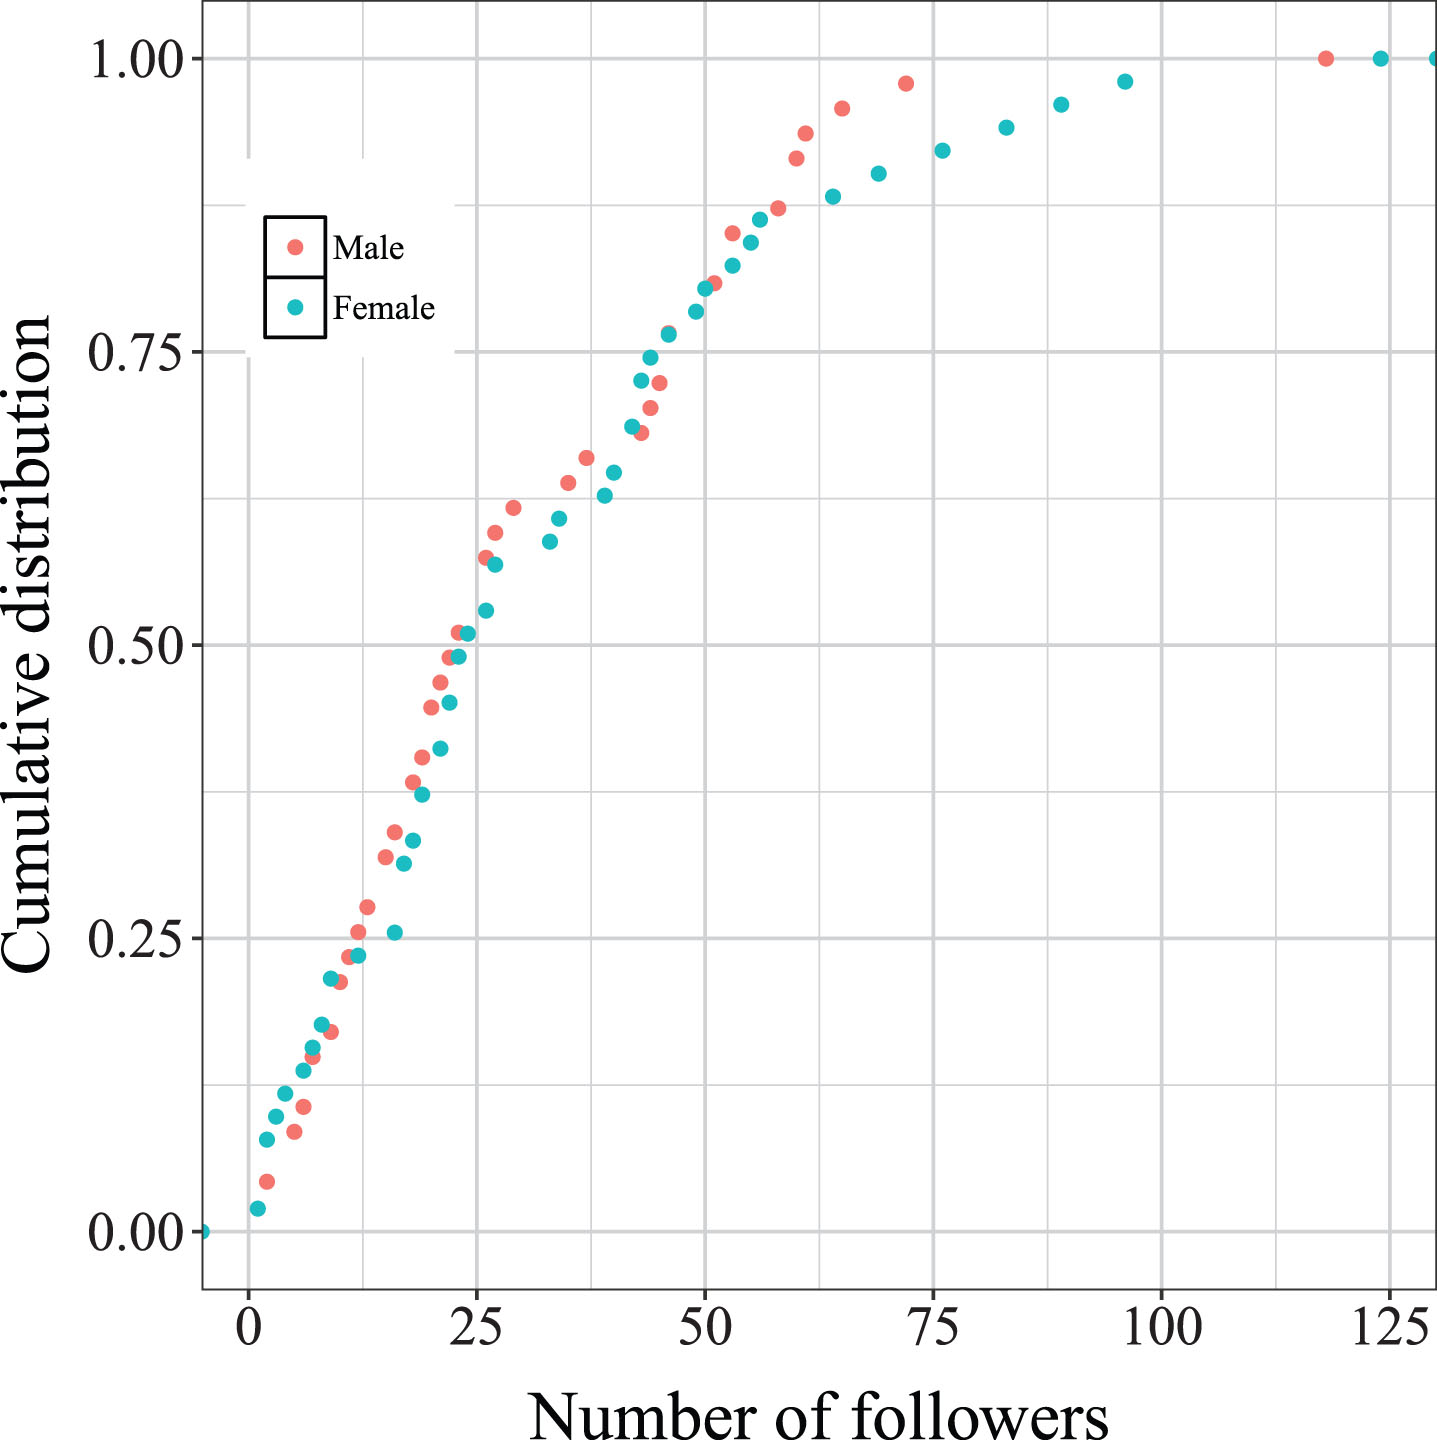
Further, we analyzed the impact of socialbots’ gender on their infiltration performance. Figure 7 represents the gender-based cumulative distribution of socialbots’ followers count, which shows that gender does not have any significant contribution in followers grabbing, except the case of profiles with fascinating profile-picture and description to entice the users. The inferred conclusion that gender did not have any significant impact on infiltration is in-line with other similar results presented in [18, 42].
Cumulative distribution of socialbots’ followers count.
Cumulative distribution of gender-wise socialbots’ followers count.
Country-specific analysis
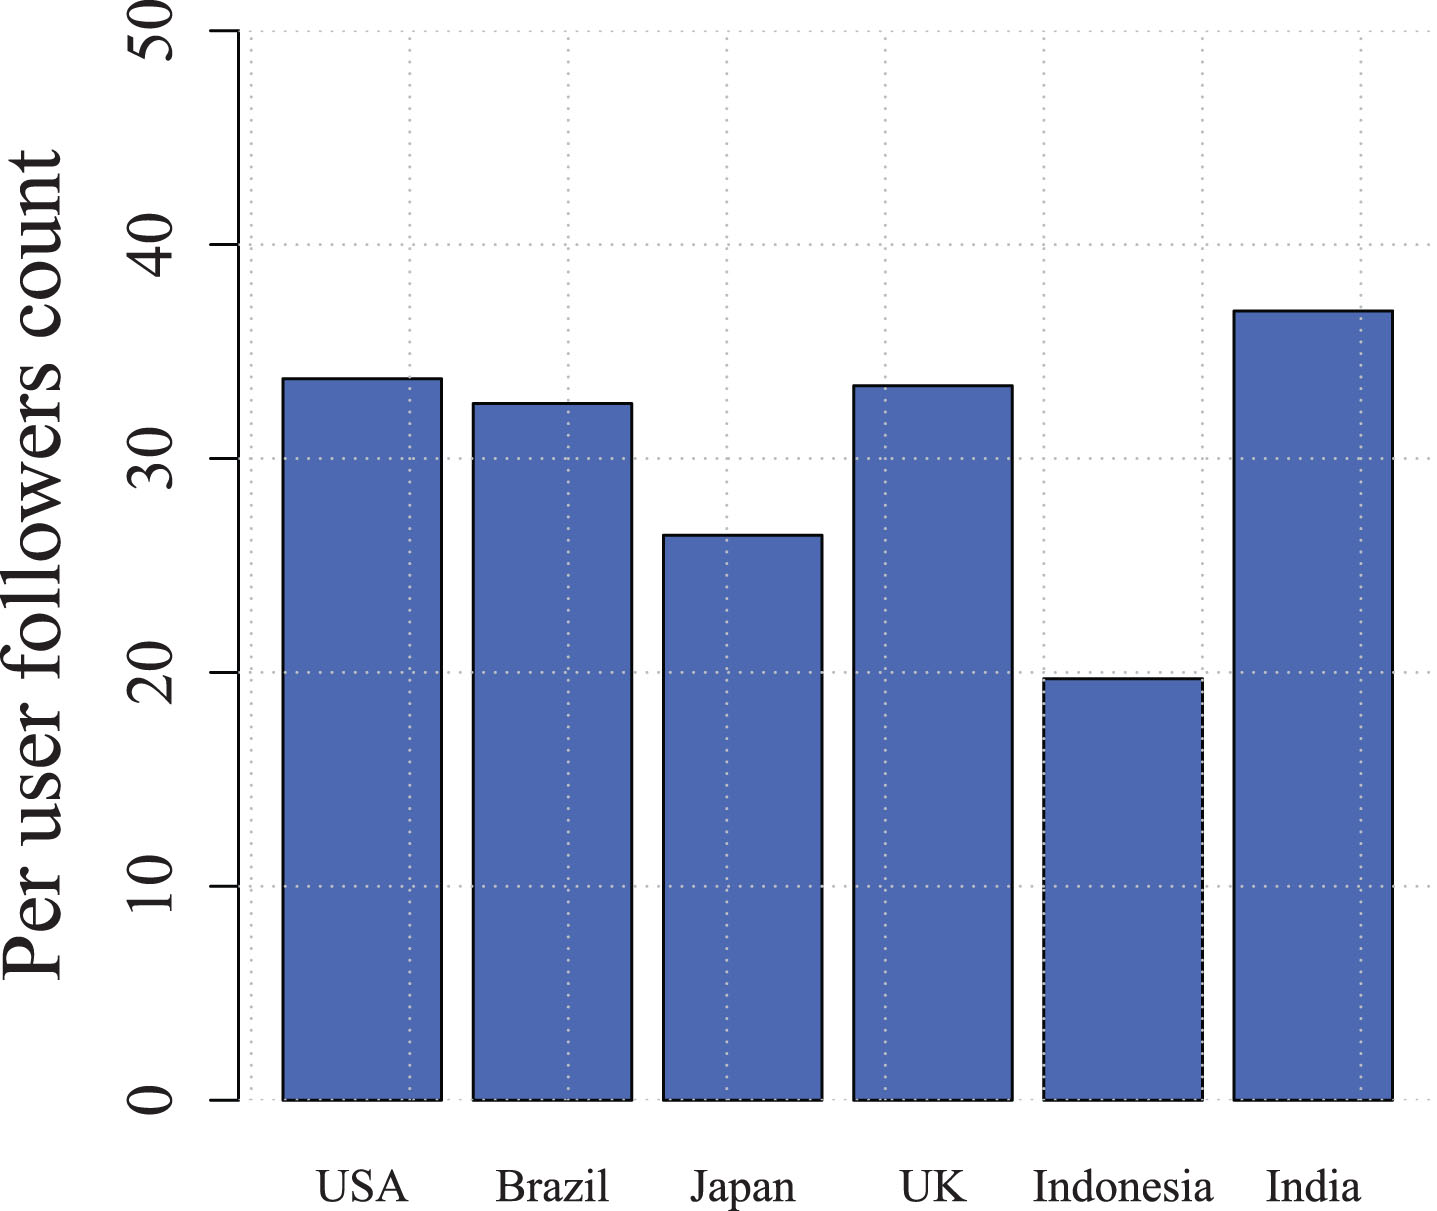
This section demonstrates the effect of socialbots features on intrusion by grouping the infiltration results based on socialbots countries, although there is no regional splitting of networks in Twitter. In the experiment, country assignment to a socialbot means that his/her location, time-zone, and other features were adjusted as per the attributes of the people of the assigned country. The average number of followers grabbed by the socialbots of each country is shown in figure 8. It can be inferred from the figure that socialbots infiltration is related to their regional association as socialbots associated to India were the most infiltrative by luring the highest number of users, whereas Indonesia associated socialbots were least.
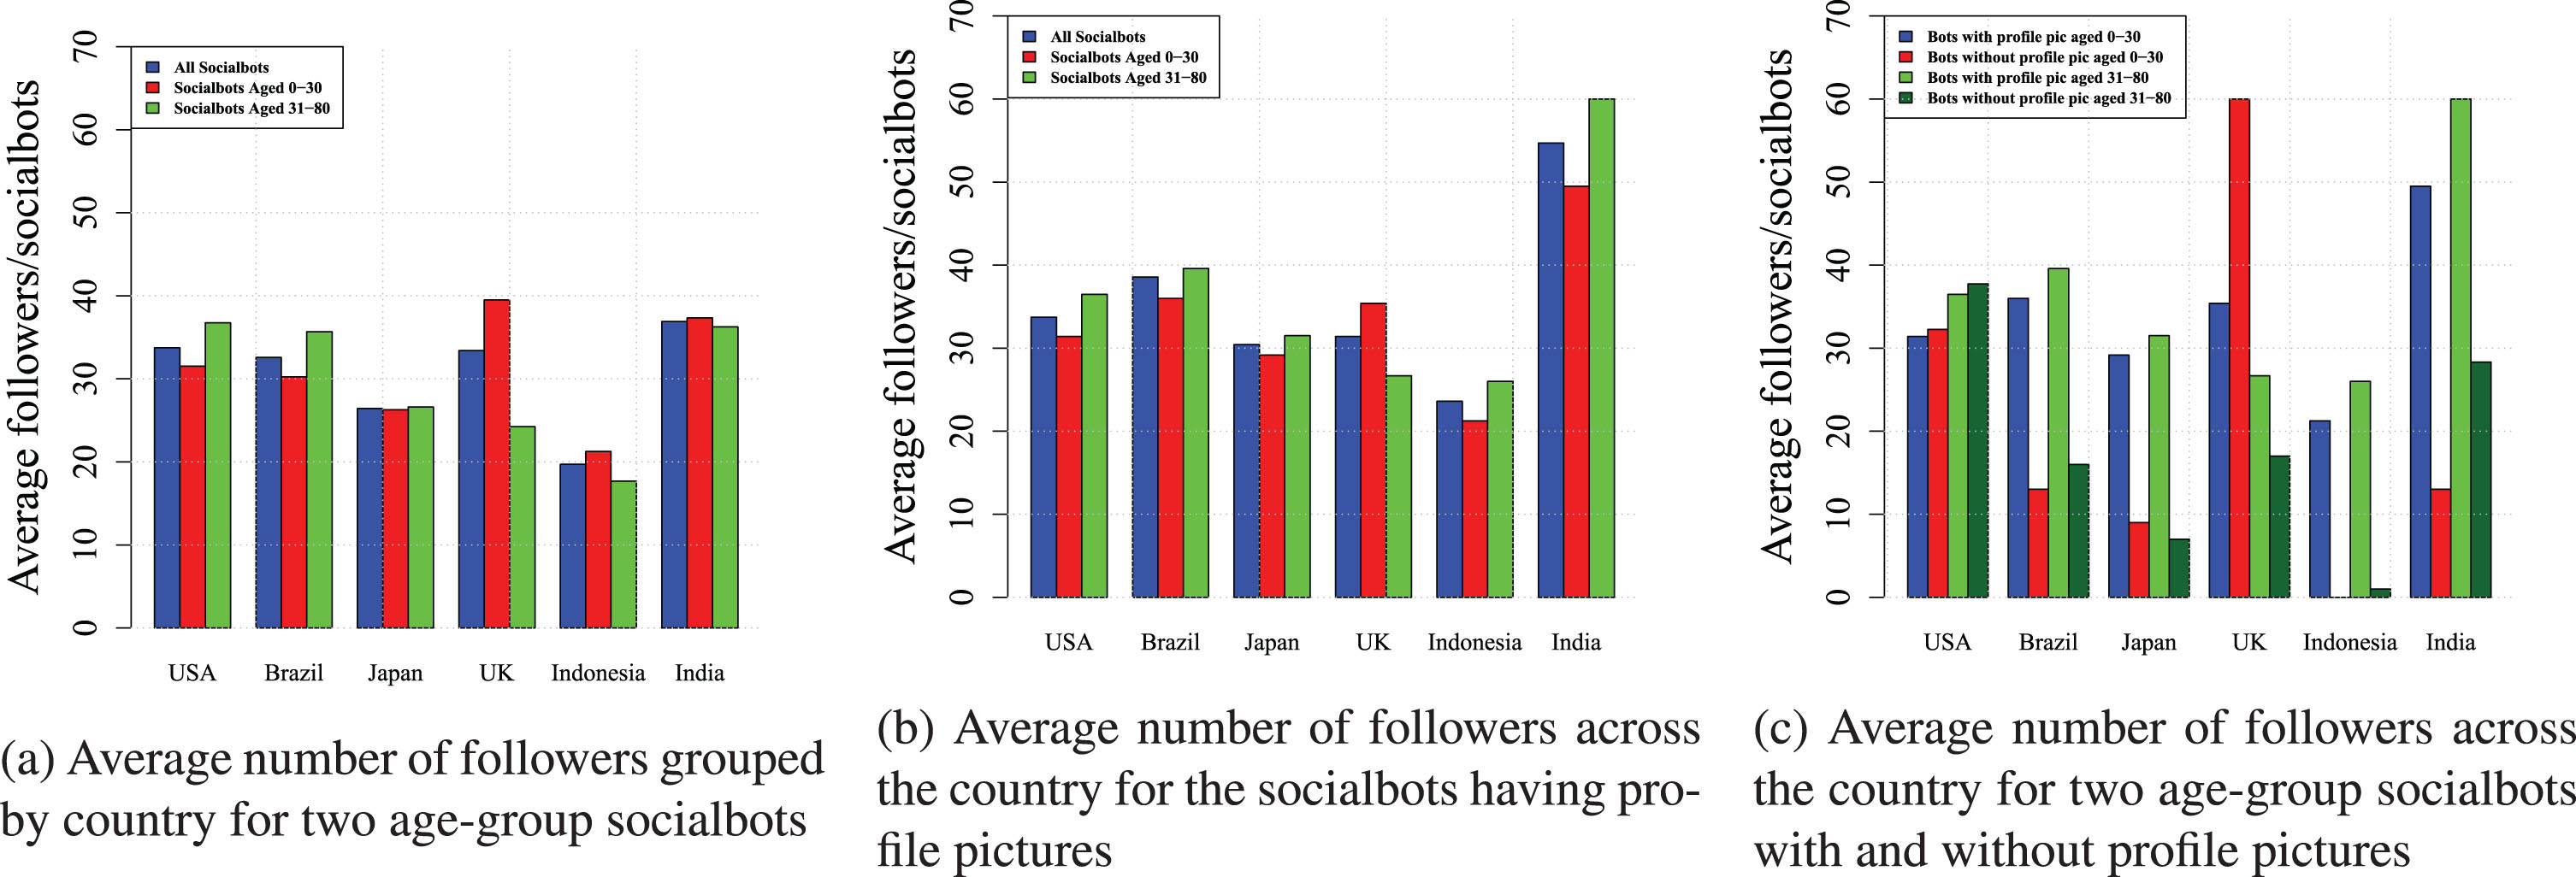
In this analysis, all the results are grouped based on the country of socialbots, and it is found that socialbots with profile pictures were more successful in grabbing followers with an average of 34 users in contrast to socialbots without profile picture grabbing on average only 25 followers. We divided the socialbots into two age-groups –(i) younger than 30 years, and (ii) older than 30 years, to compare the infiltration performance of socialbots of each country on the basis of age in terms of the average number of grabbed followers. In this case, socialbots are divided into two age-groups because for three age-groups, as done in Section 4.1, some groups were without socialbots or with very few socialbots. Figure 9(a) shows that there is no significant difference between the two groups in terms of the number of grabbed followers, except the UK, where younger socialbots were more successful. To observe the exact impact of age on infiltration, an analysis is performed with only those profiles that have a profile picture, and the underlying results are shown using figure 9(b). Among the six countries, the UK is the only country where older socialbots have lower average followers count than the average follower count for all socialbots, as shown in figure 9(c). Based on the analysis, it is inferred that Twitter users are influenced by the age of users while following, and older peoples are considered more reliable.
Country-wise socialbots’ average followers.
Average number of infiltrated followers grouped by age and country of the socialbots.
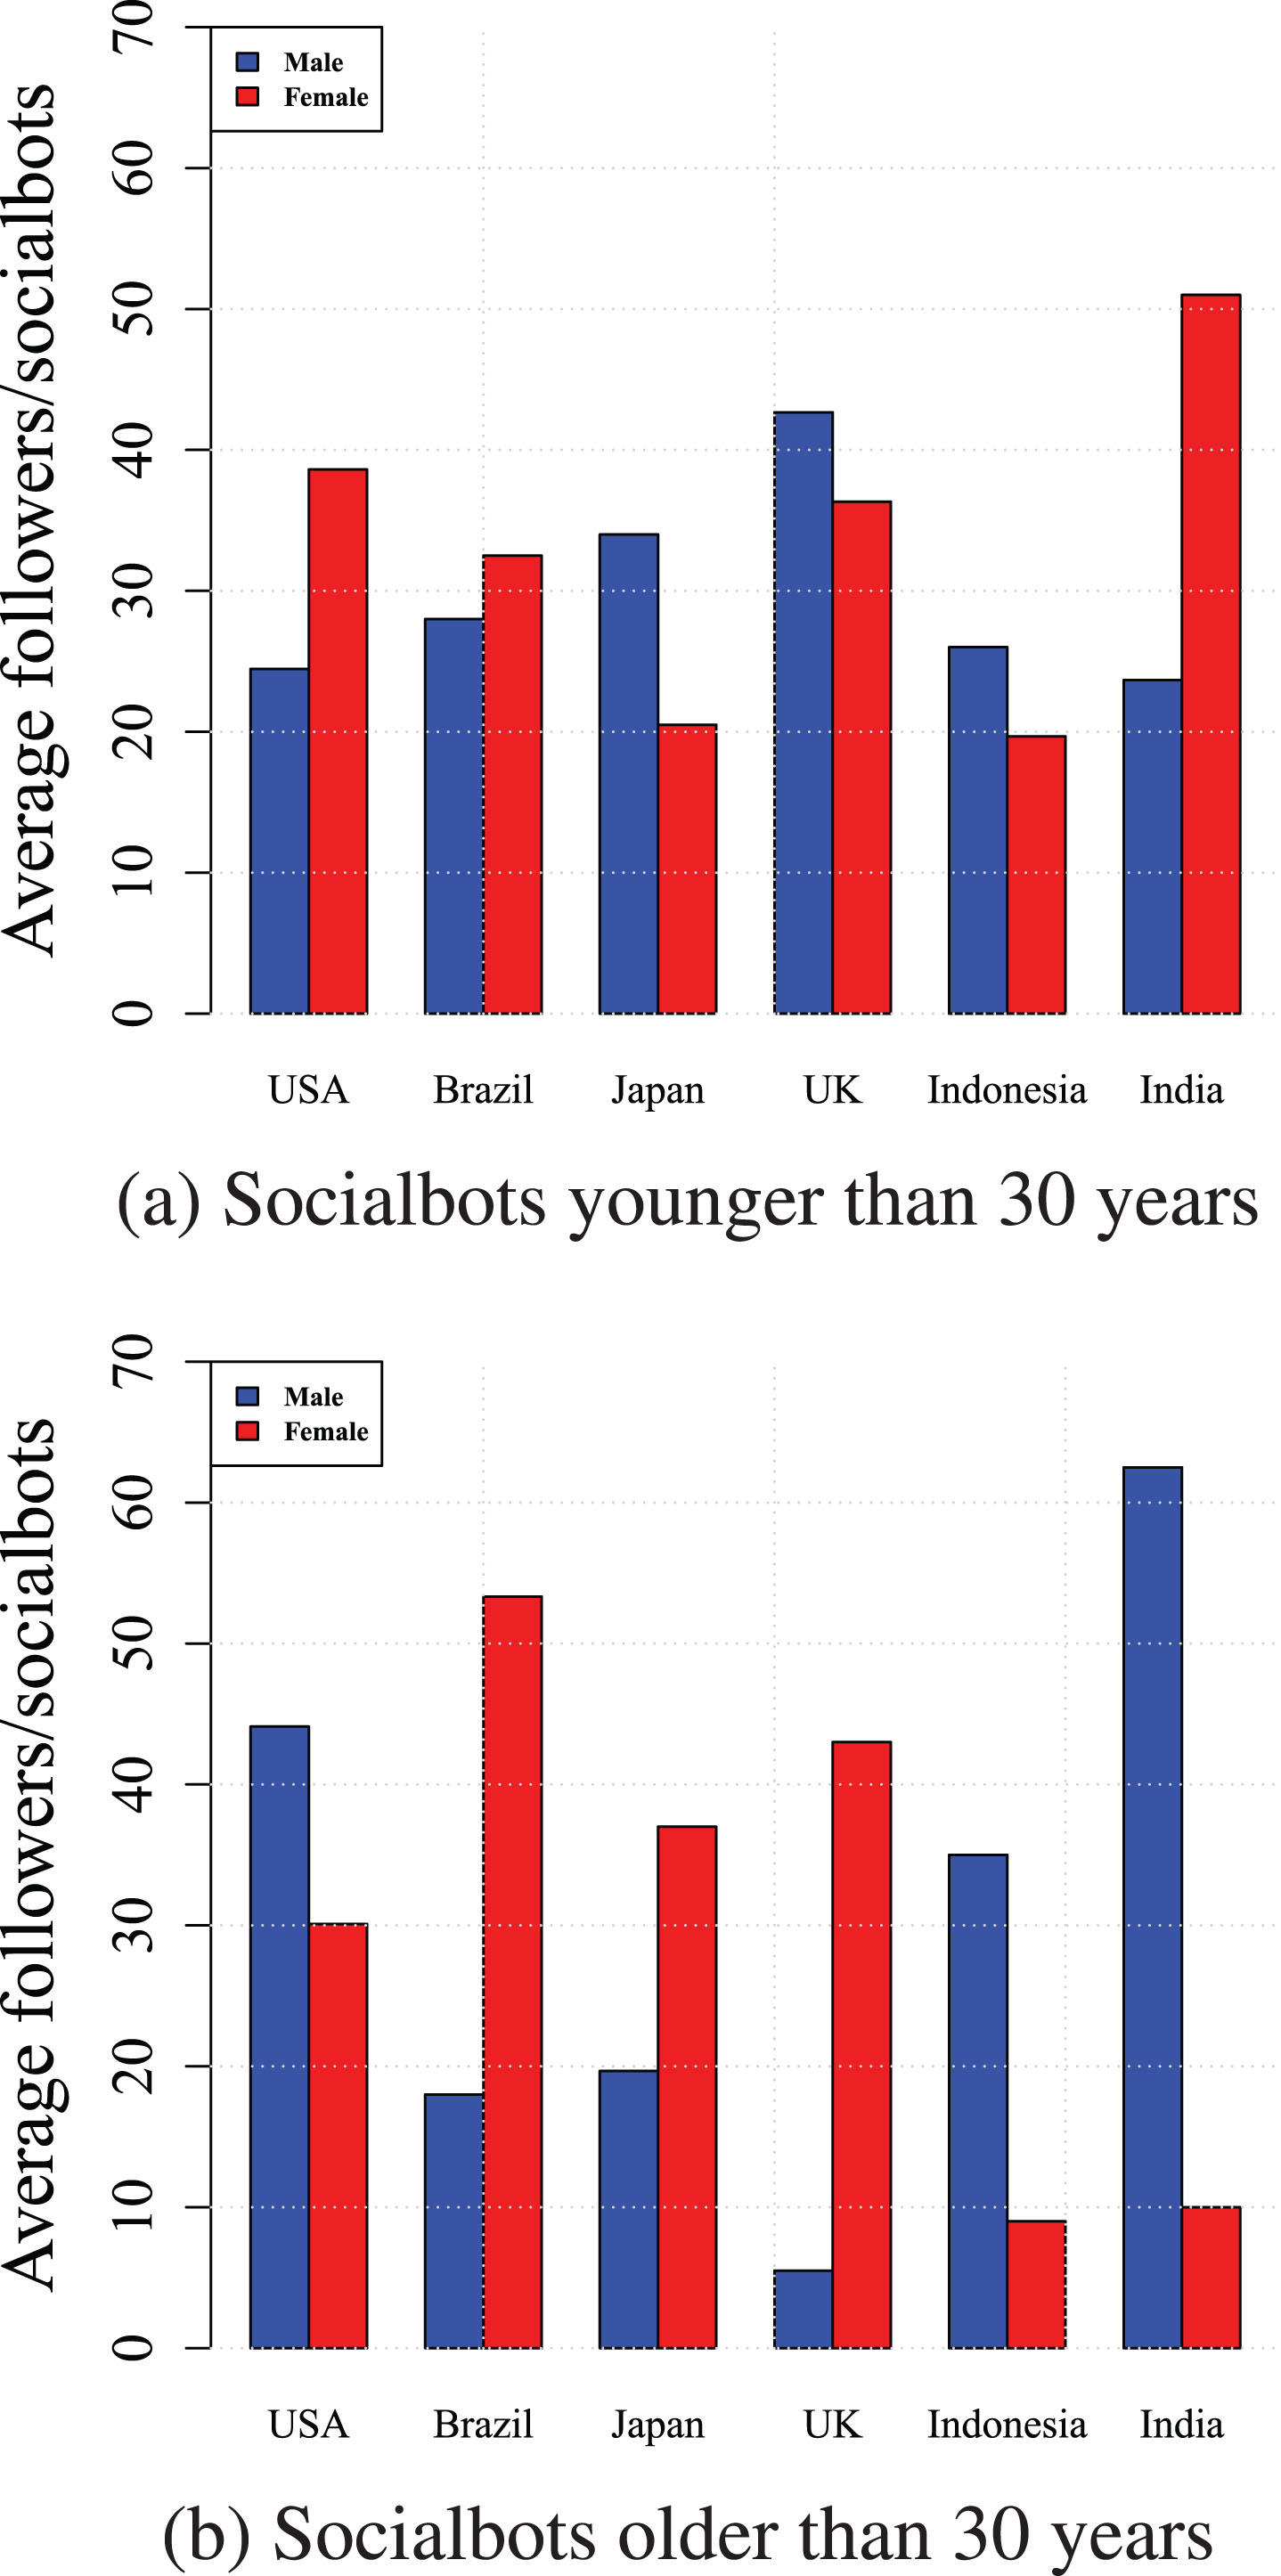
Further, we analyzed the impact of socialbots’ gender on trapping the users and group the results based on their countries. In the analysis, only those socialbots that have profile pictures have been considered. It can be inferred from Figure 10 that younger female and older socialbots from India and USA grabbed a large number of followers, whereas male socialbots from Japan showed good infiltration. Figure 11 portrays the average number of followers mislead by the socialbots of two genders grouped by their associated country and shows that female socialbots from UK and Brazil are much dominating to their male counterpart. Critical analysis reveals the fact that few female profiles from these two countries were exposing and persuading, consequently grabbed a large number of followers. On the other hand, female socialbots from Indonesia have not used profile pictures except for one and therefore failed to grab the users attention. It can be inferred that the gender effect is conditional and depends on the geographical attachment of the profile and does not have a significant impact until uses exposing profile picture. We can infer other interesting observations by analyzing the figure 10.
Average number of followers gained by the socialbots for two age-groups (grouped on the basis of gender and country).
Average number of followers for the two gender groups of socialbots across the country.
Proposed approach for identification of coordinated campaigns
Following a detailed discussion of statistical analysis in previous sections, this section presents a multi-attributed graph-based approach for modeling and identifying trapped users’ clusters, representing behavioral patterns among them. A detailed description of the proposed approach is presented in the following sub-sections.
Multi-attributed graph construction
This section presents the theoretical background of the social graph and its construction. In the line, first, Twitter users are modeled as a multi-attributed graph, a type of graph in which vertices and edges are represented using multi-dimensional vectors. Mathematically, it is defined as , where V is the set of vertices, E is set of edges between vertices, Fv is a vertex-label function that maps each vertex v ∈ V into an n-dimensional vector, like , whereas is an edge-label function that represents the relationship between every pair of vertices of GM using a m-dimensional vector, like . In the proposed approach, every vertex of the constructed graph GM represents a user which is labeled by a numeric node vector F of 6 features. The six features, namely, Twitter age, timezone, follower rate, followee rate, follower/followee ratio, and tweet rate have been designed to track synchronization among the users’ behavior and activities. Among the features, Twitter age of a user represents the number of days elapsed since the user has joined the network. It is important because user accounts related to a campaign will be created nearly the same point in time before starting a spam or smear campaign. Timezone is another important feature because users associated with a campaign will belong to the same region as they will be created by a single master. Other features are also important because they monitor synchronization among the users based on the average number of activities per day. Hereafter, a similarity metric is proposed to find the relationship strength between every pair of users vi, vj ∈ V of the graph using their feature vectors. The similarity between two users is the average of similarities between corresponding feature values of the two users as represented in equation 3, where Iij (f) is an indicator variable representing the presence of attribute values for users. It is zero i.e. Iij (f) =0, if fth feature’s value for either of the two users is missing that is either Fi (f) or Fj (f) is zero or null; otherwise it is one, indicating that similarity for the given feature has been calculated. The similarity Sij between users vi and vj for a feature F (f) is calculated on the basis of its data type that is briefly described in the following paragraphs.
In case, F (f) values are of nominal data type, Sij between two users is calculated as given in equation 1, where ⊙ represents Exclusive NOR logical operation; which gives a value of 1 when both the input values are equal, otherwise 0.
In case, F (f) values are of the real type, similarity Sij between the two users is calculated using Euclidean distance between them as given in equation 1, where denominator represents Euclidean distance between Fi (f) and Fj (f).
Coordinated campaign identification
Malicious users and bots generally operate in groups in a coordinated manner operated and controlled by a master. These users operate in a coordinated manner towards their master’s goals. An artificial and malicious campaign run by a group of coordinated users is called “coordinated campaign”. This section presents the identification of coordinated campaigns from the multi-attributed graph GM. Based on the similarity metric defined in equation 3, multi-attributed graph GM is converted into a similarity graph GS. Thereafter, a similarity matrix MS is constructed from GS and Markov clustering, a fast and scalable unsupervised clustering technique, is applied on it to identify the group of similar or coordinated users [43]. In clustering, each of the identified clusters represents the set of coordinated users. Markov clustering is an iterative algorithm that groups nodes of a graph in a way that maximizes the number of edges within clusters. In Markov clustering, two operations –expansion and inflation are performed; wherein expansion allows flow of weights in different parts of the graph and inflation controls the strengthening and weakening of existing connections. It can be applied on both weighted and unweighted graphs.
Experimental setup and results
This section presents experimental details about the proposed approach for identifying coordinated campaigns. A detailed description of the dataset and experimental results are presented in the following sub-sections.
Dataset
The proposed approach for identifying coordinated campaigns is evaluated on the dataset extracted from the socialbots injection experiment, discussed earlier in Section 3. In the experiment, a total number of 2907 users were trapped, out of which 671 users were either suspended or protected or do not have followers/followees and other related information. As a result, we do not have any information related to these users. The final dataset of trapped users has the profile and other information of 2236 users. We also crawled a maximum number of 5000 tweets and their related metadata information from the timeline of each of these 2236 users. All the non-English tweets were filtered during the pre-processing step. In the remaining paper, all the experiments have been performed on this final dataset.
Experimental results
Following the dataset curation process of 2236 users, a similarity graph is constructed as defined in Section 1ForIdentificationOfCoordinatedTrappedUsers. Furthermore, we applied Markov clustering on the similarity graph to group users who exhibit similar characteristics. Markov clustering converts similarity matrix MS into a transition matrix M, also called Markov matrix, where every element represents transition probability between the corresponding pair of users. In the Markov clustering, expansion and inflation operations are performed iteratively in a interleaved manner until |Mt - Mt-1| ≤ ε, where Mt and Mt-1 are the Markov matrix at tth and (t-1) th iterations respectively. We have chosen ε=0.0001 at different value of inflation parameter r. The number of clusters at different value of r is given in Table 2, where each identified cluster represents a coordinated campaign. In the table, we report only those clusters that have more than 10 users because clusters smaller than 10 do not seem relevant for a campaign. It can be observed from the table that as we increase the value of r, the number of clusters increases, as expected. One important observation is that as the number of clusters increases, some clusters fade away like cluster having user 5 as the attractor, whereas some cluster emerges like clusters with users 1158 and 2023 as attractors. However, increasing the value of r beyond 5 converges most of the clusters as it can be observed from the last few rows of Table 2. It can be observed from 8th, 9th, and 10th rows of the table that most of the clusters have converged except few, which are still expanding or shrinking and which are clusters with a large number of users. Based on empirical analysis, we have chosen clusters identified at r=8 as the final list of clusters. Among the 12 identified clusters of size greater than 10 at r=8, 3 are significantly large, representing approximately 88% of the users. In the remaining part of this paper, all the analyses are performed on these 3 large clusters, namely, C3, C5, and C10 as given in Table 3. Further, we performed content and structural analysis of the users of these three clusters to observe their spamming and malicious nature.
This section presents the evaluation of identified campaigns in the form of clusters using different evaluation measures. A detailed description of the evaluation measures and corresponding results is presented in the following sub-sections.
Evaluation parameters
This sub-section presents different evaluation measures to evaluate the efficacy of the proposed approach towards coordinated campaign detection. The identified campaigns (clusters) have been evaluated using four evaluation parameters –the number of suspended users in each campaign, timezone, URL ratio, and use of malicious keywords. A detailed description of the evaluation parameters is presented in the following paragraphs.
Suspended users:
One of the important characteristics of a fabricated campaign is that it will be run by a group of OSN profiles (users) controlled by single master [29]. Accordingly, in the case of a fabricated campaign, a group of users will be suspended rather than individual, reflecting the coordination and ill-intention of the profiles. In the analysis, we have chosen suspended users as those who are either suspended or not found on the platform, representing that users have deleted the accounts. Therefore, we verified the users of identified clusters to find the ratio of active and suspended users. To this end, we called Twitter API to verify the current status of users.
Timezone:
Another important characteristic of the users of coordinated campaigns is that they generally belong to the same timezone because the master user creates multiple sybil profiles from the same location. We have chosen timezone rather than location because, during the profile creation process on Twitter, users are prompted to adjust their location. As a result, sybil creator can change it to a different location for a different user or can skip it. However, even if the creator assigns different locations to the different profiles, they generally chose the different cities of his/her own country having the same timezone. Additionally, users hardly adjust timezone available in account setting, which is by default adjusted by Twitter, therefore giving the same timezone to all the profiles created from the same location/country. We have not chosen the location of the tweets due to the fact that the majority of the tweets do not have a location because users generally have their global positioning system turned off. Therefore, we have analyzed the timezone of users to observe their suspicious and coordinated behavior.
Keywords distribution:
The type of words used in users posts also reflects their intention and nature. It is another very important indicator to track spam campaigns among clustered users. To this end, we have taken a maximum of 200 tweets from every user of each cluster. Hereafter, an aggregated tweet set of each cluster is passed to Natural Language Understanding (NLU)
8
for keywords extraction. NLU is a natural language processing service by IBM to perform sentiment analysis, entity extraction, topic extraction, and so on, on a given text corpus. In the process, we extracted 100 keywords from the tweets corpus of the users of each cluster.
URL ratio:
In the existing literature, another important characteristic for observing spamming behavior in users content is the analysis of URL ratio in content [38, 44]. In the case of Twitter, normal users generally use URL to share the article, news, and other third-party documents. In general conversation and thought expression, normal users generally do not use URLs, whereas spammers and malicious users are dedicated to the promotion, advertisement, and fabricated propaganda, therefore they keep on using URLs of the specified brand, product, or service in their tweets/posts. To track this kind of behavior, we analyze the URLs use in tweets of clustered users by using the URL ratio for every user of the cluster. Thereafter, we find the average of the URL ratio of every user of each cluster, representing the URL ratio of the cluster.
Evaluation results
To observe the spamming nature of the users of each of the three identified campaigns C3, C5, and C10, we performed the experimental analysis of their behavior in terms of evaluation metrics defined in the previous section. In the line, a detailed description of evaluation results in terms of various evaluation metrics is presented in the following sub-sections.
Cluster Analysis:
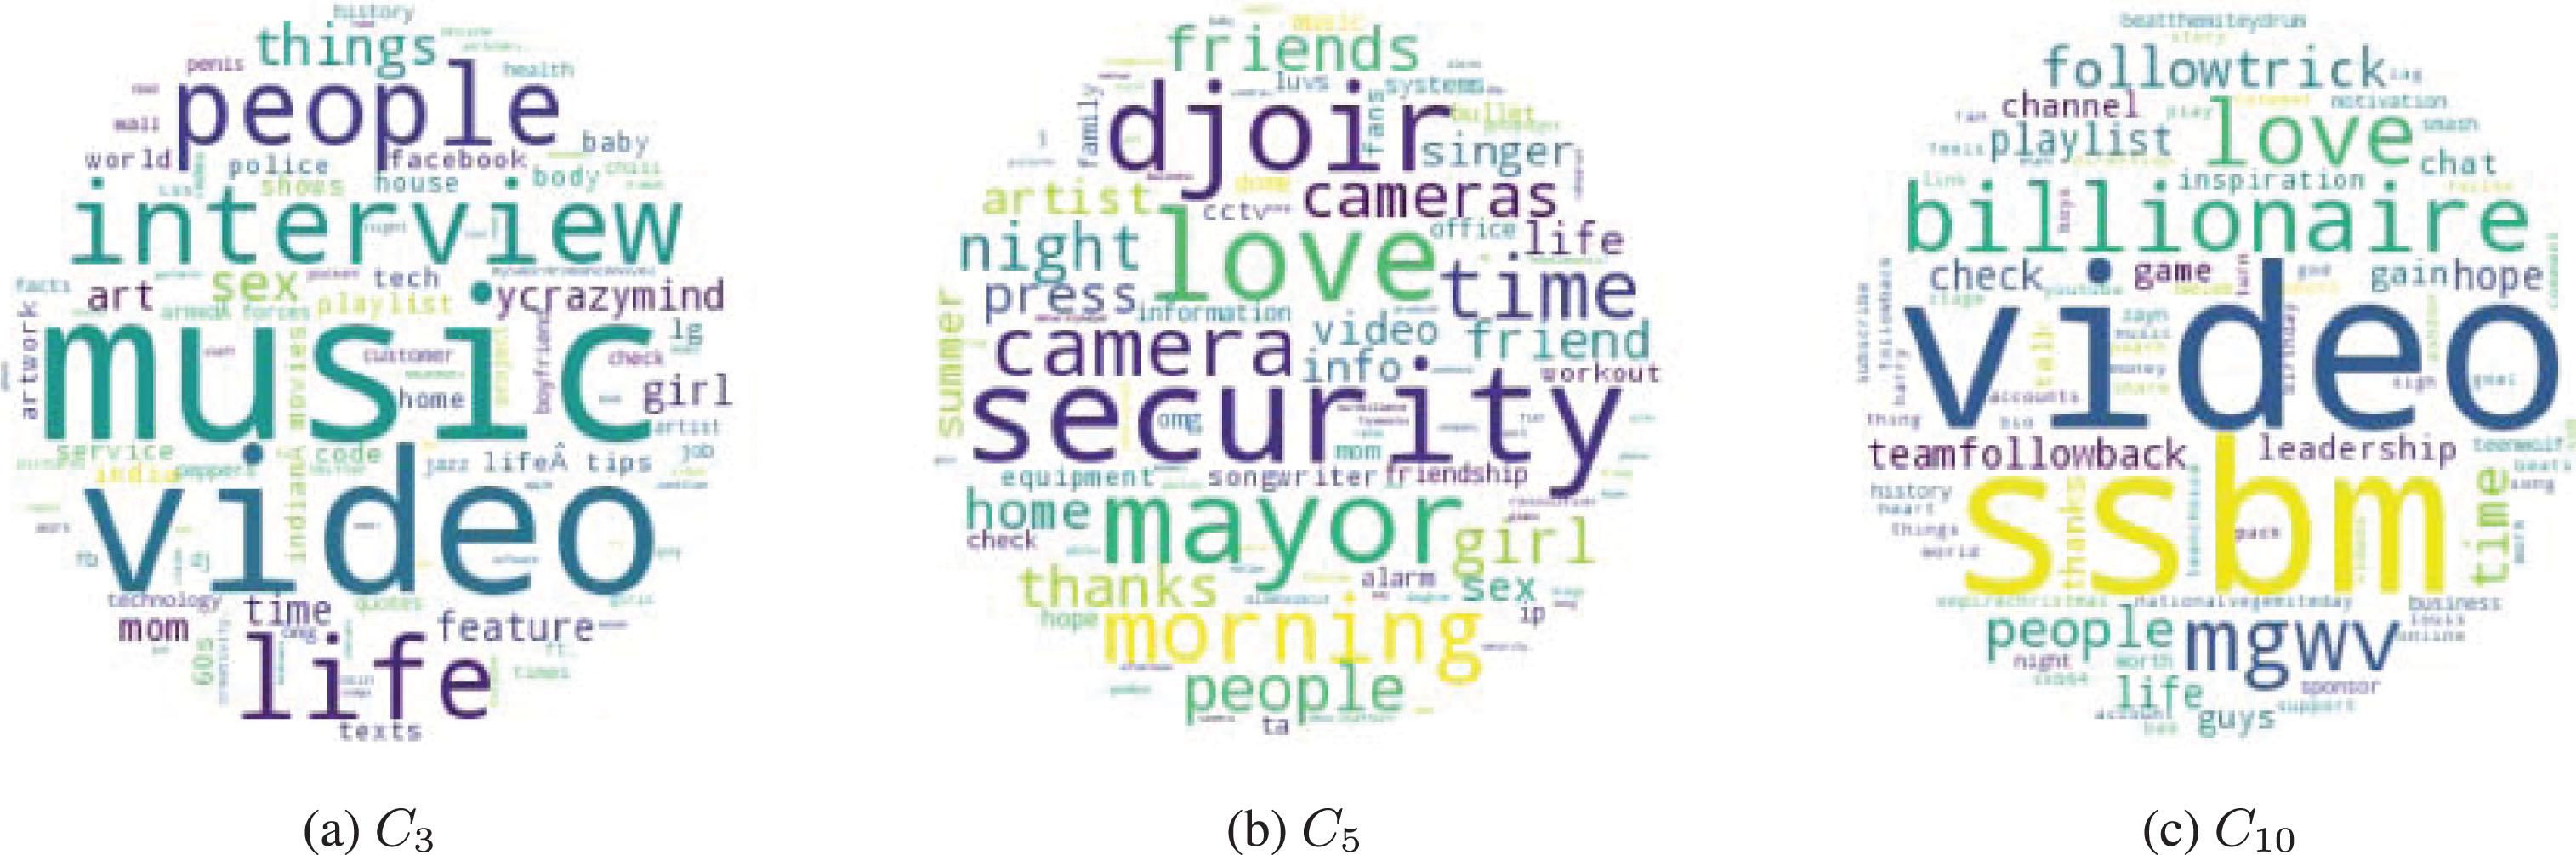
This section presents the evaluation results of the proposed approach in terms of evaluation metrics defined in Section 6.3. In the line, we present evaluation results for each of the three clusters C3, C5, and C10 to observe their spamming nature at group-level granularity. We have performed the evaluation of only active users rather than suspended users due to the fact they are already suspended by the Twitter due to some sort of suspicious behavior. Therefore, we assume that suspended users are already malicious, and their further analysis is of no use. To this end, first, we analyzed the coordinated campaign among the alive users of cluster C3. In the verification process using Twitter, we found that 170 out of 672 users have been suspended or not found on the platform, which is approximately 25% of the cluster’s users, as shown in the third row of Table 3. Timezone analysis shows very scattered distribution among 502 active users who belong to 72 different timezones. However, Pacific Time (US & Canada), London, and Central Time (US & Canada) are the most dominating timezones with 75, 30, and 23 users, respectively. During timezone and age analysis, we do not find any kind of coordination or synchronization among these accounts. Further, we extracted the top 100 representative keywords from the tweets of these users that are shown in figure 12(a), where keywords size is proportional to its relevance score, representing its relevance in the corpus. It can be observed from this figure that the two most important keywords are music and video, which are generally used to promote newly released music and songs. On the analysis of tweets, we found that users were talking and recommending songs and videos of singers, representing their personal views. Similarly, significant numbers of tweets were personal thoughts, views, and updates of daily activities. It is reflected and further verified while we performed URL ratio and spam word ratio analysis on the tweets corpus. On analysis, URL ratio and spam word ratio are found to be 0.50 and 0.012, respectively, which are moderately lower and can be said to fall under the benign category.
Users statistics among trapped users
Cluster
Cluster Size
Attractor
#Suspended Users
#Active Users
Suspended Users (%)
C1
13
771
4
9
0.3076923077
C2
12
1285
8
4
0.6666666666
C3
672
1158
170
502
0.2529761905
C4
62
661
9
53
0.1451612903
C5
253
1730
118
135
0.4664031621
C6
78
2023
30
48
0.3846153846
C7
12
1249
4
8
0.3333333333
C8
24
1951
2
22
0.0833333333
C9
12
1141
2
10
0.1666666667
C10
752
1475
153
599
0.2034574468
C11
15
980
2
13
0.1333333333
C12
11
2092
1
10
0.0909090909
Keywords-cloud corresponding to keywords extracted from the users’ tweets of three clusters.
Further, we performed coordinated campaign analysis among the users of the C5 cluster. To this end, first, we identified the suspended users and found that 118 out of 235 users have been suspended. On analysis, we found that all the suspended users belong to the same timezone and created nearly the same time. Also, their tweets writing style and bio-description were nearly similar. We also analyzed active users of the cluster by crawling their timezone information from Twitter and found that 95 out of 135 belong to same timezone Pacific Time (US & Canada) as that of suspended users, raising the doubt that they are controlled by the same master, whereas 34 users have not exposed their timezone. Further, we analyzed the aggregate thematic structure of the users using a maximum of 200 tweets from the tweets set of each user. Figure 12(b) represents the keywords-cloud of 100 keywords, where size is proportional to their relevance in the corpus. As shown in the figure, security, mayor, camera are the most discussed keyword among the users, representing the security concerns expressed by the people of a city. Further, we analyzed URL usage behavior in the users’ tweets, which has been exploited in various existing spammer detection techniques. On analysis, URL ratio is found to be at 0.42, which is not high and can be said to be acceptable.
Finally, we performed coordinated campaign analysis among the users of C10 cluster. In this cluster, 153 out of 752 users have been suspended, approximately 20% of the total users, as shown in the 10th row of Table 3. On analysis, we do not find any pattern among the suspended users. Timezone analysis shows moderately scattered distribution among 36 different timezones, but it was either not available or not revealed by 369 users. Among the timezones, Eastern Time (US & Canada), Pacific Time (US & Canada), and Tokyo are the most dominating ones having 61, 43, and 25 users respectively. In timezone analysis, we do not find any coordination or synchronization among the accounts. Further, we performed the content analysis of the users’ tweets and extracted the top 100 keywords, as shown in figure 12(c). It can be observed from this figure that most of keywords, such as followtrick, mgwv, teamfollowback, love are spammy, where mgwv is a spam hashtag used by spammers to promote the sale and purchase of followers. On analysis, most of the spammers were related to the black market of followers selling and purchase, assuring the network users with an increased reputation. To further observe the spamming nature of these users, we analyzed URL ratio and spam word ratio among their tweets. On analysis, URL ratio is found to be at 0.75, which is high and puts the users of this cluster in the suspicious category.
Discussion
OSNs are the fascinating platforms for criminals, spammers, and fraudsters since their inception. Due to various inherent vulnerabilities, these platforms are misused by malicious users for different illicit purposes, either by creating a large number of fake profiles or bots [14]. Twitter network is no exception from this hazard, and it has approximately 23 million fake profiles
9
. We have verified the trapped followers using different interaction tactics, such as sending direct messages, sometimes asking for information, and sometimes infuriating them to reply with abusive language to verify them as a human being. In this process, nobody responded, except two followers who only liked the message. We also followed many trapped followers using a new account and found that only three followers followed back; subsequently, we sent direct messages to these three followers, but none of them responded. However, a significant result regarding individual followers is that 671 out of 2907 unique followers of our socialbots were suspended by Twitter during the socialbots operation process. Among the remaining 2236 trapped users, 588 are either suspended or users have deleted their accounts. Accordingly, a total of 1259 out of 2907 (approximately more than 43%) trapped users do not exist which is a significant number. In addition, during the spam content analysis based on URL ratio and keywords distribution users in C10 cluster have suspicious behavior. On the contrary, socialbots were able to trap a total number of 5 verified users, one of them having 1.72 million followers, which is a significant number because only 0.000001% of Twitter users have more than million followers
10
.
We have also presented a group-level granular analysis approach as discussed in section 1ForIdentificationOfCoordinatedTrappedUsers. During the cluster analysis, we found a suspicious spam campaign represented by cluster C5, which was eventually suspended by the Twitter. Apart from this, we did not find any other coordinated campaign, though several users were associated with the same time-zone.
Therefore, based on the above discussions, it can be concluded that socialbots were not only successful in infiltrating influential and benign users; rather, they also attracted a significant number of spammers and bots. In addition, the trace of a coordinated campaign was also found.
Conclusion and future work
In this paper, we have presented a statistical analysis describing the impact of socialbots’ profile features on their infiltration performance using a dataset collected through the injection of 98 socialbots in Twitter. We have presented a thorough analysis of the infiltration efficacy of the socialbots at different levels of granularity, and some key findings can be listed as follows –(i) socialbots can easily infiltrate Twitter users, (ii) infiltration performance of socialbots is related to their regional association, (iii) most significantly, even verified users are at the risk of being trapped by socialbots as 5 verified users started following the socialbots. Among them, 3 are the prominent actors and songwriters –Tay Zonday, Dylan Gardner, and Scott Maslen having 581K, 39.3K, and 237K followers, respectively. In addition, one verified user has approximately 1.72 million followers, which is a very significant number in Twitter. (iv) Gender of a socialbot does not play any significant role, except on certain geographies and having young and exposing profile picture, (v) among the mislead followers, footprints of fake and malicious profiles such as spammers, bots, and content polluters were observed. We have also presented a multi-attributed graph-based approach for the identification of coordinated campaigns among the Twitter users. The proposed approach has been experimentally evaluated on the Twitter dataset of socialbots’ trapped users. In the evaluation, we identified three groups of users, one of them having a coordinated social botnet, which was later suspended by the Twitter. Presently, we are developing an integrated tweet analysis system for profiling mislead users and analyzing their topical evolution. Studying the multifaceted emotional aspects of socialbots such as emotional behavior analysis, emotion-based socialbots detection, and emotion-based analysis of socialbots’ followers, seems one interesting future direction of research.
Footnotes
References
1.
KwakH., LeeC., ParkH. and MoonS., What is Twitter, a social network or a news media? In Proceedings of the ACM 19th International Conference on World Wide Web, Raleigh, NC, USA (2010), 561–600.
2.
QiuL., LinH., RamsayJ. and YangF., You are what you tweet: Personality expression and perception on Twitter, Journal of Research in Personality42(9) (2012), 710–718.
3.
ZhouaY., ZhangB., SunX., ZhengaQ. and LiuT., Analyzing and modeling dynamics of information diffusion in microblogging social network, Journal of Research in Personality86(2) (2017), 92–102.
4.
BlancoT., MarcoA. and CasasR., Online social networks as a tool to support people with special needs, Computer Communications73(2) (2016), 315–331.
5.
BoshmafY., MuslukhovI., BeznosovK. and RipeanuM., Key Challenges in Defending Against Malicious Socialbots, In Proceedings of the 5th USENIX Workshop on Large-Scale Exploits and Emergent Threats, San Jones, USA, (2012), 1–4.
6.
KrasnovaH., GuntherO., SpiekermannS. and KorolevaK., Privacy concerns and identity in online social networks, Identity in the Information Society2(1) (2009), 39–63.
7.
KayesI. and IamnitchiA., Privacy and security in online social networks: A survey, Online Social Networks and Media3 (2017), 1–21.
8.
DavisC.A., VarolO., FerraraE., FlamminiA. and MenczerF., BotOrNot: A system to evaluate social bots. In Proceedings of the ACM 25th International Conference on World Wide Web, Montreal, Canada (2016), 273–274.
9.
AhmedF. and AbulaishM., A Generic statistical approach for spam detection in online social networks, Computer Communications36(10) (2013), 1120–1129.
10.
ThomasK., McCoyD., GrierC., KolczA. and PaxsonV., Trafficking fraudulent accounts: The role of the underground market in Twitter spam and abuse. In Proceedings of the 22nd USENIX Security Symposium, Washington, DC, USA (2013), 95–110.
11.
ViswanathB., PostA., GummadiK.P. and MisloveA., An analysis of social network-based sybil defenses. In Proceedings of the ACM SIGCOMM Conference, New Delhi, India (2010), 363–374.
12.
LiuD., WuQ., HanW. and ZhouB., Sockpuppet gang detection on social media sites, Frontiers of Computer Science10(1) (2016), 124–135.
13.
ChuZ., GianvecchioS., WangH. and JajodiaS., Detecting automation of Twitter accounts: Are you a human, bot, or cyborg?, IEEE Transactions on Dependable and Secure Computing9(6) (2012), 811–824.
14.
BoshmafY., MuslukhovI., BeznosovK. and RipeanuM., Design and analysis of social botnet, Computer Networks57(2) (2013), 556–578.
15.
AbokhodairN., YooD. and McDonaldD.W., Dissecting a social botnet: Growth, content and influence in Twitter. In Proceedings of the 18th ACM Conference on Computer Supported Cooperative Work and Social Computing, Vancouver, BC, Canada (2015), 839–851.
16.
BessiA. and FerraraE., Social bots distort the U.S. presidential election online discussion, First Monday21(11) (2016), 1–14.
17.
ShaoC., CiampagliaG.L., VarolO., YangK.C., FlamminiA. and MenczerF., The spread of low-credibility content by social bots, Nature Communications9(11) (2018), 1–9.
18.
ShafahiM., KempersL. and AfsarmaneshH., Phishing through social bots on Twitter. In Proceedings of the 4th IEEE International Conference on Big Data, Washington DC, USA (2016), 3703–3712.
19.
FreitasC.D., BenevenutoF., GhoshS. and VelosoA., Reverse engineering socialbot infiltration strategies in Twitter. In Proceedings of the International Conference on Advances in Social Networks Analysis and Mining, Paris, France (2015), 25–32.
20.
ElyasharA., FireM., KaganD. and EloviciY., Homing socialbots:Intrusion on a specific organization’s employee using socialbots. In Proceedings of the International Conference on Advances in Social Networks Analysis and Mining, Niagara Falls, Canada (2013), 1358–1365.
21.
FazilM. and AbulaishM., Why a socialbot is effective in Twitter? A statistical insight. In Proceedings of the 9th International Conference on Communication Systems and Networks (COMSNETS), Social Networking Workshop, Bengaluru, India (2017), 562–567.
22.
MenendezA.R., SauraJ.R. and AlonsoC.A., Understanding #WorldEnvironmentDay user opinions in Twitter: A topic-based sentiment analysis approach, International Journal of Environmental Research and Public Health9(11) (2018), 1–18.
23.
AsgharM.Z., KundiF.M., AhmadS., KhanA. and KhanF., T-SAF: Twitter sentiment analysis framework using a hybrid classification scheme, Expert Systems34(4) (2017), 1–19.
24.
FerraraE., VarolO., DavisC., MenczerF. and FlamminiA., The Rise of Socialbots, Communications of the ACM59(7) (2016), 96–104.
25.
BilgeL.P., StrufeT., BalzarottiD., KirdaE., All Your Contacts Are Belong to Us: Automated Identity Theft Attacks on Social Networks. In Proceedings of the 18th International Conference on World Wide Web, Madrid, Spain, (2009), 551–560.
26.
VosoughiS., RoyD. and AralS., The spread of true and false news online, Science359(6380) (2018), 1146–1151.
27.
BoshmafY., MuslukhovI., BeznosovK., RipeanuM., The socialbot network: When bots socialize for fame and money. In Proceedings of the 27th ACM Annual Computer Security Applications Conference, Orlando, FL, USA, (2011), 93–102.
28.
AielloL.M., DeplanoM., SchifanellaR., RuffoG., People are strange when you’re a stranger: Impact and influence of bots on social networks. In Proceedings of the 6th International Conference onWeblogs and Social Media, Dublin, Ireland, (2012), 10–17.
29.
ZhangJ., ZhangR., ZhangY. and YanG., On the Impact of social botnets for spam distribution and digital influence manipulation. In Proceedings of the 6th IEEE International Conference on Communications and Network Security, National Harbor, MD, USA (2013), 46–54.
30.
MessiasJ., SchmidtR., OliveiraA.R. and BenevenutoF., You followed my bot! Transforming robots into influential users in Twitter, First Monday18(7) (2013), 1–13.
31.
CresciS., PietroR.D., PetrocchiM., SpognardiA. and TesconiM., The paradigm-shift of social spambots: Evidence, theories, and tools for the arms race. In Proceedings of the 26th ACM International Conference onWorldWideWeb, Perth, Australia (2017), 963–972.
32.
WaldR., KhoshgoftaarT.M., NapolitanoA. and SumnerC., Which users reply to and interact with Twitter social bots? In Proceedings of the 25th IEEE International Conference on Tools with Artificial Intelligence, Herndon, VA, USA (2013), 135–144.
33.
FazilM. and AbulaishM., Identifying Active, Reactive, and Inactive Targets of Socialbots in Twitter. In Proceedings of the 16th ACM International Conference on Web Intelligence, Leipzig, Germany (2017), 573–580.
34.
ChavoshiN., HamooniH. and MueenA., DeBot: Twitter bot detection via warped correlation. In Proceedings of the 16th IEEE International Conference on Data Mining, Barcelona, Spain (2016), 817–822.
35.
RangelF. and RossoP., Overview of the 7th author profiling task at PAN 2019: Bots and gender profiling in Twitter. In Proceedings of the CEUR Workshop, Lugano, Switzerland (2019), 1–36.
36.
PizarroJ., Using n-grams to detect bots on Twitter. In Proceedings of the Proceedings of the Notebook for PAN at CLEF 2019, Lugano, Switzerland (2019), 1–10.
37.
JohanssonF., Supervised classification of Twitter accounts based on textual content of tweet. In Proceedings of the Proceedings of the Notebook for PAN at CLEF 2019, Lugano, Switzerland (2019), 1–8.
38.
GaoH., HuJ., WilsonC., LiZ., ChenY. and ZhaoB.Y., Detecting and characterizing social spam campaigns. In Proceedings of the 10th ACM International Conference on Internet Measurement, Melbourne, Australia (2010), 35–47.
39.
EloviciY., FireM., HerzbergA. and ShulmanH., Ethical considerations when employing fake identities in online social networks for research, Science and Engineering Ethics20(4) (2014), 1027–1043.
40.
FangQ., SangJ., XuC. and HossainM.S., Relational user attribute inference in social media, IEEE Transactions on Multimedia17(7) (2015), 1031–1044.
41.
RaoD., YarowskyD., ShreevatsA. and GuptaM., Classifying latent user attributes in Twitter. In Proceedings of the 2nd ACM International Workshop on Search and Mining User-Generated Contents, Toronto, Canada (2010), 37–44.
42.
YangC., HarkreaderR. and GuG., Empirical evaluation and new design for fighting evolving Twitter spammers, IEEE Transactions on Information Forensics and Security8(8) (2013), 1280–1293.
43.
DongenS.V., Graph clustering via a discrete uncoupling process, Journal on Matrix Analysis and Applications30(1) (2008), 121–141.
44.
FazilM. and AbulaishM., A hybrid approach for detecting automated spammers in Twitter, IEEE Transactions on Information Forensics and Security13(11) (2018), 2707–2719.