
Abstract
Education is a collective intelligence system where a group of persons ranging from students to management thinks and work together to achieve institutions’ goals. The primary goal of every institution is to accomplish excellent end-semester examination results. A good result is achieved through proper training given by the educators and in response to the performance of students in the examination. Training is cost accounting, whereas students’ performance is unpredictable. Outlier analysis in the education system has been stipulated in recent decades to predict the students’ uncertain behavior in learning activities which are utilized to alert the education systems. Fuzzy Logic System can handle such uncertainties in learning activities. The major issues that affect the accuracy of fuzzy based outlier detection methods are fixing appropriate membership function and validating the fuzzy rules before extracting outliers. To remedy these issues the proposed Fuzzy Temporal Outlier Detection (FTOD) method detects outliers from mid-semester examination results using fuzzy logic based associative classifier with optimal membership functions. The resultant outliers distinguish the slow learners from spurious-slow learners with high accuracy than the existing FARIM and modified-FARIM algorithms. Thus, educators can provide cost-effective training to enrich the slow learners’ cognition to score high in end-semester examinations.
Keywords
Introduction
Collective Intelligence (CI) is a shared or group intelligence that emerges by coordinating and collaborating the efforts and competition among many individuals. CI can be used to solve many societal problems ranging from conventional domains like Medicine and Education to the latest business fields like Facebook and Trading. The CI in the education system, which is achieved through the collective efforts of various stakeholders like students, educators and management, is used to obtain the institutional goals and to compete with other institutions.
The fundamental goal of an education system is to achieve excellent examination results economically. The most important learning objects of the education system like training and assessments will help the educators to understand how the learning behavior of the students affects the end-semester examination results [1, 2]. Few of the existing systems study the students’ performance in the end-semester examinations [1, 4] is helpful to take a remedial measure. But “Prevention is better than cure”. Hence, the proposed method Fuzzy Temporal Outlier Detection (FTOD) considers the students’ behavior and performance in mid-semester examinations rather than end-semester examinations.
Weak students always fail in most of the courses and have to work hard to pass. But, slow learners are the students who fail/pass in few courses of all the mid-semester examinations in the border level and can be motivated to pass through proper training. The spurious-slow learners are the students who fail intentionally in a few courses of one or two mid-semester examinations because of their lethargic activities. In the current trend, the attitude of the students during the mid-semester examinations is not as serious as their focus on end-semester examinations. Hence, there occurs a group of spurious-slow learners in the performance of mid-semester examinations, which will mislead the education system in achieving its goal. Anyhow, the educators have to provide ample training for the slow learners and the weak students to achieve good results. Training for them is a must. But, the spurious-slow learners usually do not support such kind of training due to their attitude. Hence, to provide the training cost-effectively, the educators have to segregate the actual slow learners from spurious-slow learners.
Outliers are the small group of observations (e.g., slow learners) which deviate from the major group of normal observations (e.g., average learners) in a data set and seem to belong to a different mechanism [5, 6]. The outliers are low frequent patterns and maybe Noise (e.g., spurious-slow learners) or Anomaly (e.g., actual slow learners) which will be classified as weak and strong outliers respectively based on the deviation (outlier score) from the normal observations. “Usually, Noise possesses less outlier score than Anomaly [7]”.
In the current decade, there is an escalating demand among the researchers in performing outlier analysis on temporal data like educational data to study the unexpected behavior of the students in various learning activities. Education data are temporal, quantitative (numeric) and fuzzy in nature and has to be subjected to partition (categorization) before performing the mining process [8]. Such partitioning will lead to uncertain values near the boundaries [9]. The uncertainty in the boundary values (e.g., overlapping of slow learners and average learners) while partitioning the numerical or quantitative data will be handled by Fuzzy Logic System (FLS) realistically [10, 11]. Hence, FLS is helpful in segregating or classifying the slow learners from the average learners and spurious-slow learners almost at a clear-cut boundary.
Since FLS adopts “IF-THEN” rules, they become the extension of conventional rule-based systems where the antecedent and the consequent part of the rules constitute a collection of fuzzy logic statements instead of real or categorical values. Association rules are basic and foremost conventional rule-based system used to understand the relationship between the antecedent and the consequent [12]. Making use of Fuzzy Association Rule (FAR) to extract outliers from education data has to consider the issues like Fixing appropriate Membership Function (MF) a priori, to handle the uncertainty in the boundary values while partitioning the numerical data into ranges before the mining process. Arriving required predefined threshold values (varies based on applications and data distribution) for the interesting measures like support and confidence to generate infrequent FARs. Performing validation on enormously generated infrequent FARs before extracting outliers to achieve high classification accuracy. Fixing appropriate outlier measure (varies from application to application) to extract outliers from the infrequent FARs.
The FTOD make use of the following special features to handle the issues listed above. Based on the distribution of the marks scored by the students in each course, the proposed algorithm dynamically generates the optimal MFs, which are unique for each numerical attributes, i.e., for each course. Up to our knowledge, this approach is not suggested by any of the authors. The threshold values for all the measures which are used to extract outliers are dynamically fixed as suggested by the authors [13]. To handle the temporal nature of educational data and to avoid unnecessary generation of invalid outliers (spurious-slow learners) FTOD makes use of Train and Test approach [14]. That is FTOD detects outliers in one snapshot of data (first mid-semester results - training phase) and evaluates these outliers on the other snapshot of data (second and third mid-semesters results - testing phase). To extract the outliers, FTOD makes use of the unexpected/surprising measure – Lift [15, 16].
We have compared the performance of FTOD with that of ‘FARIM’ [1] and our previous work ‘modified-FARIM’ [17] methods. These methods have adopted static and also single/common MF for fuzzification and the measure - ‘Rank’ for extracting the outliers. The experimental results prove that FTOD detects minimal, pre-validated and accurate outliers with higher classification accuracy than the FARIM and modified-FARIM methods.
The rest of the paper is organized in such a way that Section 2 deals with the motivation, survey and preliminaries for the proposed work. Section 3 discusses in detail the framework and algorithm of the proposed work. Section 4 details the experimental results of the proposed work against the existing methods. Finally, in Section 5 the proposed work is concluded with future research direction.
Motivation and preliminaries
This section details the motivation of the proposed method, the literature survey done, the problem formulation and the preliminaries required to implement the proposed method - FTOD.
Motivation
In the majority of autonomous institutions, students’ curriculum performance is evaluated based on the mid-semester examinations mark (25% to 50%) internally and end-semester examination mark (50% to 75%) externally. Among the three (or four) mid-semester examinations conducted, the institution will consider the best two (or three) for the internal mark evaluation. Hence, the students are having the attitude of attending only two (among three) or three (among four) mid-semester examinations with full effort and simply attend the other (perhaps for the sake of attendance) without proper preparations. This can be understood from Fig. 1 which is arrived from the performance of a batch of students in a semester.
The students’ lethargic attitude makes them fail intentionally or score low marks in at least one or two mid-semester examinations (notice the third mid-semester results in Fig. 1). Thus, the failures list of mid-semester examinations will also include average and fast learners (spurious-slow learners) beyond the actual slow learners, which will lead to misinterpretation of the slow learner’s list. This is true from Fig. 1 that, few of the spurious-slow learners have moved to the Average or Fast Learners group in the end-semester examination results. Also, the slow learner’s count has been reduced.
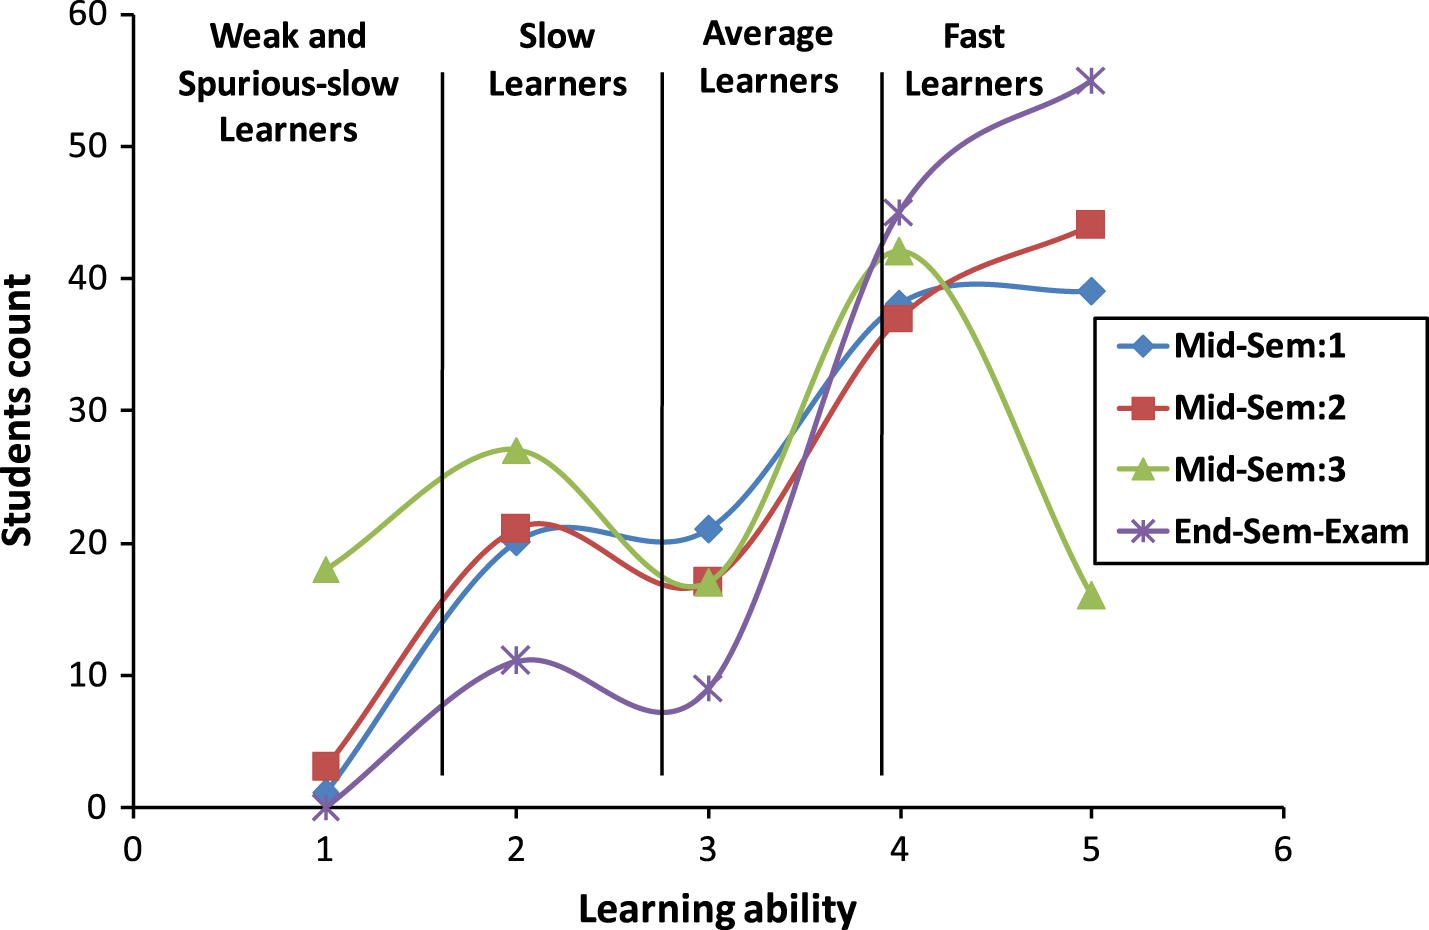
Mid-semester vs. end-semester performance.
The educator will be arranging extra training for all the slow learners (inclusive of the spurious-slow learners) to improve the results of the end-semester examinations. This will lead to unnecessary resource consumption which is cost accounting. Hence, differentiating the slow learners from spurious-slow learners is essential for educators to provide cost-effective training.
The education data is subjected to data mining techniques such as classification, clustering, association rule mining, sequential mining, etc., to extract knowledge for various stakeholders [18] and has been extended to handle the learning management system by making use of the moodle data as case study [19, 20]. The authors identified the relationship between the failed courses of the students using the association rules [19] generated by the Apriori algorithm, a frequent pattern-based approach. Also, an evolutionary algorithm based association rules were extracted to identify the relationship between the training offered in the classrooms for the students and the corresponding assessments [20]. The physical manipulative environment [21] when used by the students during their learning activities resulted in a better outcome than the virtual environment. It has been verified that the dynamical aspects which affect the behavior, cognition, and correctness of the school students (who appears for the board examinations) are directly associated with the learning outcomes, ie., the end-of-year examinations [22]. The effectiveness of the collective intelligence has been proved by adding collaborative learning features to the existing individual learning models among the students [23]. Cheng et al. [24] modified the existing MFH-SPAM, a sequential pattern mining algorithm to characterize the learning behavior of the students. By doing so, they found that the proposed method was able to identify the important patterns based on behavior, which was missed by the traditional method. The method followed by the authors helped them in characterizing the students based on the learning behavior. Another set of authors developed a Discrimination Aware Classifier model [25] using association rules and decision tree separately. Both of the classifiers used by the authors were able to classify the educational data and produced a small set of rules for classification with a better understanding and improved accuracy.
Outlier detection using association rules
Association rule mining (Apriori algorithm) is the first and foremost frequent pattern based mining technique [12, 26]. Even though this method is introduced to study the correlation among the frequently occurring items together, soon after its application moves towards the study of correlation among the infrequently occurring items [2]. To prune the patterns from the frequent/infrequent patterns based on the user interest, the method requires a set of measures called ‘interesting measures’ [15]. The unexpected temporal association rules are generated by the frequent pattern-based approach to alert the systems in the stock market [27]. In this work, the normal behavior of the objects in the stock market database is discovered using Temporal Association Rule (TAR). Then the relationship among the features of the TARs over time is identified using quasi-functional dependency, and finally, a predefined outlier pruning measure called ‘dependency degree’ [27] is used to extract the outliers. Also, the stock splits that occur during a particular period which alerts the stakeholders for their investment are identified using TARs with ‘residual leverage’ as the outlier pruning measure [28]. Unexpected episodes to detect the adverse drug reaction in the medical domain are identified using TARs [29–31]. Preetha et al. proposed a non-parametric FP-Growth algorithm to detect outliers [32]. All the works mentioned above make use of association rules along with static predefined threshold values for the outlier pruning measures used to detect outliers.
Temporal outlier mining
Educational data is temporal because most of its information is valid for a particular time. Hence, most of the educational data mining processes adopt temporal mining techniques [1, 17]. Temporal mining is the technique which is used to discover knowledge from temporal data and sequence data, where time and order of the event are considered into account respectively [27–31]. A TAR spans across many intervals. Discovering all such rules is irrelevant and time-consuming. To solve this problem, the author adopted a ‘Train and Test approach’ to prune irrelevant rules while predicting heart disease [14].
Outlier detection using FLS on education data
To handle any engineering problem one should require both objective knowledge (mathematical model) and subjective knowledge (eg. linguistic information) which cannot be quantified by traditional mathematics alone. But, these two forms of knowledge can be simultaneously handled by FLS [33]. Educational data have a combination of quantified (numeric) data like marks, placement scores and ranking (ordinal) data like results. Hence, to handle the boundary problem while partitioning the numeric data, the authors have adopted FLS to generate exceptional TARs [1, 17]. A fuzzy-based Apriori algorithm called Fuzzy Apriori Rare Itemset Mining (FARIM) is used to detect fuzzy specific rare item sets from education data to discover the learning problem – the weak student identification [1]. The FARIM algorithm [1] converts the numerical data into a set of five fuzzy linguistic terms before performing the mining process. ‘Rank’ is proposed as the outlier pruning measure in FARIM for pruning the specific rare cases from the rare item sets. This measure is calculated for all possible linguistic terms generated during the early stage of the algorithm itself, ie., during the infrequent set generation and stored along with its corresponding itemset. This consumes a lot of memory space. But in the modified-FARIM algorithm [17] the same outlier pruning measure – ‘Rank’ is computed in the later phase of the algorithm, ie., only for the rare item sets that are pruned from the infrequent itemsets. By doing so, the authors have proved that the modified-FARIM consume less memory space. Both the FARIM [1] and modified-FARIM algorithms [17] adopted Apriori-based FLS with static Membership Function (MF) for categorizing the numerical data in the preprocessing step and Rank as the outlier pruning measure.
Existing optimal MFs generation methods
The objective of adopting optimal MF to generate fuzzy rules is to improve accuracy. The optimization of MFs can be achieved by adopting heuristics methods, hybrid methods, fuzzy clustering algorithms, neural networks, genetic algorithms, etc. [34]. Ketata et al. in their work, they have adjusted the initial static MF to arrive optimal MF by merging the fuzzy sets of similar rules [35]. Fuzzy neural network method was adopted by Wu et al. [36] to generate the fuzzy rules automatically. In this method without any predefined static MF, the fuzzy sets were randomly chosen, later the width of the fuzzy sets was adjusted based on the output error of existing MF. But, the method required several predefined parameters. Chen et al. [37] and Liao et al. [38] adopted a variant of fuzzy c-means algorithm to generate automatic MF. Even though the fuzzy c-means algorithm is unsupervised and can control the shape of the fuzzy sets, it is sensitive to noise or outliers. Also, Alcalá-Fdez et al. [39] have arrived at the optimal MF by making use of genetic learning method. Here the author has adjusted the peak value of each fuzzy set to and forth by a lateral displacement of – 0.5 to +0.5 to achieve optimal fuzzy sets. All the above-discussed methods require initial fuzzy sets or few predefined parameters to generate or adjust the final optimal MFs.
Problem formulation
To classify the slow learners from spurious-slow learners and average learners, the proposed method - FTOD adopts a FLS along with the associative classification method (a variant of association rule mining) with train and test approach. Also, FTOD makes use of the optimal MFs for categorizing the numerical data. FTOD aims at detecting the outliers by FLS based Apriori algorithm, using Lift as the outlier pruning measure. The features of FTOD and its advantages are The minimum user-defined threshold value for the interesting measures. Minimize user interaction. Arriving dynamically computed threshold values for the interesting measures used to detect outliers. No need for domain expert’s guidance. The FLS adopts dynamically generated unique optimal MFs for categorizing each numerical attribute. No need to fix initial static MF. No need to have single MF for all the numerical attributes. Based on the distribution of data the lower and upper boundary values of each MF will vary. Able to classify the slow learners from average learners more accurately. Outlier detection using train and test approach. Reduce the irrelevant infrequent patterns. Help in locating slow learners from spurious-slow learners.
Among these features, the 3rd (a unique feature of the proposed method - FTOD) and 4th features helped us in improving the classification accuracy of FTOD by eliminating the identification of spurious-slow learners and average learners as slow learners.
Preliminaries
This section describes the basic requirements like the dataset considered, the proposed MFs for the FLS and the interesting measures used to detect the outliers using FTOD method.
Dataset used
To evaluate the proposed approach, the education data from Thiagarajar College of Engineering’s web portal – TCENet [40] an automating academic processes management system is considered. The dataset used is the score details of third-year undergraduate students of Computer Science and Engineering Department. It gives the score details of 120 students in 6 theory courses (Statistics and Graph Theory - SG, Databases Principles and Design - DB, Multi-core Architecture - MA, Computer Networks Principles - CN, Web Programming - WP, Software Design - SD) of three mid-semester examinations conducted in the various period of a semester. To pass in a mid-semester exam, the students should score 50% and above in all the courses. All the three mid-semester examinations results are considered as separate snapshots. The outliers detected from one snapshot of data is verified and validated with the outliers detected from other snapshots of data using the train and test approach method. The proposed algorithm has been tested in three different batches of students. Sample dataset is given in Table 1. The ‘RESULT’ field is considered as the target attribute.
Sample education data set
Sample education data set
Subjective measures like support and confidence [15] are used to evolve more interesting rules at the earlier stage of the data mining process [12, 41]. The threshold value for the ‘maximum Support’ which is used to prune the infrequent patterns at each level is computed based on the Dynamic Minimum Support (DMS) and Collective Minimum Support (CMS) [13]. Let the antecedent and consequent part of the rules be A and B respectively and ‘D’ be the given set of transactions. Since, FTOD makes use of associative classification technique, the consequent part ‘B’ of the rule is restricted to the target attribute. Then, as per the definition given in [12, 42], the fuzzy support and fuzzy confidence for the Fuzzy Class Association Rule (FCAR) A⟶B is calculated as in Equations (1 and 2) respectively.
where μ A (x t ) represents the individual matching degree of the antecedent part of the rule among the transaction x t and μ AB (x t ) is the combined matching degree of the antecedent and consequent of the rule among the transaction x t .
Few of the objective measures are of unexpected in nature and are also actionable in certain cases [41]. Among the various objective measures, FTOD is in need of the Surprising or Unexpected measures [15, 41]. The most relevant and important objective measure that is used to prune the rare or unexpected or deviated rules from the infrequent FCARs is ‘Lift’. “Lift measures how many times more often the patterns occur together than expected if they were statistically independent. Also, lift is susceptible to noise in small databases. Rare patterns with low counts (low support) which perchance occur a few times (or only once) together can produce enormous lift values” [43]. This nature – ‘the enormous value’ for the low support and rare, occurring patterns motivated us to make use of the ‘Lift’ as the outlier pruning measure. This is because the outliers are infrequent (low support) and rare observations with more deviation (high outlier score) in characteristics. The Lift value for the fuzzy rule A → B is given as in Equation (3).
Since the outliers generated are in the form of FCARs, the two measures ‘Rule Coverage’ and ‘Rule Accuracy’ is used to assess the quality of the fuzzy rules [44]. Let Ncovers be the number of transactions covered by the FCARs, Ncorrect be the number of transactions correctly classified by the FACRs and |D| be the total number of transactions in the database. Then the coverage and accuracy of the FCARs are defined as in the Equations (4 and 5) respectively.
The slow learners have to be correctly distinguished from the spurious-slow and average learners. For the correct classification of these categories, the boundary value plays a major role. This is achieved by choosing an appropriate MF for categorizing (fuzzification) the marks of each course.
The Education Database is subjected to fuzzification using triangular MF with five linguistic terms {very low (VL), low (L), medium (M), high (H) and very high (VH)}. FTOD does not use a fixed and single MF for all the courses. Some courses may be quite easier and the students will pass by scoring high marks. The students who have failed in such courses are the slow learners. But some courses will be tuff for most of the students and the failures, in this case, includes the average learners beyond the slow learners. Due to variation in easiness of the courses and the attitude of the students towards the faculty who handles the course, the marks scored by the students will vary. Hence, using a common or a fixed MF for fuzzification is not recommended for correct classification. Hence, FTOD makes use of separate MF for each course. The MF for each course is decided on the fly by scanning the minimum and maximum scores in the corresponding course. By this method, every course will have its own optimal MF for fuzzification. The boundary values generated by the proposed method and the corresponding linguistic terms of each course are listed in Table 2, and a sample MF used by FTOD is given in Fig. 2.
Boundary values for entire courses
Boundary values for entire courses
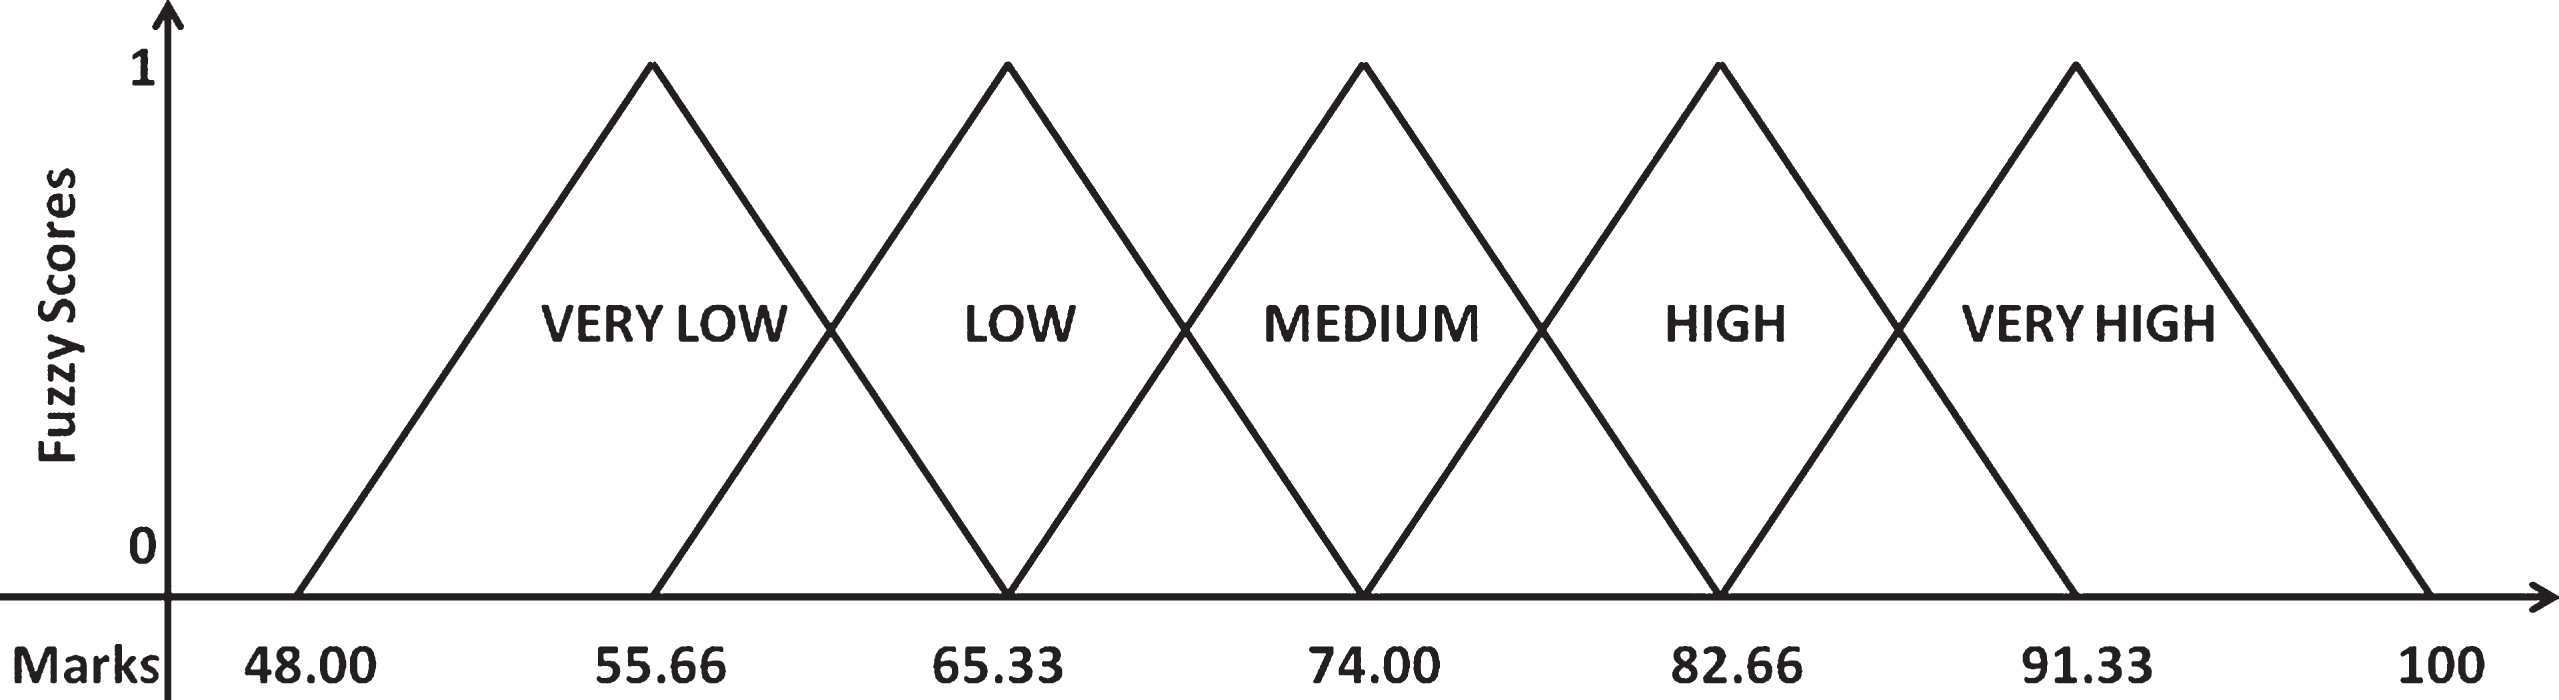
Sample MF generated for SG course.
The target outliers are the slow learners and not the spurious-slow learners. Slow learners are not only those who have failed in more than two courses but also those who have passed with border marks in more than two courses. The border mark scorers have the chance to fail in the end-semester examination. The outliers detected by the FTOD algorithm can figure out such students by following the steps like Pre-processing Optimal MF generation Fuzzification Outlier detection Infrequent pattern generation Infrequent FCARs generation Outlier Pruning Verification & Validation of Outliers Post-pruning Redundant outlier pruning
Framework for mining slow learners
The proposed method FTOD adopts frequent pattern (Apriori algorithm) based associative classification technique to mine FCARs from the mid-semester examination results. These FCARs, in turn, is helpful in spotting the outliers (slow learners). FTOD makes use of dynamically generated unique triangular MFs for fuzzification of each numerical attributes. An initial user-defined value is given as input to generate the threshold value for the subjective measure – ‘Support’ to prune the infrequent pattern in each level of infrequent pattern generation. Then the infrequent FCARs with high confidence (usually 0.9 and above) are generated from these infrequent patterns using the other subjective measure – ‘confidence’ along with the ‘support’ measure. Then the outliers are pruned from the FCARs using the outlier pruning measure – ‘Lift’. The threshold for lift is computed dynamically. Similarly, outliers are pruned for the second mid-semester marks, and the common outliers are validated with the third mid-semester marks by following the train and test approach to detect the exact outliers. The framework used to detect outliers is depicted in Fig. 3.
Algorithm for mining slow learners
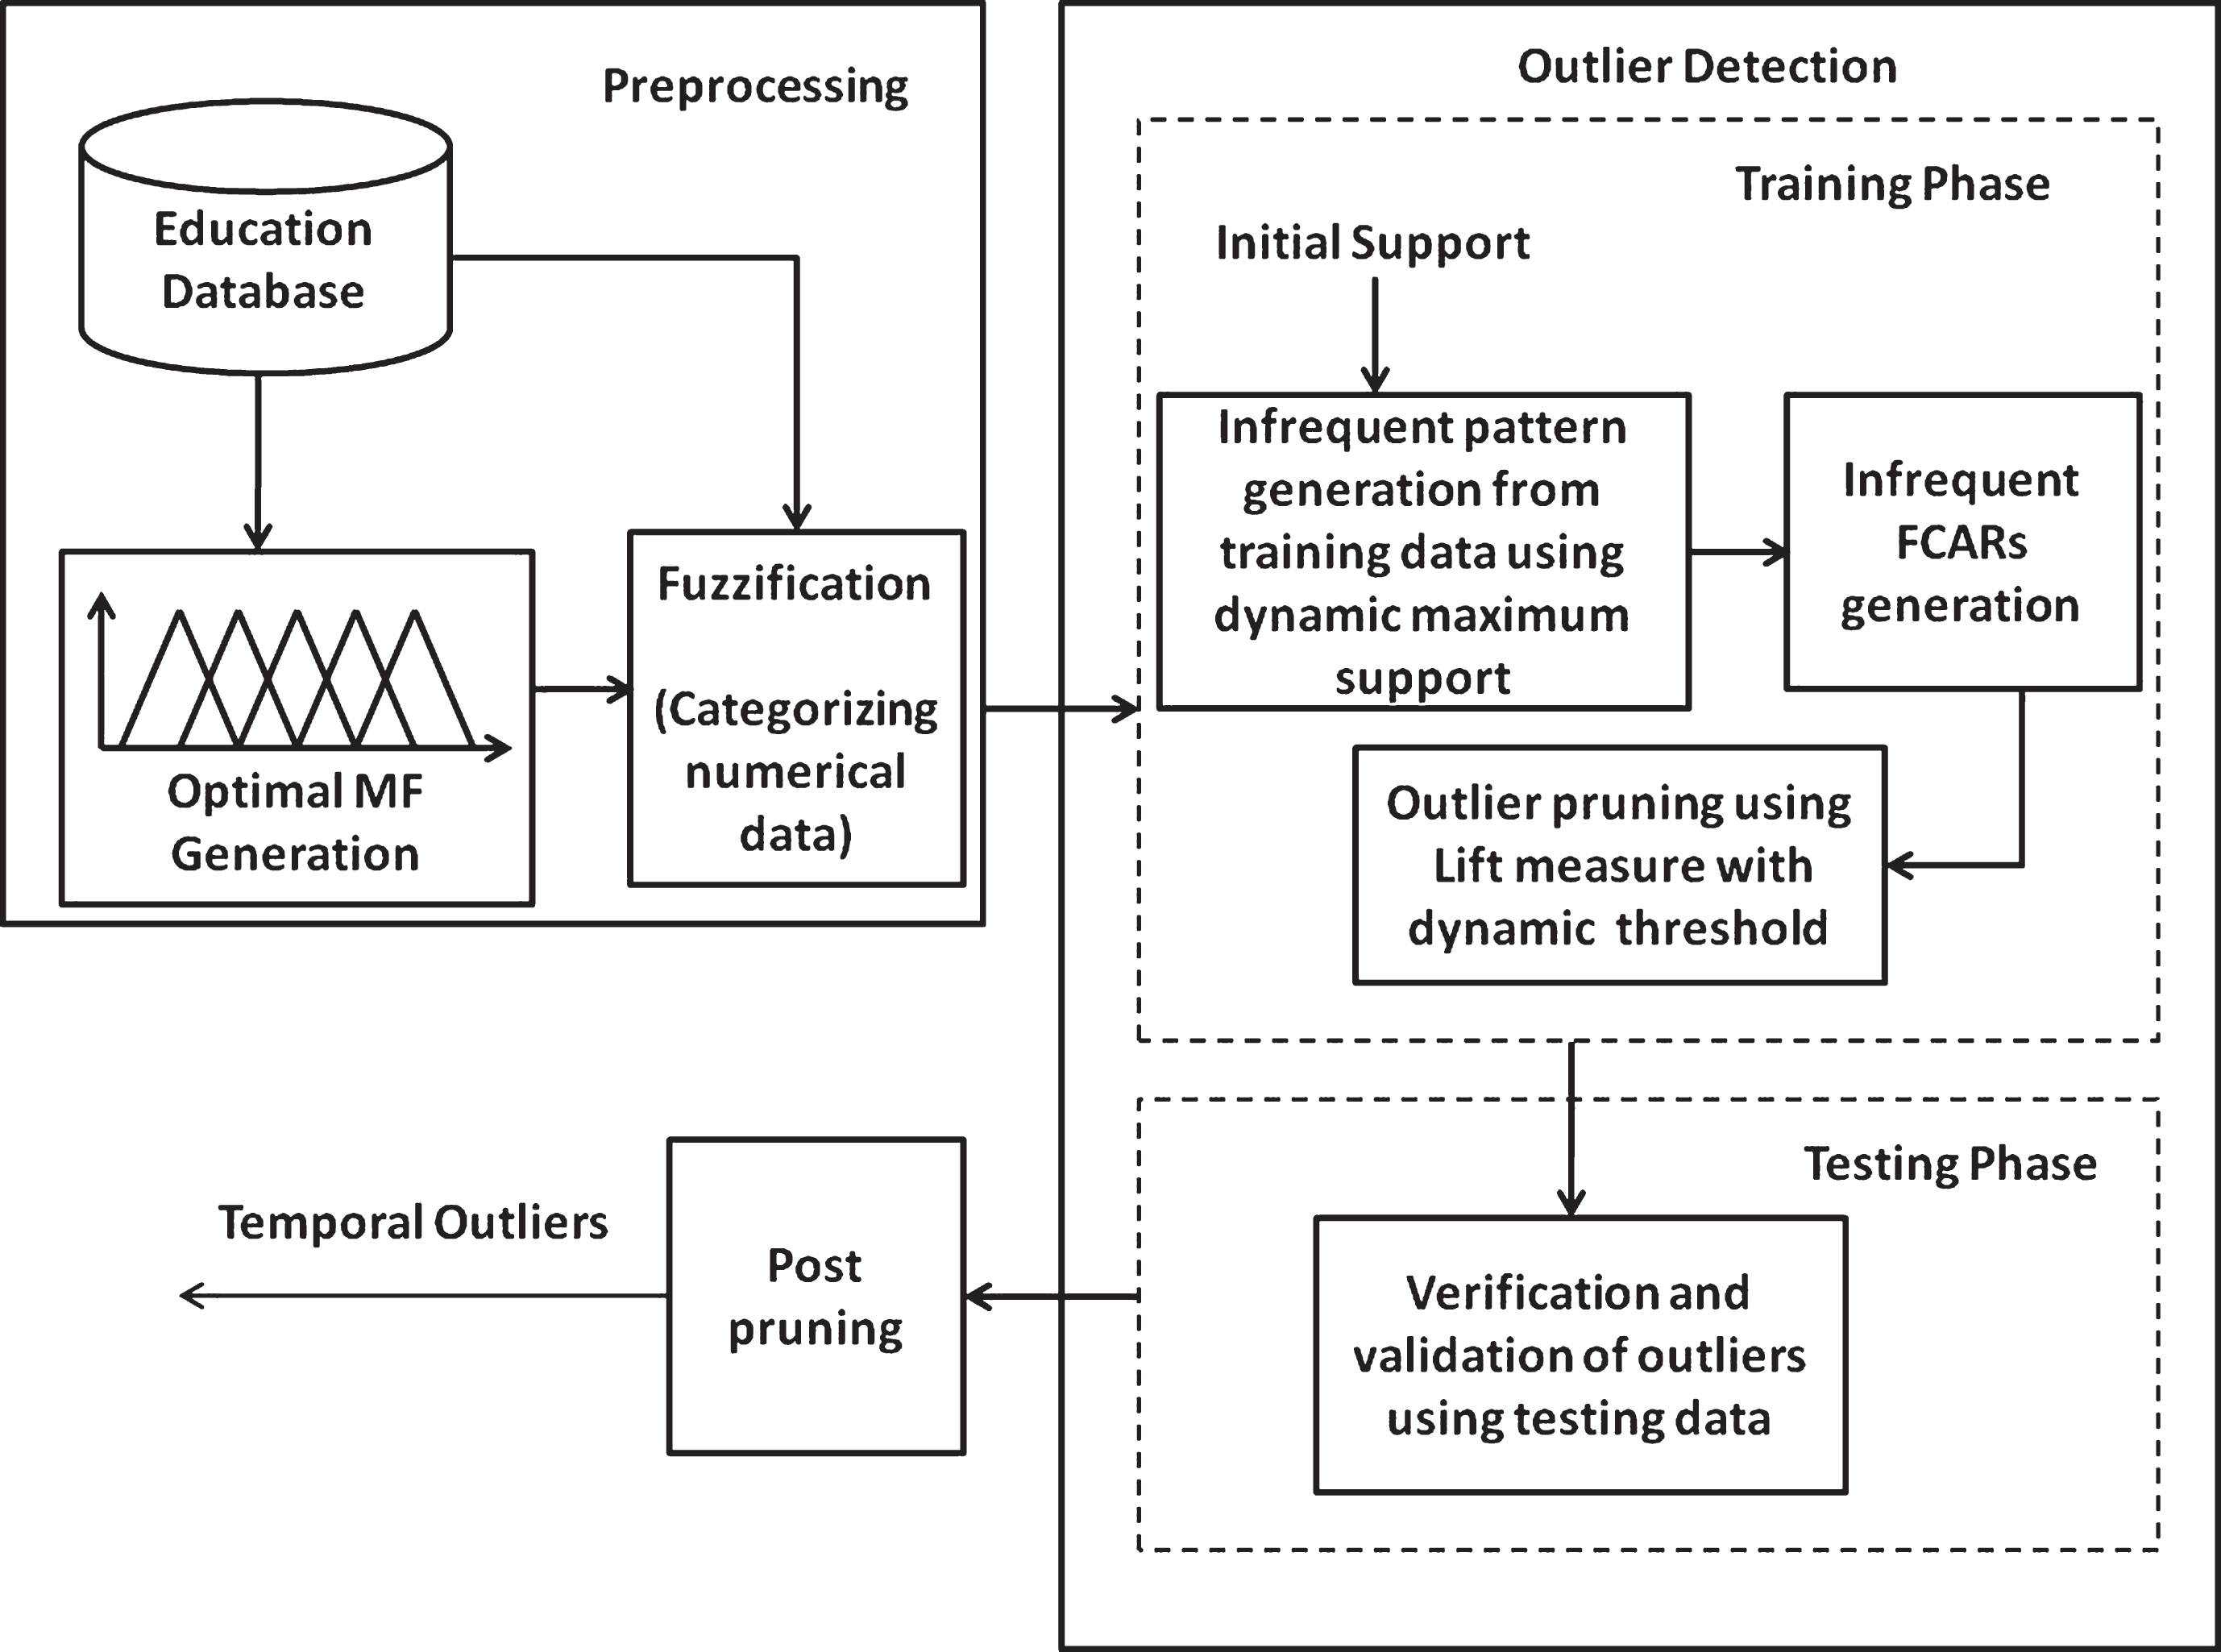
Architecture to mine temporal outliers.
As per the procedure given in Algorithm 1 and Subroutine 1, initially, based on the distribution of data for the numerical attributes, the optimal MFs are generated for each course separately. Next, the numerical data present in the entire data set (all the three mid-semester marks) is fuzzified using the dynamically generated optimal MFs. Thus, the real value of the courses is now converted into its corresponding fuzzy values. The real value of the data for the course ‘SG’ given in Table 1 is fuzzified and listed in Table 3 as a sample.
Part of the fuzzified data set
The fuzzified dataset of first mid-semester marks (Training Data) is given as input for the outlier detection phase along with the initial support, to generate the infrequent patterns. Using the initial support the dynamic support threshold is computed in each level as suggested by the authors [13]. The infrequent patterns pruned in each level are consolidated to form the entire set and used to generate the infrequent FCARs. The threshold for the rule support is computed based on the mean value of the actual support of all the FCARs generated from the infrequent patterns. Then, the outliers are pruned from the infrequent FCARs by making use of the ‘Lift’ measure.
The threshold value for Lift measure is fixed based on the mean of actual Lift values of the all the IFCARs. The outliers thus detected are validated against the outliers detected in a similar manner using the testing data (second and third mid-semester marks). The outliers that are valid in both the training and the testing phase alone are considered. In the post-pruning phase, the IFCARs with a high confidence value and without duplication is considered as a final set of outliers.
The outliers generated by FTOD by nature have highest Lift values (maximum outlier score) and maximum confidence (almost 100%) and hence, don’t even require the user-defined threshold value for the confidence measure.
The experimental setup for valuation includes the processor Pentium IV with 2.8 GHz, the CPU clock of 450 MHz, RAM with 512 MB and the Hard disk with 40 GB capacity. Likewise, the jdk1.7.0 on Windows XP/ Windows 7 software is used.
FTOD has been subjected to various experiments. At first, the performance of the outliers detected by FLS based FTOD is evaluated against the outliers detected by the crisp boundary method to understand the importance of the FLS in handling the fuzzy nature of the boundary values while categorizing the numerical data. Next, the performance of FTOD is measured against the existing similar fuzzy outlier detection methods like FARIM and modified-FARIM based on time, space, scalability, classification accuracy and the interpretability of the outlier generated. The following subsections discuss these in detail.
Analysis through crisp and fuzzy boundaries
The fundamental algorithm used for the proposed method – FTOD is the Apriori algorithm which is tuned to evolve Class Association Rules (CAR) rather than the conventional Association Rule (AR). Since ARs is not suitable for classification purpose, CARs are considered for classifying the slow learners. The method used to generate CARs is called as Associative Classification (AC). Hence, the Apriori algorithm is used to generate CARs by adopting both the crisp and fuzzy based methods for categorizing the course (numerical) attributes.
The performance of the proposed method - FTOD which adopts an FLS based AC is evaluated against the conventional AC with crisp boundary (discretization). These crisp and fuzzy based methods have been evaluated based on evaluation metrics like execution time, heap space used by the algorithm to detect the outliers, the number of outliers detected, the number of instances covered by the outliers (coverage) and the classification accuracy of the outliers detected. The experimental results arrived by the above-said methods have been tabulated in Table 4.
Performances of crisp vs. fuzzy approaches
Performances of crisp vs. fuzzy approaches
From the results depicted in Table 4, it is understood that even though the time consumed and the memory space used to detect the outliers by FTOD has boosted up six times than crisp based convention AC method, the accuracy of the outliers generated by FTOD has been improved by 13%. The improvement in the classification accuracy is because of the characteristics of natural boundary handling the property of the FLS method. This can be noticed from the threshold value dynamically fixed for both the methods. The threshold value of the Lift measure in FTOD is almost one, but the value of the conventional AC is less than 0.5. As per the characteristics of ‘Lift’ the higher value, ie., greater than one indicates the rare, occurring patterns [43]. Hence, naturally, the Infrequent FACRs (IFCARs) with Lift value greater than the threshold value of FTOD (0.94) will be an outlier. Whereas, the IFCARs generated by conventional AC with Lift value greater than 0.325 includes the noise as well. That is why FTOD was able to generate a less number of outliers than the conventional AC and as a follow up the accuracy also increased. Thus, it is proved that the boundary problem faced during the preprocessing step affects the quality of the outliers detected.
The nature of the outliers is small in the count and possesses high outlier scores. This has been demonstrated by the nature of the outliers detected by FTOD. From the results tabulated in Table 4 and by the above discussion, it is clearly understood that how the FLS is related to the improvement of classification accuracy.
FTOD make use of Lift as the outlier pruning measure to detect outliers. The results of FTOD in classifying the slow learners are compared with the existing similar outlier detection algorithms like FARIM [1] and modified-FARIM [17] (our previous work). Both FARIM and modified-FARIM make use of the same outlier pruning measure ‘RANK’. The modified-FARIM adopts the same logic as FARIM except for the position of using the outliers pruning measure. In FARIM the ‘RANK’ measure is used in the earlier stage of the algorithm as discussed in Section 2.2.3., whereas the modified-FARIM make use of it at a later stage of the algorithm. All the three algorithms ‘FARIM’, ‘modified-FARIM’ and the proposed ‘FTOD’ make use of FLS based Apriori method to detect the outliers using FCARs. These algorithms are evaluated on the education data [40], and the results are tabulated in Table 5.
Results of proposed FTOD vs. existing similar algorithms
Results of proposed FTOD vs. existing similar algorithms

Sample outliers detected.
The results in Table 5 show that FTOD consumes less heap space and less time to generate the outliers when compared to FARIM, but more heap space and less execution time than the modified-FARIM algorithm. The FARIM algorithm requires pre-defined thresholds for all the interesting measures to detect outliers whereas the proposed approach uses only the initial support as the pre-defined threshold. Even minimum confidence is not required for FTOD because all the extracted outliers by the Lift measure are almost 100% confidence. This is because the FCARs pruned by the Lift measure is high confidence by default. These results have given us enough confidence that FTOD with Lift as the outlier pruning measure detect more appropriate outliers with less memory space and less execution time than the existing algorithm FARIM and less execution time than the modified-FARIM algorithm.
Even though FTOD has generated more number of infrequent patterns because of the dynamically computed threshold for the support measure, the suggested outlier pruning measure ‘Lift’ can prune irrelevant rules and noise from the wide set of infrequent rules generated. This proves the efficiency of the Lift measure.
By noticing the instances covered by the outliers, it is understood that both the FARIM and modified-FARIM algorithms predict the failed students (with very low marks – weak students) as outliers, whereas the proposed FTOD method predicts the students who have failed in the border marks (slow learners) as outliers. Also, FARIM and modified-FARIM algorithms predict the average learners (students secured FIRST CLASS - 60% to 70%) also as slow learners. But the outliers detected by FTOD predict the students who have passed in the border marks (marks between 50% and 60%) alone as slow learners (which are our goal). This is possible with the FTOD because of the dynamic MFs which was computed uniquely for each course.
Hence, it can be concluded that FTOD with ‘Lift’ as the outlier pruning measure can detect a wide set of outliers (slow learners) from the enormous infrequent patterns generated within least execution time.
The outliers detected by FTOD, FARIM, and modified-FARIM algorithms are intensely noted and found that the boundary value of the numerical attributes (courses) in the outliers varies. Hence, the interpretation of the rules also differs. Few samples of the common outliers detected by the above-said algorithms have been listed in Fig. 4. From the outliers listed, it can be noted that for the courses CN and DB the students who have scored first class (>60%) are also classified as slow learners in the case of FARIM and modified-FARIM algorithms where ‘Rank’ is used as outlier pruning measure with static MF. But in the case of the proposed FTOD algorithm, for the same courses, those who have scored second class (<60%) alone are classified as slow learners. In the institution [40] considered for this case study, the courses CN, and DB are considered to be difficult for the students. Hence, those who have passed in first class need not want to be considered as slow learners. Instead, they are considered as average learners. But in the case of the course, MA (which is comparatively considered as an easy course by the students) those who have scored 65% are classified as slow learners by the FTOD. This is possible because of the dynamically computed optimal unique MFs for each course separately. It can also be noticed from the data set, that the marks scored by the students in the course MA are better than the CN and DB courses. This can be verified from Table 2, by noticing the lowest boundary values fixed for these courses.
Also, the scalability of the outliers detected by FTOD is measured in the perspective of the coverage and the classification accuracy of the outliers. For this, the data samples with various sizes are used for evaluation. From the graphs depicted in Figs. 5 and 6, it is understood that the coverage value of outliers detected by FTOD keep on decreasing whereas its accuracy keeps on increasing. Since outlier is rare in occurrence it’s coverage value is low. Hence, it is proved that even though the outliers detected by FTOD are moderate in coverage, they can classify the slow learners more accurately.

Coverage of the outliers detected.
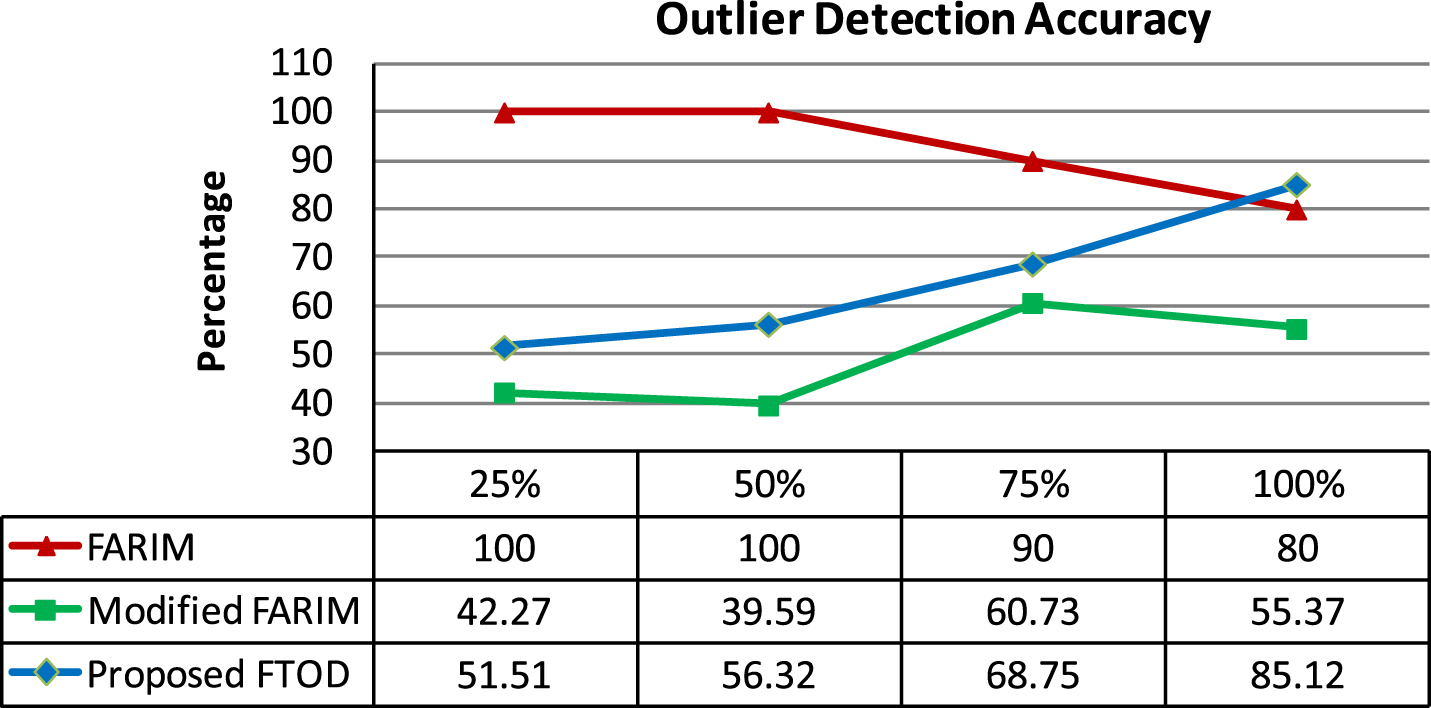
The accuracy of the outliers detected.
To understand the extensibility of the FTOD, it is also tested on the PIMA Indian Diabetes Dataset [45], to classify the patients with pre-diabetic condition among the patients who have the test outcomes for diabetes as negative (no diabetes). The experiments have been carried out with various outlier pruning measures along with ‘Lift’ measure and with two different MFs [46]. The results proved that the ‘Lift’ measure along with triangular MFs with five linguistic terms is suitable for classifying the pre-diabetic patients. Thus, pre-diabetic patients will be warned to take care of their health and protect themselves from diabetes in due course.
Fuzzy based Temporal Outlier Detection – FTOD that adopts Apriori-based associative classification technique has been proposed in this work. FTOD detects temporal outliers from the education data set that deals with the students’ performance in three mid-semester examinations conducted at various period of a semester. FTOD makes use of dynamically computed optimal triangular MFs for fuzzification. Each numerical attributes (courses) has different MF, which is the uniqueness of the proposed work. Then the rare or infrequent patterns are generated from the fuzzified data using train and test approach with a dynamically computed threshold value for the ’support’ measure. The infrequent FCARs with high confidence value is evolved from the rare patterns. Finally, the infrequent FCARs with more deviation (high outlier score) are pruned as outliers using the measure ‘Lift’. The threshold value for the Lift measure is computed dynamically based on the actual Lift value of the infrequent FCARs.
From the experiment carried out, it is found that the FTOD consumes moderate space and least execution time to detect more accurate outliers than the existing similar methods like FARIM and modified-FARIM. Because of using fuzzy logic in categorizing the numerical attributes, the proposed method detects more accurate outliers than the conventional crisp (discretization) method. Hence, it is conclude that by adopting dynamic optimal MFs for fuzzification, train and test approach based associative classification technique for infrequent FCARs generation and the unexpected measure Lift for outlier pruning, FTOD classify the slow learners from spurious-slow learners and average learners with 5% to 30% better classification accuracy than the FARIM and modified-FARIM algorithms.
As per the knowledge derived from the literature survey and from the observed experimental results, two issues faced by FTOD are suggested as the future research direction. First one is to reduce the enormously generated infrequent patterns because of adopting fuzzy logic. The second one is to improve the classification accuracy by adopting MFs other than triangular MF.
Footnotes
Acknowledgments
The authors would like to extend their sincere and soulful thanks to their institution - Thiagarajar College of Engineering for providing the support and data for this research.