
Abstract
To monitor the scene anomaly in real-time through video and image and identify the emergencies, try to respond quickly at the beginning of the emergency and reduce the loss. This paper mainly focuses on the realization of the image recognition system for the anomalous characteristics of tourism emergencies. The problem is to study the number of people in the scenic spot based on scenic spot monitoring. The video-based population anomaly monitoring method has improved the AUC index of the W-SFM method by 0.423, and the AUC has increased by 0.0844 compared with the optical flow method; Degree-enhanced algorithm (BCOF), by grasping the micro-blog data related to the scenic spot, comprehensively predicts the overall comfort of the current tourists in the scenic spot, and establishes a tourist state expression model. Compared with the BN algorithm and the NEG algorithm, the BCOF algorithm is the accuracy and the recall rate of tourists in the scenic spots was improved by 14% and 18% respectively. The image recognition system of tourism emergency anomaly was established, and the early warning model of tourism emergency based on group intelligence perception was used to implement early warning on scenic spots. Monitoring, can achieve an overall accuracy of 83.33%, the model has a strong predictive ability, and achieves a scenic spot Real-time monitoring of events.
Keywords
Introduction
The safety of tourist attractions has received more and more attention [1]. The nature of different types of emergencies is not all the same. From the 7.4-magnitude earthquake in Japan to the terrorist attacks in Paris, from the tsunami in Indonesia to the hostage-taking incident in the Philippines, the incidents are divided into artificial and natural, but the same are the emergencies.
Many research teams at home and abroad have researched the image recognition technology. The method proposed by Gabriela S [2] provides accurate performance for individual identification and characterization of three different types of ME in OCT images. Zhou Y [3, 4] proposed two end-to-end deep architectures: Spatial Cascading (SCCN) and CNN-LSTM Bidirectional Loop (CLBL), which use the advantages of convolutional neural networks and long- and short-term memory to learn different perspectives of vehicles. Transform. Acharya V [5] The K-medoids algorithm, which is robust to external noise, is used to extract WBC from an image. Shah H N M [6] proposed a new method called local threshold in the segmentation process, which includes image preprocessing, noise reduction and edge region point generation for butt joint identification. Jacques J C S [7] uses a 2D human body model to represent spatial information that may be beneficial for human matching, from which color and texture information is extracted and combined. Wang Zhaoqing [8] proposed a SIFT algorithm based on feature point matching for the gray histogram extraction algorithm when calculating image similarity. 308 feature points can be extracted by the SIFT algorithm. Li Zhongde [9] proposed a convolutional neural network algorithm based on cross-entropy cost function for the problem that the traditional quadratic cost function is not high in the process of convolutional neural network training. Zheng Yuanpan [10] discussed the development trend of deep learning in the field of image recognition, pointing out the effective use of migration learning technology to identify small sample data, and using unsupervised and semi-supervised learning to identify images [11]. The 360 panoramic technology has the advantages of simple production, good interactivity, strong immersion, etc [12]. The 360 panoramic technology is applied in the tourism industry, allowing visitors to know the scenic spot without leaving the house [13]. The emergence of panoramic video technology has enabled immersive appreciation and roaming, making users feel like they are in it, providing a powerful boost for the development of tourism [14]. Zhu Tianlong [15] selected landscape indices with obvious ecological significance such as plaque density and zonal area ratio, and analyzed the dynamic changes of the Xilamuren landscape type to provide landscape ecology for sustainable land use [16].
To solve the problem that the abnormal image of the unexpected situation in the scenic spot is difficult to identify [17], this paper studies the detection of the number of people in the scenic area based on the monitoring of the scenic area, the method of monitoring the abnormality of the video based on the crowd, and the method of identifying the abnormal events of the crowd based on the crowd trajectory. Section 1 of this paper describes and analyzes the research on image recognition technology and deep learning algorithms at home and abroad. Section 2 describes the method used in this paper and the algorithm model constructed. Section 3 is the main experimental part of the article, including data sources and evaluation indicators. Section 4 is the analysis and discussion of the experimental results in this paper. Finally, Section 5 is the conclusion of the article, which contains the experimental results.
Algorithm principle and model construction
Population estimation algorithm based on density center clustering (DPBC)
(1) Scenic area surveillance video foreground extraction algorithm
In the scenic surveillance video, considering the background environment background interference and strong illumination, we use the mixed Gaussian Modeling (GMM) method to extract the crowd prospects. The value of each pixel of the scene in the Gaussian background maintenance can be represented by a mixed distribution of k Gaussian components, the values at the time t is as follows:
Where wi,t represents the weight of the i-th Gaussian component in the mixed Gaussian model of pixel j at time t.
(2) Clustering algorithm for crowd monitoring video feature point extraction
Feature points are extracted based on the foreground, and the feature extraction schemes used in different processing algorithms are different. We use four feature extraction algorithms for comparison testing, including SIFT, SURF, and PETS2010 datasets for each algorithm.
Let feature points
Population abnormality monitoring based on population density distribution and VIF characteristics
(1) Population anomaly monitoring method based on population density distribution (W-SFM)
The Social Force Model (SFM) is a common crowd behavior analysis model. It is considered that the behavioral inertia in the crowd has its driving force, while maintaining a safe distance from surrounding pedestrians, fences and other obstacles. Its calculation formula is as follows:
Fp is the individual’s desired force,
mi is expressed as the mass of the pedestrian and represents the inertia speed of the pedestrian. vi0 represents the actual movement speed of the pedestrian, and τi is the time parameter. Finis the interpersonal force. When pedestrian i does not have direct contact with pedestrian j, the two sides only have psychological repulsive force fSij.
Then the size of the social force of the pedestrian is:
(2) VIF-based anomaly monitoring method (VIF-SFM)
Calculate the vector size
As shown in the above formula, |mx,y,t - mx,y,t-1| is the adaptive threshold calculated from the average value.
Big data based emotional comfort enhancement algorithm (BCOF)
(1) Building an emotional dictionary
Since new network hot words are always appearing in the network, network words can represent the publisher’s emotional tendency, so it is necessary to add new network terms to the existing emotional word set. In the process of microblog emotion analysis, the word segmentation operation is realized through text preprocessing.
(2) Expression enhancement factors
The degree adverbs dictionary is divided into four categories: severe, intensity, moderate, and light, and they are given their respective weights, as shown in Table 1.
Degree adverb dictionary
Degree adverb dictionary
(3) Emotional measurement function
Determining the emotional tendency of a word requires judging the positive similarity and the negative similarity and the threshold. Words with sentimental tendencies are added to the sentiment dictionary, and neutral words that do not have an emotional tendency are removed. The final expression of the sentiment dictionary:
Where e represents the intensity of the emotion. The following formula is used to calculate the emotional bias value of the word.
M represents the similarity between the word w and the negative emotion word p.
(4) Emotional comfort acquisition
The excavation of the bearing capacity of the scenic spot is defined by the comfort model, and the state of the scenic spot tourists is measured according to the comfort index recorded on the official website of the Beijing Tourism Administration. The comfort-related attribute records are shown in Table 2.
Scenic Comfort Index
Among them, the value of the negative degree Neg is defined according to the relationship between the negative sentiment and the total number of filtered microblogs, as shown in the following formula:
Num neg indicates the number of negative sentiment microblogs in the collection, ∑Num represents the total number of microblogs after the overall filtering. The negative index obtained after calculation is a decimal between 0-1. The larger the Neg, the higher the negative degree of tourists in the scenic spot, and the side reflects the current state of the scenic spot and the bearing capacity of the scenic spot.
To consider the overall tourist status of the scenic spot, a tourism-aware environment was added to the impact factor, including the scenic tourist comfort index obtained in the previous study and the average passenger flow index of the scenic spot. The overall early warning model impact indicators are shown in Table 3.
Impact indicators of early warning models
Impact indicators of early warning models
(2) Establishment of network architecture
The function in the network is a function that reflects the intensity of the underlying input data to the stimulation pulse of the upper node, also known as the stimulus function. In this chapter, the Sigmoid function is selected as the function between the hidden layer and the output layer node. Using the LOGSIG tangent function, the output of the function is a continuous value between [0, 1], and its expression is as follows Show.
Wherein, when the function result is lower than 0.15, it indicates that the prediction result is 0; when the function result is higher than 0.85, it indicates that the prediction result is 1; and when the function result is in the interval 0.15 to 0.85, the result is regarded as a prediction on the network model. failure.
Data source
The test selected the PETS pedestrian data set of XXX University as the test set. Different foreground extraction methods are used to detect the influence of the intermediate process on the detection effect, the population cluster is extracted, the population cluster density is calculated, the corresponding number prediction function is trained and learned, and the learned parameters are manually modified to detect the prediction function to the final scenic spot. The effect of the number of people detecting the effect.
The test selected the UMN data set of XXX University as the test set, and set different social force matrix dimensions to detect the influence of the dimension on the prediction accuracy. To test the accuracy of the state detection of the abnormal behavior detection module of the scenic spot, 10 scene sequences in the data set are used as test cases, and a response prompt is given when an abnormal state is detected.
The UFC dataset and VIF dataset of UCF University were selected as test sets, and the effects of different optical flow extraction algorithms on crowd trajectory judgment were set. To test the accuracy of the detection of the abnormal behavior recognition module of the scenic group, 10 scene sequences in the data set are used as test cases, and the abnormal behavior is detected and responded to when the abnormal behavior is detected.
Test methods and results
In the test of the verification system for the scenic number detection module, the CONTE algorithm and the crowd density based population estimation algorithm were used for testing. The sequence of 10 scenes in the pedestrian data set is selected, and the performance of the algorithm is evaluated by the detection deviation rate of the number of scenes. The test results are shown in Table 4.
Test results of the scenic spot number detection module
Test results of the scenic spot number detection module
In the test of the verification system for the abnormal behavior detection module of the scenic spot, the FLOW algorithm, the SocialForce algorithm and the proposed VIF-SFM algorithm and the sequence set of 10 normal state-to-exception states detected by the W-SFM are respectively detected and detected. The occurrence of the abnormal state represents a hit, and the test results are shown in Table 5.
Test results of the scenic area abnormal behavior detection module
To test the accuracy of the detection of the abnormal behavior recognition module of the scenic group, 10 scene sequences in the data set are used as test cases, and the abnormal behavior is detected and responded to when the abnormal behavior is detected. The results of the module identification test are shown in Table 6.
Test results of the scenic area abnormal behavior detection module
The accuracy of the algorithm is evaluated using mean absolute error (MAE), mean relative error (MRE), and root mean square error (root mean square error).
Experimental results and performance analysis
Experimental results and analysis of population estimation algorithm based on density center clustering
The algorithm of this paper is compared with the Aibiol algorithm and the Conte algorithm. The experimental results are shown in Table 7.
Video experiment results
Video experiment results
The error of this algorithm is relatively large on the 1 and 2 datasets. This is because the 1 and 2 datasets filter the illumination. In the absence of illumination, some feature points are filtered, resulting in relatively large errors, while in 3, 4 on the dataset, the results of this method are significantly better than Aibiol and Conte algorithm, in which MAE is 3.72, MRE is 19.18%, and RMSE is 3.43. This is because, in the strong light conditions, this paper uses clustering based on density center and mixed Gaussian model. (GMM) inhibited the influence of light, and the results were very close to the actual number. The surface method can be effectively used for the monitoring of scenic spots. Figure 1 shows the crowd recognition effect diagram under different algorithms.
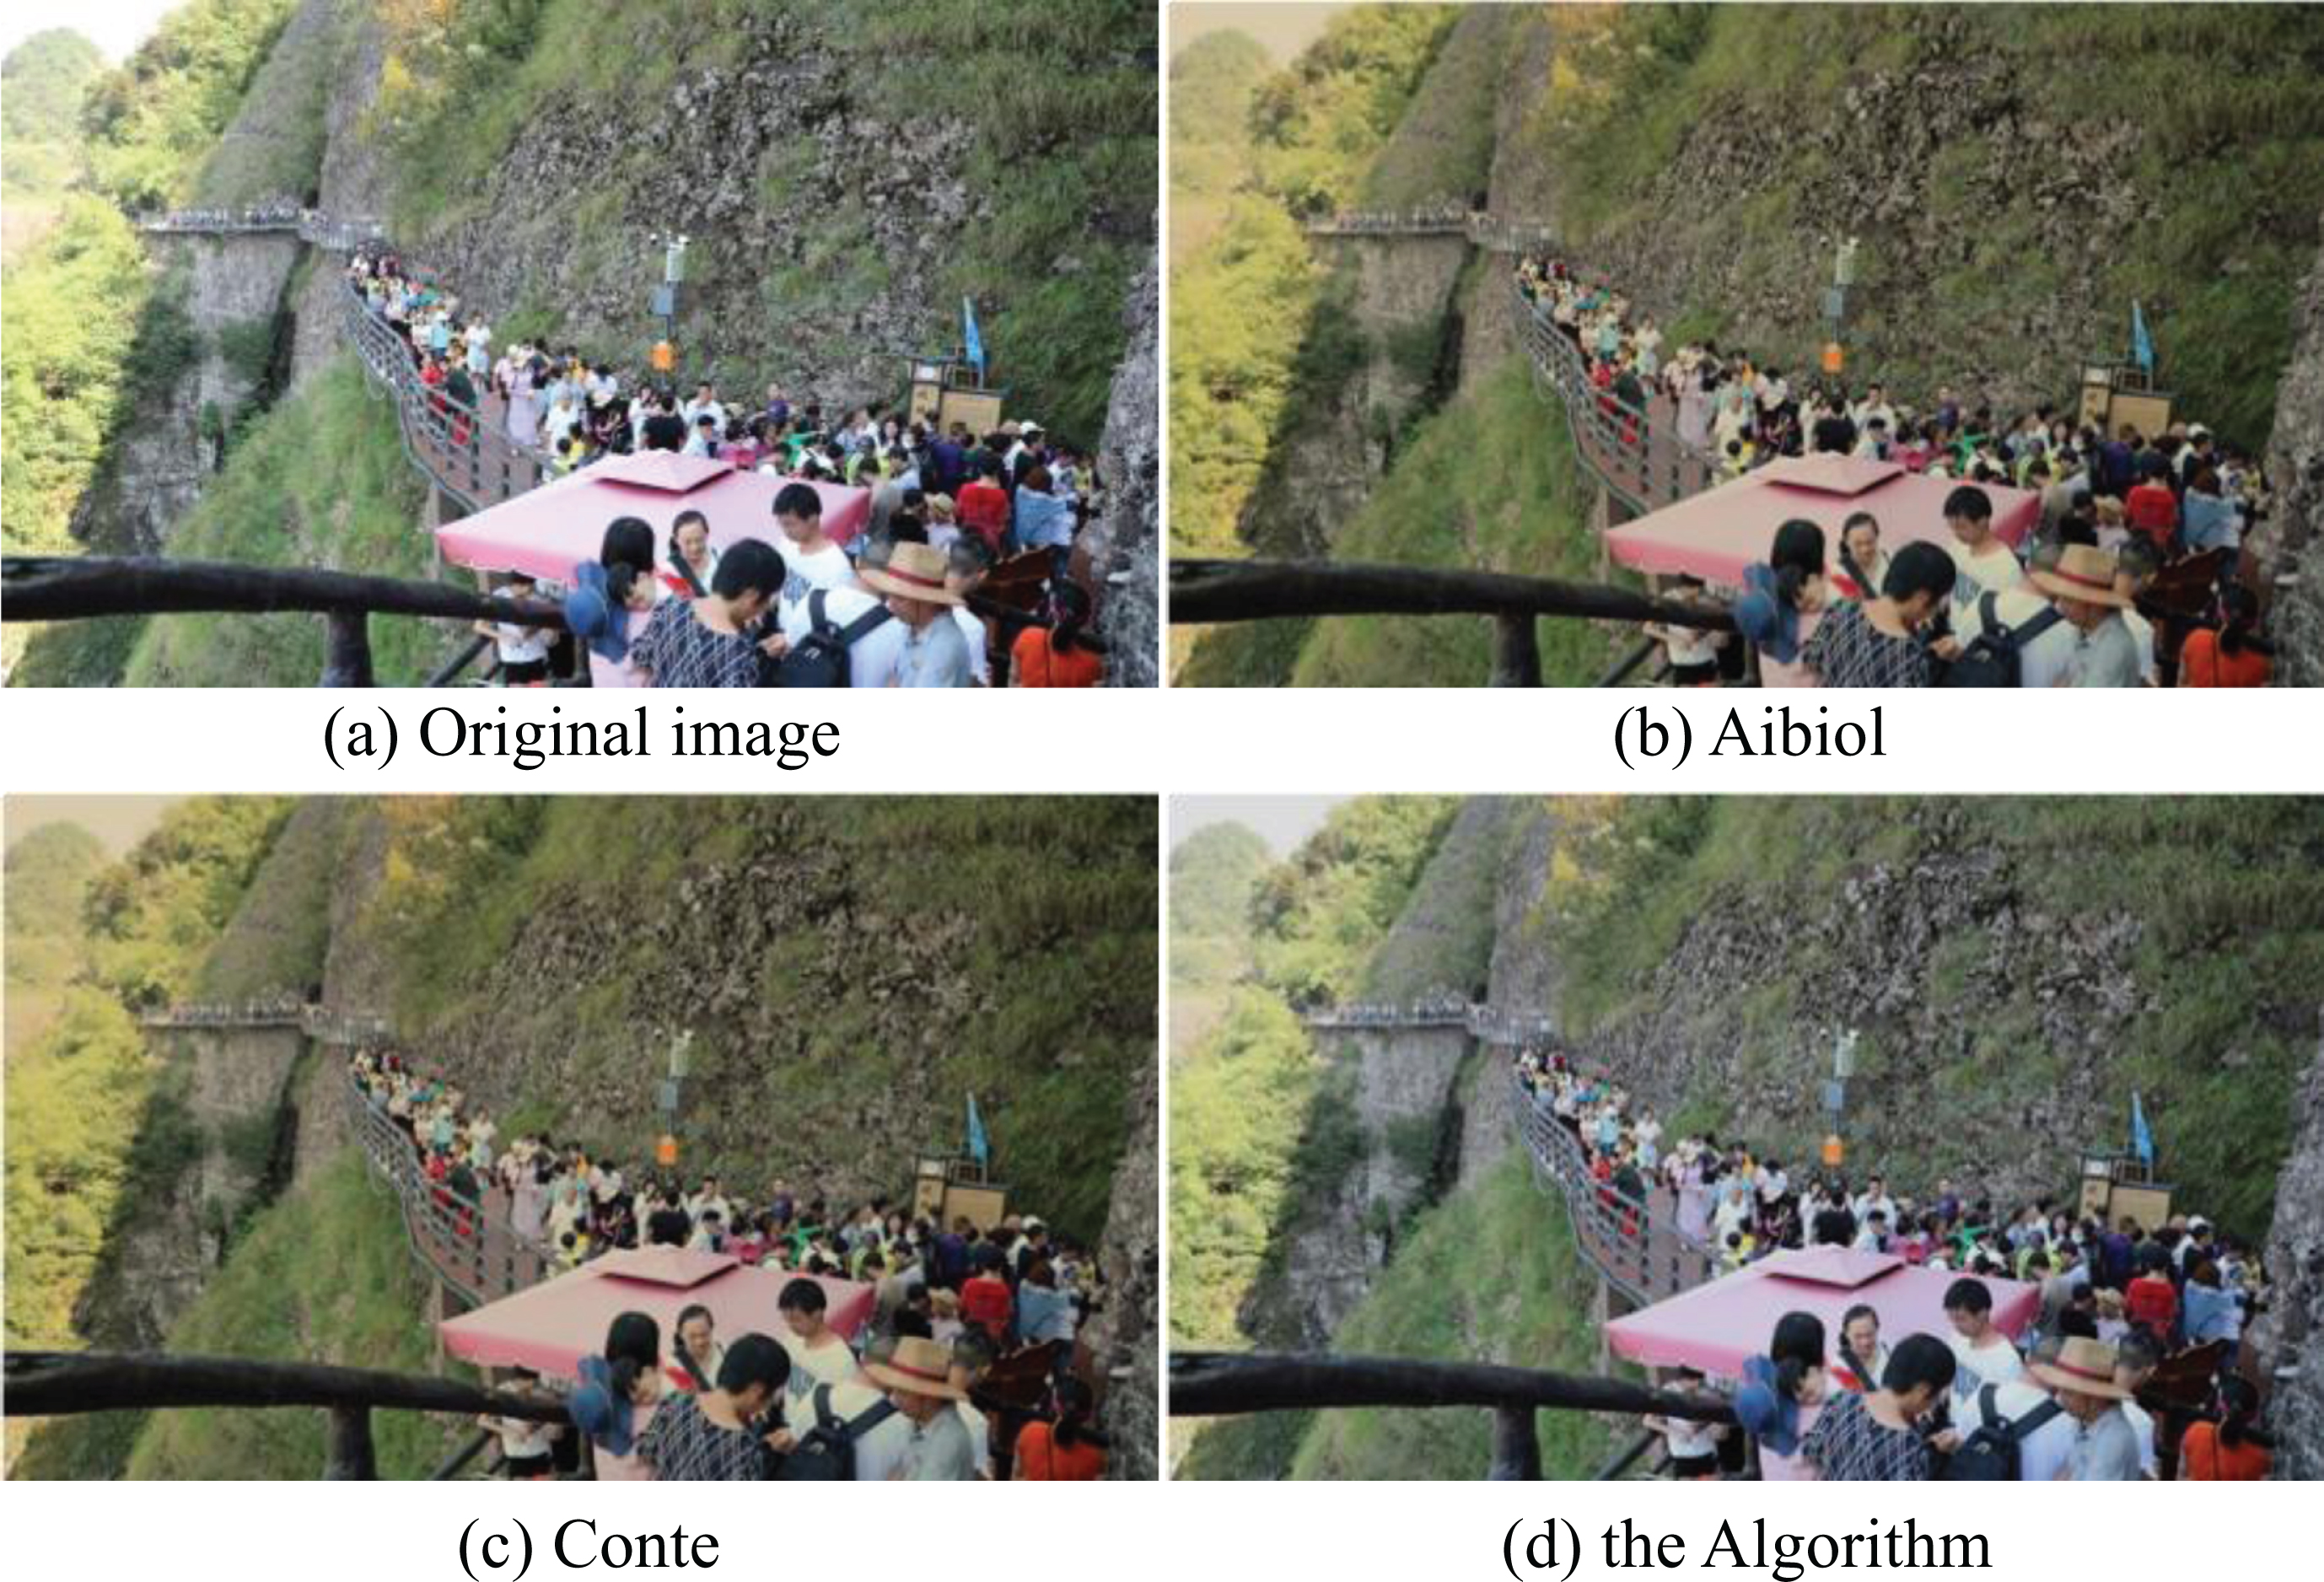
Population identification by different algorithms.
When the 30th frame is reached, the background interference is gradually reduced, and the foreground is extracted. The population is divided into 4 clusters, which indicates that the algorithm can separate the population better, and there are more feature points in the farther places. After processing the surveillance video of the tourist scenic spot, according to the previous module function, the texture feature vector and the population density of each frame of the video frame are further obtained. The experimental results are shown in Fig. 2.
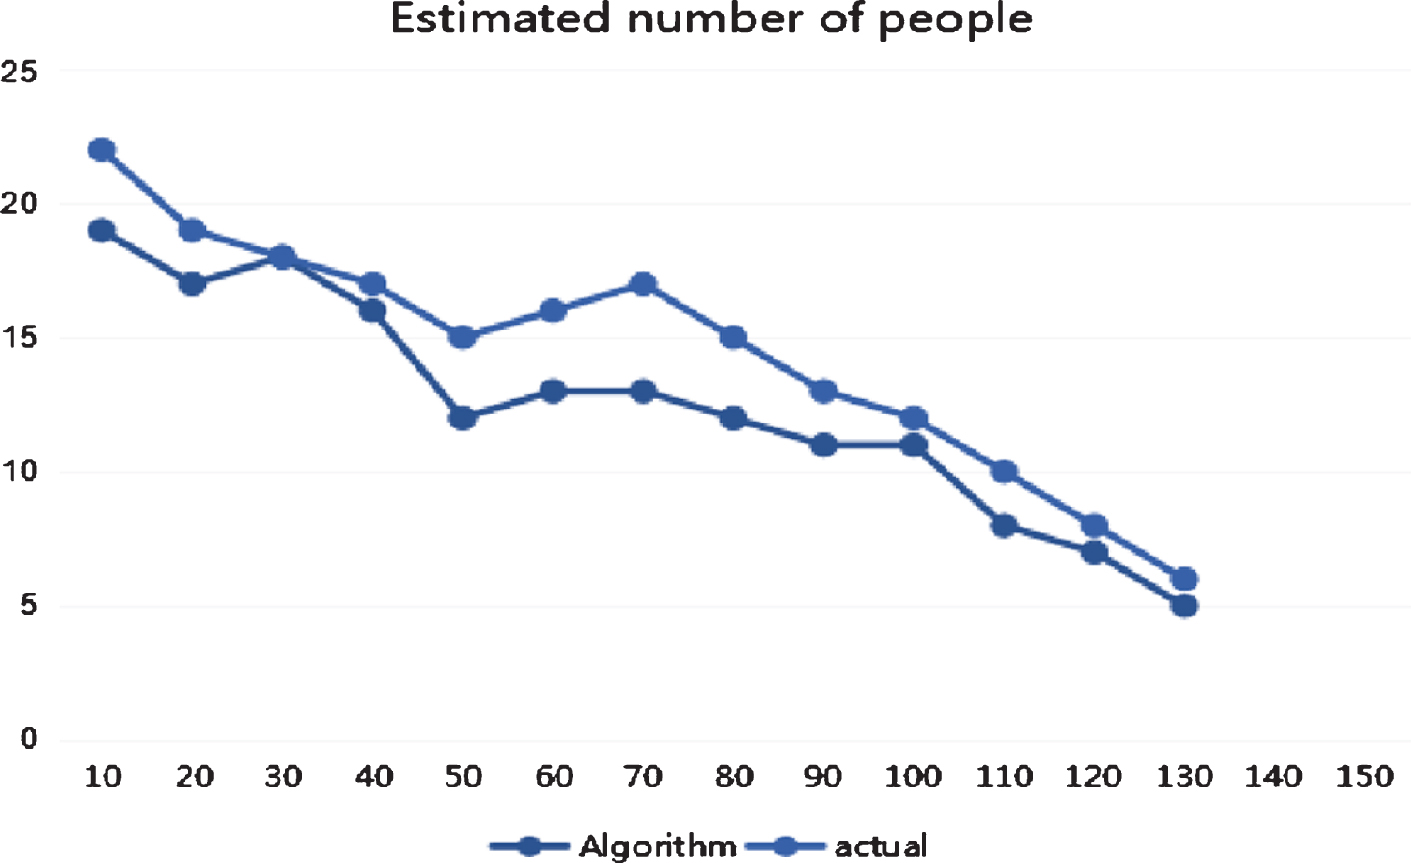
Estimated statistics of scenic spots.
As shown in the Fig. 3, it can be seen that the basic performance of the research population density detection module can meet the needs of practical applications. The comprehensive performance of the algorithm can achieve 75% accuracy, and the algorithm maintains a high accuracy rate for detection in different scenarios, indicating that the module has better portability for different scenarios. The estimation results were evaluated with an MAE of 2 and an MRE of 18.52%.

Distribution of population density in unexpected situations in tourist attractions.
Using the 60*60 matrix dimension to create a visual dictionary, the visual words are extracted on consecutive 10 frames of video sequences, the visual dictionary is clustered by the k-means algorithm, and the final dictionary includes 100 clusters, which will be proposed. The crowd abnormality monitoring method (W-SFM) of population density distribution is compared with the traditional social force model (SFM) algorithm. The comparison results are shown in Table 8.
PETS and UMN dataset experimental results
PETS and UMN dataset experimental results
The W-SFM method proposed in this paper is accurate and reliable for the detection of anomalies. In the UMN scenario, the accuracy of the three indexes of precision, recall and total accuracy increased by 16%, 7.2%, and 5.8% in PETS2010. The data set increased by 3.78%, 12.2%, and 1.06%. The force model makes the model more realistic. Figure 3 shows the abnormality detection and identification of people through different population density distributions.
The relationship between detection rate and false alarm rate is widely used in the comparison of algorithms for abnormal monitoring. Generally, the algorithm is compared by calculating the area under the curve (AUC). The closer the value of AUC is to 1, the better the performance of the anomaly monitoring algorithm is. Therefore, the ROC curve is used to evaluate the algorithm effect. The ROC curve of this video set is shown in Fig. 4.
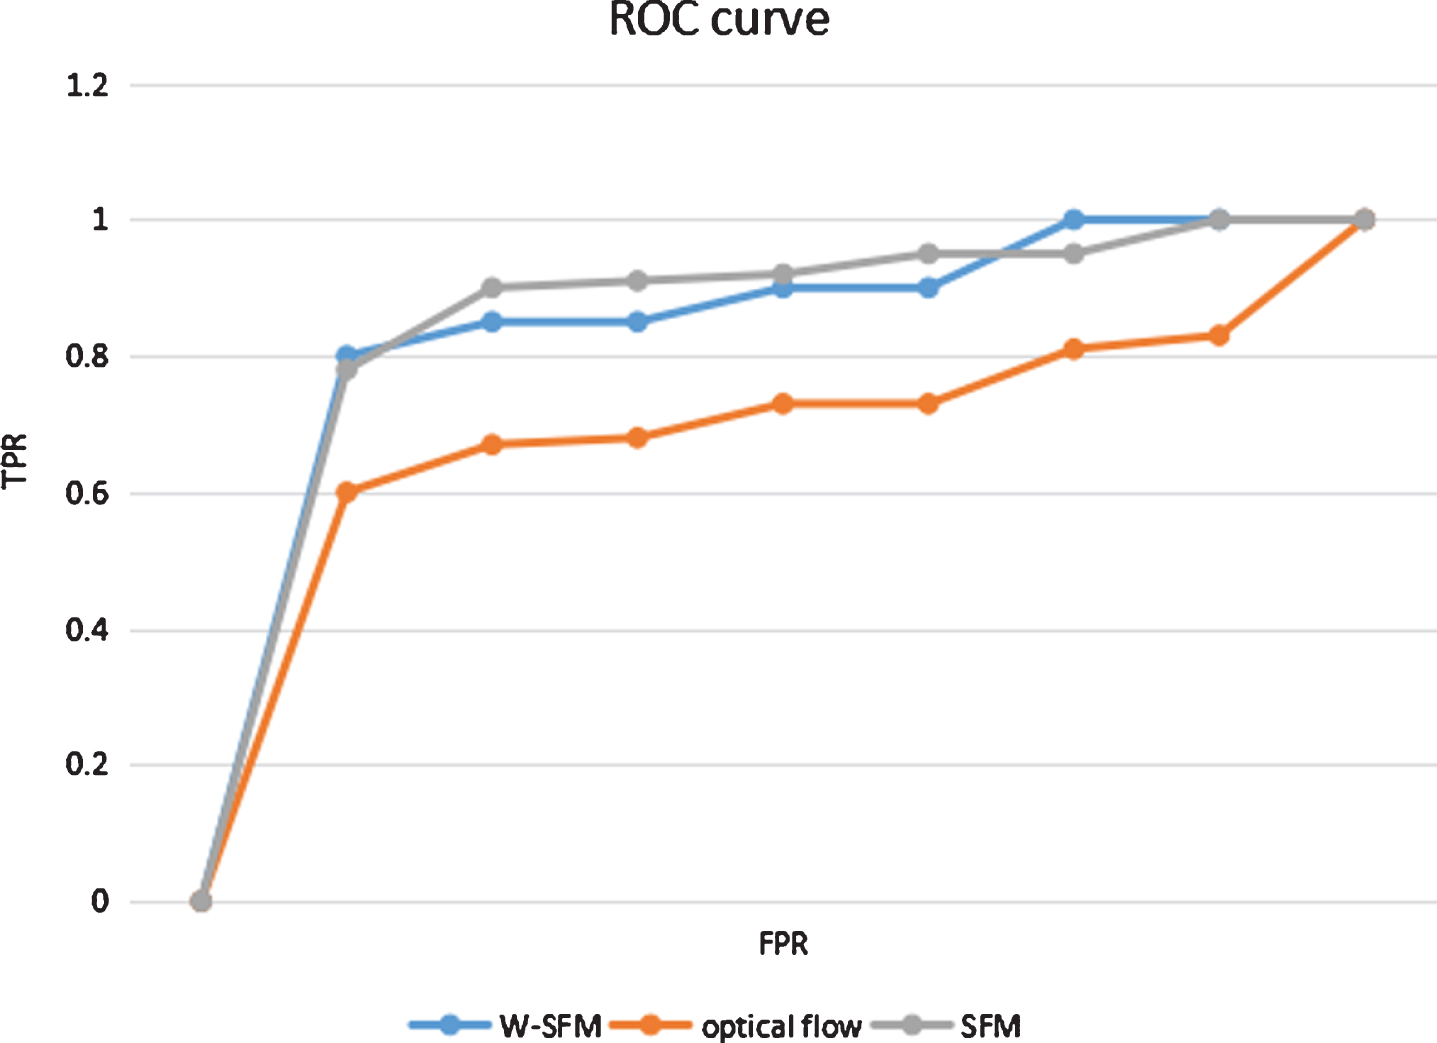
W-SFM anomaly monitoring ROC curve.
The calculated AUC value is: optical flow model: 0.8821, social force model (SFM): 0.9242, this paper: 0.9665, compared with the SFM model, the proposed W-SFM method is improved by 0.423. Compared with the optical flow method, the increase is 0.0844. From the comparison between the final result and the experimental results of the social force model, it can be seen that the population density distribution proposed in this paper is more accurate and reliable, and the accuracy is improved compared with the traditional social force model.
The three algorithms of BE, decision tree and EE were tested under the same data set, and the effects of the algorithm were observed under the accuracy, recall and F1 index of emotional tendency prediction. The experimental results are shown in Table 9.
Comparison of Emotional Enhancement Tendency Indicators
Comparison of Emotional Enhancement Tendency Indicators
According to the results of Table 9, it can be seen that the emotion enhancement propensity algorithm EE implemented in this chapter performs better than the BE and decision tree algorithms. The main reason is that the algorithm simply labels the sentiment words for the appearance. The record is 1, and the non-appearance is recorded as 0, so the calculated emotional value does not take into account the degree of inclination, and is relatively rough. Compared with BE, the performance of the decision tree algorithm decision tree is still relatively optimized, and the recall rate and accuracy index are close to 70%. The proposed EE algorithm is superior to the decision tree in the performance of each experimental index. Compared with the former two comparison algorithms, the proposed EE algorithm has an improvement of 3–19% in the accuracy of the prediction, and a 6% improvement in the recall rate index, which is well suited for the subsequent emotion-based enhancement. The comfort algorithm laid the foundation.
The comfort data is taken from the scenic comfort index on the website of the Beijing Tourism Bureau. The scenic area data of the past month is captured and segmented according to the period. The BCOF is compared with the microblog quantity prediction method BN and the negative emotion prediction method NEG on the experimental set. The experimental results are shown in Table 10.
Comparison of scenic comfort test
From the experimental results indicators, the performance of the microblog quantity prediction method BN is the worst, which shows that if the number of microblogs published in the scope of K only reflects the number of tourists is not feasible, the number of microblogs and tourists are mapped. Compared with the BN method, the NEG method has a certain effect improvement, and has 63% and 56.1% performances in comfort prediction accuracy and recall rate respectively, indicating that the negative emotion attribute after emotion enhancement has obvious correspondence with the comfort of the scenic spot. However, the BCOF algorithm proposed in this chapter improves the accuracy index by 14% compared with the NEG algorithm, and increases the recall rate by 18%.
According to the previously determined number of nodes in the input layer and output layer, we obtained four neural network prediction models of 14-7-2, 14-8-2, 14-9-2, and 14-10-2. The network initialization of the four different structures takes the same initialization and the same training samples for training prediction. The result of each model is shown in Table 11.
Comparison between different network structures
Comparison between different network structures
It can be seen from the experimental results in Table 10 that the result of the 7-node structure in the hidden layer has the largest error, that is, the training convergence has the worst effect; the network model with 9 and 10 nodes has the same error. On the other hand, from the perspective of training speed, the network training speed with 8 nodes is significantly faster than the other three types of network models. Figure 5 is a diagram showing the recognition effect of four different models of the model on the training samples.

Four different structure prediction model recognition effect diagram.
A total of 140 training samples were randomly selected from the tourism destination data to train the network model, and the performance of the training model was judged from the accuracy of the prediction results. The remaining 60 scenic spots data were selected as the test set, and the experimental results obtained are shown in Table 12 and Table 13.
Model training performance results
Model training performance results
It can be seen from the experimental results that the accuracy of the overall prediction reached 80.71% in the training experiment. Among them, 70 data are belonging to the burst state, 55 are correctly detected, and the prediction accuracy is 78.57%; the sample data in the non-burst state is also 70, and 12 are not correctly detected, and the prediction error’s rate is 17.14%.
In the test group experiment, the data in the remaining 30 tourist attractions were tested. A total of 60 data samples, of which 50 were correctly predicted and 10 were predicted to fail. In summary, using the early warning model of tourism emergency based on group intelligence perception to implement early warning monitoring of the scenic spot, the overall accuracy of 83.33% can be achieved, and the model has strong predictive ability.
The experimental results show that the EE algorithm proposed in this chapter is improved by 3% and 6% respectively in the prediction accuracy and recall rate of sentiment orientation compared with the decision-tree algorithm. Besides, the accuracy and recall of the BCOF algorithm proposed in this chapter in the comfort prediction rate indicator is 14% and 18% higher than the NEG algorithm.
Based on the relevant tourism indicators of social network and scenic video mining, combined with the relevant scenic state indicators of the statistical department of the National Tourism Administration, an early warning model of tourism emergencies was established. The experimental results show that the proposed early warning model of tourism emergency based on group intelligence perception has higher prediction accuracy.
Conclusion
The research work of this thesis mainly focuses on the realization of the image recognition system of tourism emergencies. The number of people in the scenic spot based on scenic spot monitoring, the abnormal monitoring method based on video, and the identification of abnormal events based on crowd trajectory are studied. An estimation algorithm for the number of people based on scenic surveillance video is proposed. A population estimation algorithm based on SVR regression and population density clustering is proposed. The SVR regression method was used to estimate the number of people, and the population detection algorithm for scenic area monitoring was realized. The error-index MAE was 3.72, the MRE was 19.18%, and the RMSE was 3.43 in the PETS2010 data set glare data set 3 and 4. A method for monitoring the abnormal state of the crowd based on the surveillance video of the scenic spot is proposed. The W-SFM method has an AUC index of 0.423, which is an increase of 0.0844 compared to the optical flow method. On the UNM dataset, the VIF-SFM method has an AUC increase of 0.0629 compared to the SFM model. The AUC is increased by 0.1050 compared to the optical flow method. A video-based population anomaly recognition method is proposed, which combines crowd trajectory information with a template matching algorithm for population anomaly recognition. It has good performance in the common population abnormal dataset and the scenic surveillance video set. On the UCF and VIF datasets, the accuracy and recall rate of the scene recognition results are 78.6 respectively. % and 79.9%.
Footnotes
Acknowledgments
This work was supported by the National Social Science Fund Projects: Research on Multi-modal Semantic Recognition from the Perspective of Tourism Safety (No. 17XYY012).