
Abstract
Aiming at the characteristics of time-frequency analysis of unsteady vibration signals, this paper proposes a method based on time-frequency image feature extraction, which combines non-downsampling contour wave transform and local binary mode LBP (Local Binary Pattern) to extract the features of time-frequency image faults. SVM is used for classification and recognition. Finally, the method is verified by simulation data. The results show that the classification accuracy of the method reaches 98.33%, and the extracted texture features are relatively stable. Also, the method is compared with the other 3 feature extraction methods. The results also show that the classification effect of the method is better than that of the traditional feature extraction method.
Introduction
In recent years, many accidents have been caused by mechanical equipment failures at home and abroad [1]. For example, [2] Datong Power Plant in 1985, Qinling Power Plant in 1988 and Fuxin Power Plant in 1999 all suffered a 200 MW unit damage accident. The direct economic losses exceeded hundreds of millions of yuan, and also seriously affected the power supply of the regional power grid. The indirect losses are difficult to estimate. Therefore, real-time condition monitoring and fault diagnosis of rotating machinery and equipment, eliminating hidden troubles and preventing major accidents have become one of the current important research topics. Since the 1960s, great achievements [3] have been made in the research of on-line fault diagnosis technology and its application in rotating machinery, especially in large-scale rotating machinery abroad, and corresponding practical on-line monitoring and fault diagnosis system for engineering has been developed. For example, from 1976, WHEC in the United States began to develop fault diagnosis machinery for rotating machinery to 1990, it has developed into a networked intelligent fault diagnosis expert system for turbogenerator units - power plant AID system. The research on fault diagnosis of rotating machinery started late in China, but it developed rapidly. Since the mid-1980s, there have been successive studies, and great achievements have been made in theory and application.
Fault diagnosis process based on feature extraction of time-frequency images.
At present, the research of equipment fault diagnosis technology mainly focuses on the following aspects: fault information detection, fault mechanism research, information processing and fault feature extraction technology and monitoring and fault diagnosis system research [4]. At present, the use of graphics recognition technology in fault diagnosis has attracted the attention of researchers [5–9]. For example, Shi Dongfeng et al. proposed the method of reconstructing low-frequency and double-frequency axis trajectories based on a two-dimensional holographic spectrum to diagnose common faults of rotating machinery. Li Z and others discussed the application of graphics processing technology in diesel engine vibration fault diagnosis. Dou Wei et al. used an artificial immune reverse selection algorithm to realize the fault diagnosis of rotating machinery. Because the rotating machinery is an unstable power system, the variation of the load and the instability of the rotating speed of the equipment will make the vibration signal unsteady. The non-stationary characteristic of the vibration signal will be more obvious once the equipment has rubbing or loosening faults. To analyze unsteady vibration signals, many scholars have applied time-frequency analysis methods, such as Wigner-Ville distribution, wavelet transform and high-order spectrum analysis, to mechanical fault diagnosis [10]. However, fault diagnosis based on time-frequency representation is usually accomplished by experienced experts, and the dimension of time-frequency representation is too high to be classified directly. Therefore, how to extract effective features from time-frequency representation has become a research hotspot. Because time-frequency representation contains a large number of Fourier samples, it has high computational complexity and is not suitable for remote transmission and real-time processing. Therefore, this paper proposes that the time-frequency image is acquired by the wavelet transform of the vibration signal of the equipment, and then the fault features of the time-frequency image are extracted by the combination of the non-down sampling contour wave transform and the local binary mode LBP. SVM is used for classification and recognition. Finally, the validity of the method is verified by simulation data analysis.
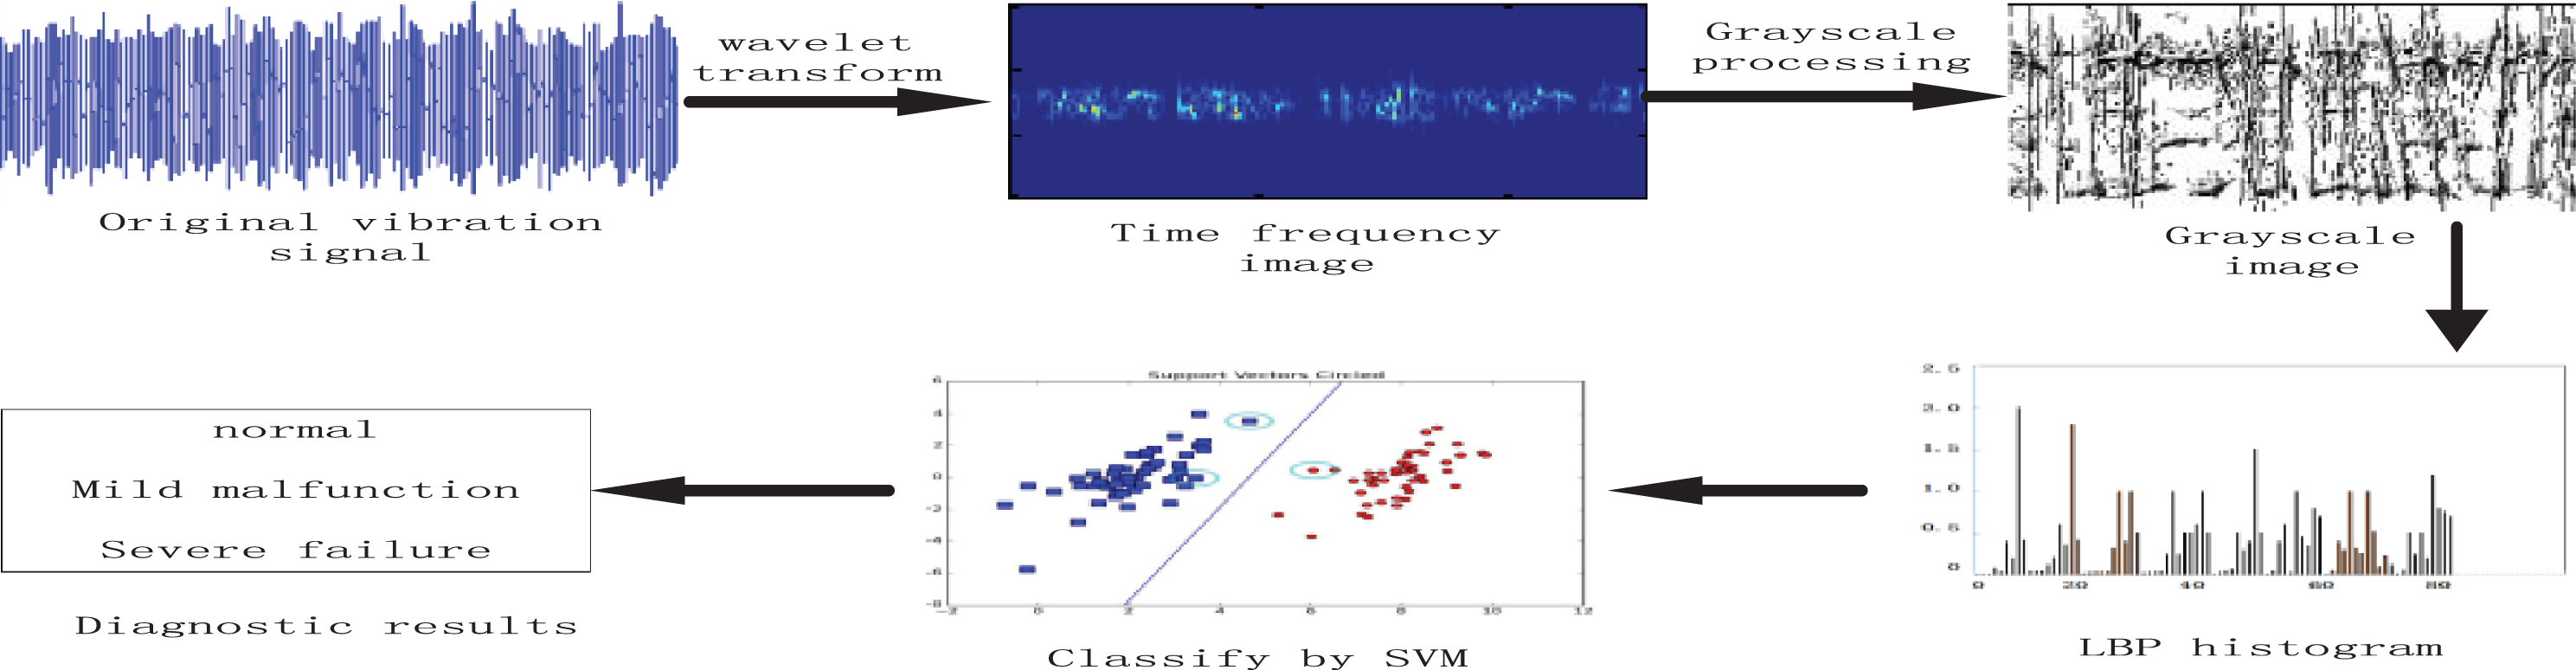
The process of equipment fault diagnosis using time-frequency analysis is shown in Fig. 1. Specifically, the diagnosis process is mainly divided into three steps: the construction of time-frequency images; the feature extraction and classification of time-frequency images.
Construction of time-frequency image
Typical time-frequency analysis methods include [11]: Wavelet Transform (WT), Hilbert Transform (HHT), Short-time Fourier Transform (STFT), etc. Wavelet transform is an ideal method for time-frequency analysis and processing of vibration signals.
1) Wavelet transforms the time-frequency analysis method.
Wavelet transform [12] intercepts and analyses signals in segments along the time axis mainly through a variable-scale sliding window. It is a multi-scale time-frequency analysis. By analyzing the decomposition results of signals at different scales, it obtains the characteristics of signals and achieves the purpose of signal analysis. The basic step of wavelet transform is [13]:
Continuous wavelet transform
Set ψ (t) is a square-integrable function, ψ (t) ∈ L2 (R). If the Fourier transform ψ (ω) of the function satisfies:
It is called ψ (t) is based wavelet. The wavelet function ψ (t) is obtained through time-shifting and scaling to get the wavelet sequence:
Among them, a and b are scaling factors and translation factor respectively. ψa,b (t) is wavelet basis functions depending on a and b, which are similar to window functions of short-time Fourier transform and have locality in time and frequency domains?
For any function x (t) ∈ L2 (R), its continuous wavelet transform CWT (Continuous wavelet transform) is defined in the time domain as follows:
Among them, ψ (t) is the basis wavelets, () * represent conjugate, a is the scale factor and b is translation factor. The size of the time-frequency window in the wavelet transform is independent of a and b, but the shape of the window changes with a. When a decrease, in the direction of the frequency domain, the center frequency of the wavelet function gradually increases, and the frequency band gradually widens; in the direction of time domain, the wavelet function gradually narrows.
2) Discrete wavelet transform
The form of discrete wavelet transform is:
Among them, a0 > 1, b0 ≠ 0, m, n ∈ Z
Set the wavelet
3) Calculation of wavelet scale spectrum
The wavelet scale spectrum SG
x
(a, b ; ψ) is defined as the square of the modulus of the continuous wavelet transform coefficients. It is expressed as:
Among them, a is a scale factor and b is a translation factor. Wavelet scale spectrum can effectively extract time-frequency information from signals.
In this paper, the time-frequency image of the vibration signal is obtained by wavelet transform. The wavelet coefficients of the signal in the whole time and frequency range are obtained, and then the wavelet coefficient matrix is obtained. Figure 2 shows a wavelet time-frequency diagram.

Wavelet time-frequency image.
To facilitate image processing, it is also necessary to transform the wavelet time-frequency graph into a grayscale image. In this paper, the wavelet time-frequency diagram is transformed into a 256 level grayscale.
In this paper, non-down sampling contour wave transform and local binary mode LBP are combined to extract fault features from time-frequency images.
1) Non-down-sampled contourlet transform
Contour wave transform [14, 15] is a multi-scale geometric analysis method, The transformation process is shown in Fig. 3. Firstly, the input image is decomposed from LP into high-frequency and low-frequency sub-bands, in which the low-frequency sub-band is formed by the signal decomposed and filtered by a low-pass filter and sampled by interlaced columns. The high-frequency subband is decomposed into many directions by DFB, while the low-frequency subband is further decomposed into high-frequency subband and low-frequency subband by LP, repeating until the requirements are met. However, because the contour wave transform needs up and downsampling in the decomposition process, it does not have translation invariance. To overcome this problem, Non-subsampled directional filter bank (NSDFB) and Non-subsampled pyramid (non-subsampled pyramid) are used in Non-subsampled contour wave transformation. Among them, NSP decomposes the image at multi-scale, while NSDFB decomposes the high-frequency subband coefficients generated by NSP decomposition in multi-direction.
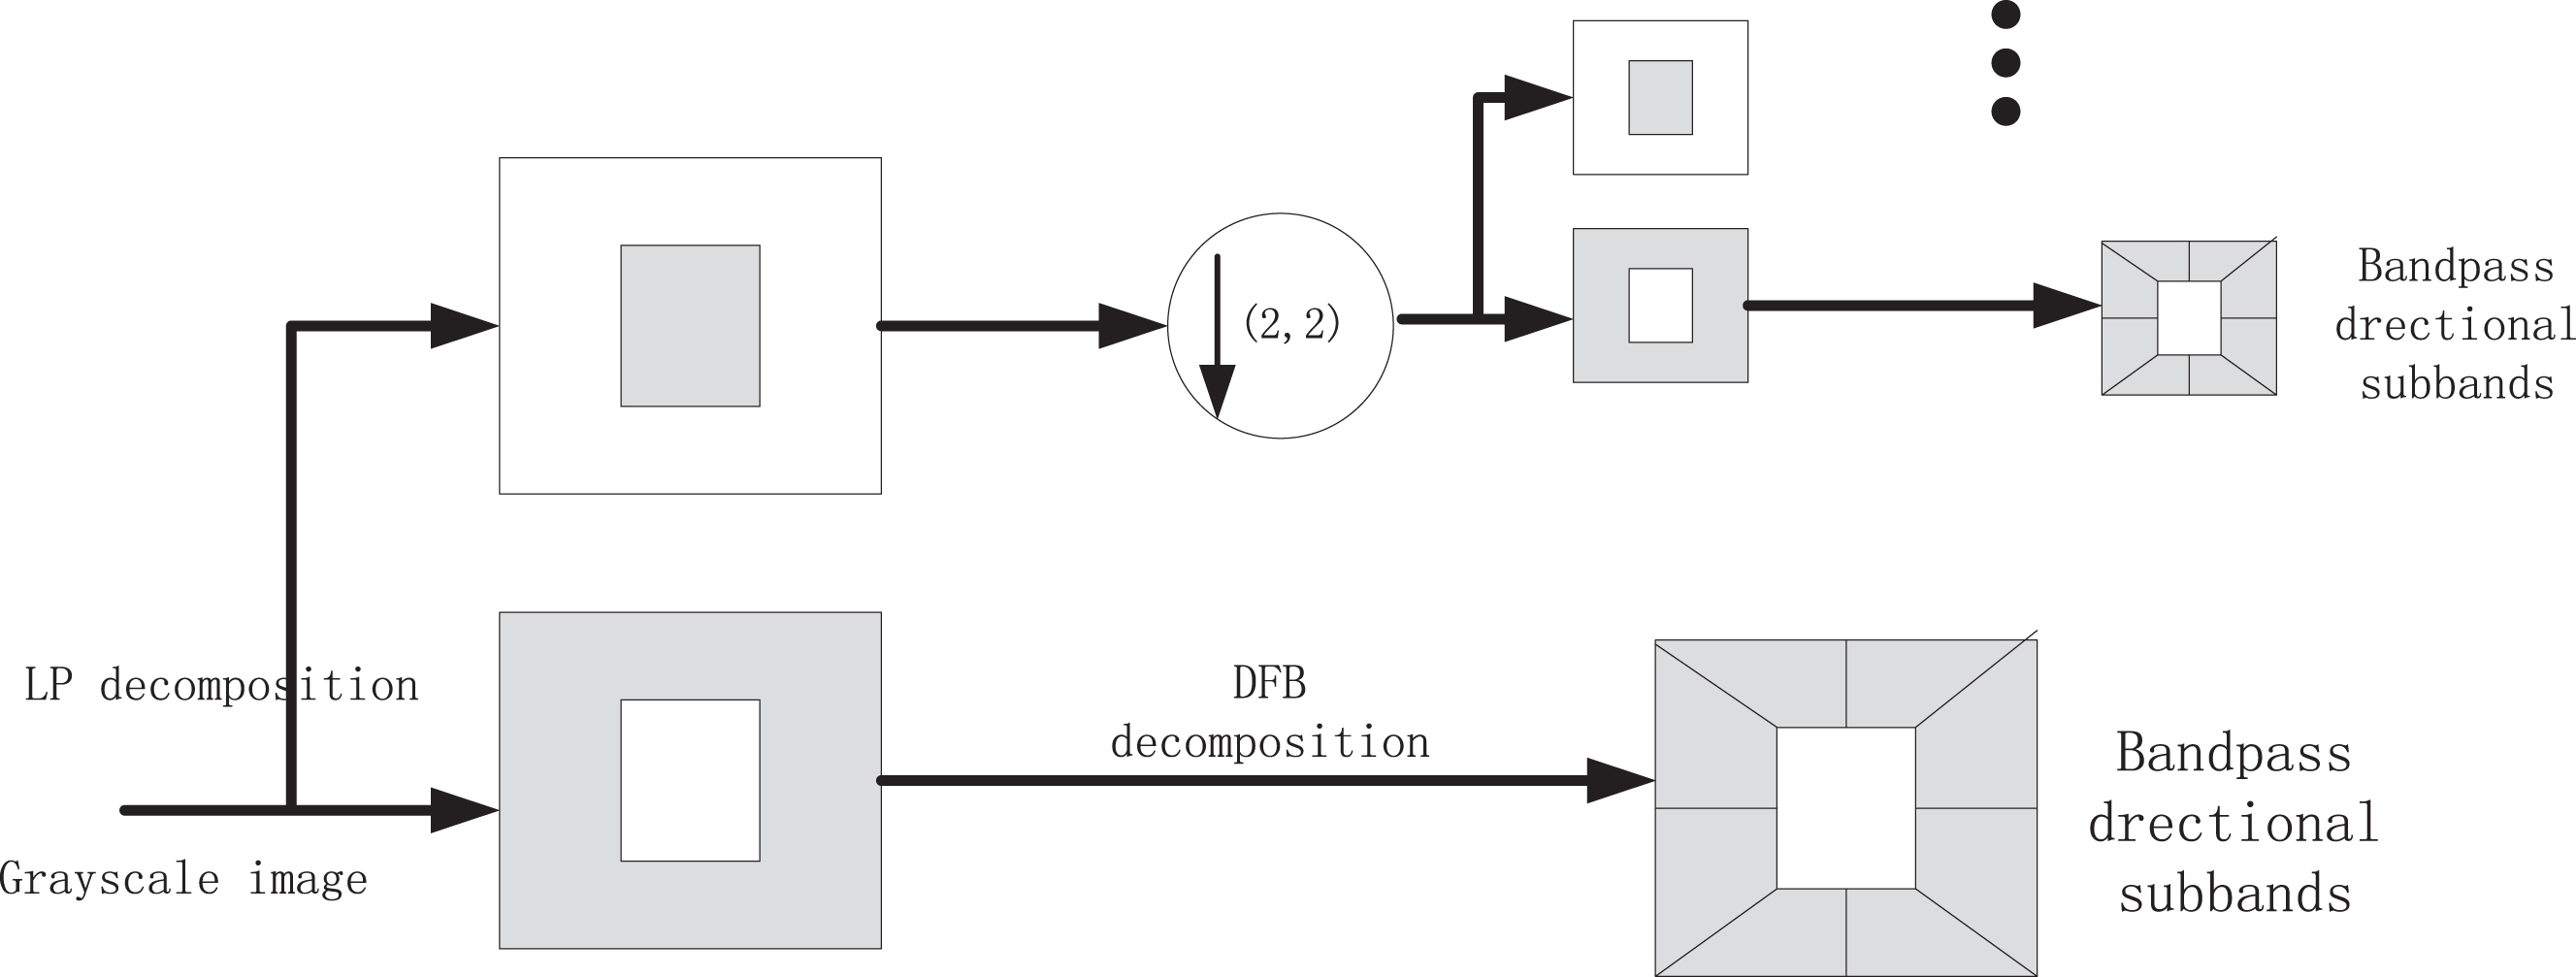
Structure diagram of Contourlet transform filter bank.
Because the low-frequency subband can reflect the average and approximate characteristics of time-frequency image, this paper calculates the mean and standard deviation of the low-frequency subband to understand the blurred contour information of the image. High-frequency sub-band can reflect the texture and edge of the time-frequency image, so the energy mean of each sub-band is extracted as the feature. The formula for calculating the mean value is:
The formula for standard deviation is:
Among them, x ij represents the coefficients of the low-frequency sub-band. M × N is the size of the sub-band matrix, μwhich is the mean value.
The formula for calculating the energy of each sub-band is:
In the formula, K is the K high-frequency sub-band below a certain level, which x
ij
represents the coefficients of the K high-frequency sub-band. In this paper, the wavelet time-frequency image is transformed into a gray-scale image, and then the sub-band size obtained by decomposition of non-down sampling contour transform is consistent with the original image. To extract texture features of the time-frequency image better, the gray level of time-frequency image is decomposed into three scales by NSP. The high-frequency sub-band obtained by NSDFB is decomposed into 6, 12 and 18 directions respectively. Therefore, the average energy
2) LBP algorithm
The basic idea of the LBP operator [16] is shown in Fig. 4.
The gray value of the center pixel is 7, and there are 8 pixels around it. According to the definition of LBP operator, if the gray value of the surrounding pixel is less than 7, the location of the pixel is marked as 0, otherwise it is marked as 1. Therefore, the center pixel gets a binary combination of 00010000 and decimal to 16. Finally, the gray value of the center pixel is positioned 16.
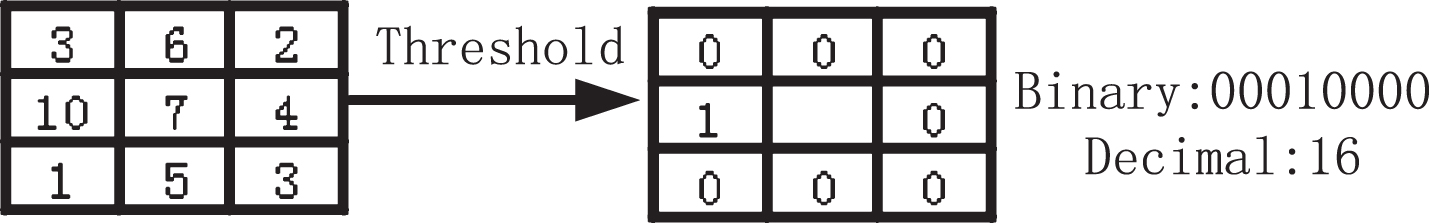
The operation process of LBP operator.
Therefore, the LBP eigenvalue is:
But when the number of pixels in the neighborhood set increases, the number of corresponding binary modes will increase greatly. Therefore, we need to reduce the dimension of the LBP operator. So some researchers have proposed LBP operators with rotation invariance [14]. The formula is:
In the formula,
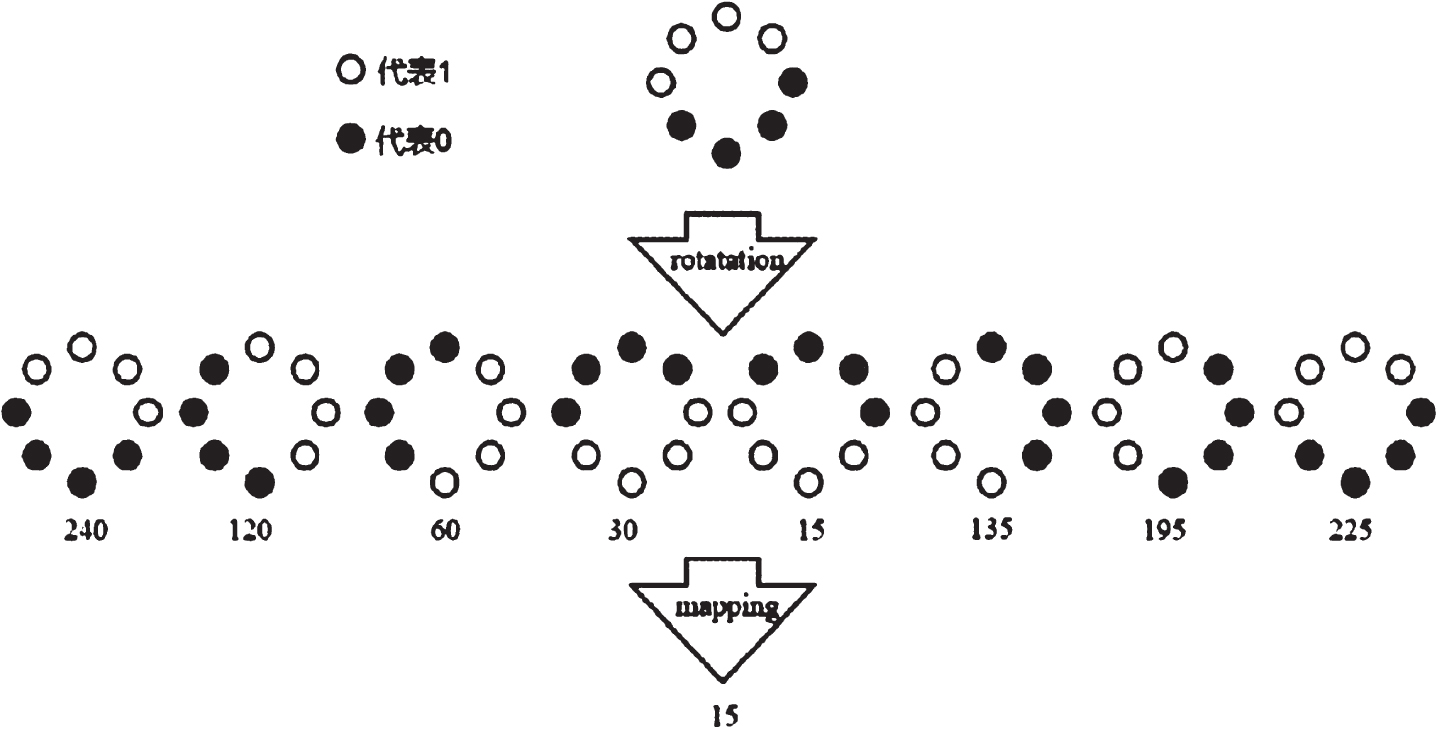
LBP diagram of rotation invariantt.
Therefore, the process of extracting feature vectors using LBP is roughly as follows: dividing time-frequency gray image into several small areas ->calculating the LBP ->calculating the frequency statistical histogram of the pixels in each area ->integrating the statistical histogram of each area to get the LBP feature vectors. In this paper, the time-frequency gray image (512*512) is divided into 16 blocks, each of which is 512*32 pixels in size. Then the LBP operator rotation invariant equivalent mode is calculated for each block and the histogram of each block is calculated. The dimension of each region histogram obtained is 10. After each region histogram is connected, an LBP characteristic statistic vector F2: with a dimension of 80 is obtained.
The eigenvectors of the two methods are combined to get the final eigenvector F.
In this paper, support vector machines are used. the mechanical working state is divided into three categories: normal operation, mild fault and severe fault state. For training samples (x1, y1) ,. . . (x m , y m ), of mechanical faults, among them, x i ∈ R n , y i ∈ {-1, 0, 1}, and y i = -1 represents severe faults, y i = 0 represents light faults, y i = 1 indicating the normal state of the machine, m is the total number of samples, n is the total number of characteristic parameters. The fault classification process based on a support vector machine is [17]:
Choose the appropriate penalty parameter C and the kernel function, and solve the optimal classification function according to the training samples.
Input feature parameters to the SVM recognition model and identify fault categories.
Experimental platform
Experimental platform
In this paper, the failure data of rolling bearings provided by Case Western Reserve University in the United States are used to verify the effectiveness of the proposed method. The experimental platform [18–20] mainly includes 2 horsepower AC drive motor, torque sensor, torque motor and motor controller. Electric spark has made different degrees of malfunction on the inner ring, outer ring and rolling body of rolling bearing. The sampling frequency of the signal is set to 12 000 Hz. The speed range of the driving motor is 1797 rpm to 1720 rpm. The corresponding load range of the torque motor is 0 to 3 horsepower. The experimental data cover different operation conditions, different fault types and different fault severity. each state data is divided into 60 sets of data, and each group has about 6 cycles. In each state, 40 sets of data are taken as training samples, and the remaining 20 sets of data are taken as test samples.
Selection of parameters
In this paper, the time-frequency image is acquired by processing the vibration signal in the running state with the wavelet transform, and then the fault feature of the time-frequency image is extracted by combining the non-down sampling contour wave transform with the local binary mode. Finally, the mechanical fault is identified by SVM classification. The main parameters to be set are:
When the time-frequency grayscale is used for contourlet transform, the decomposition coefficient is 3, and the direction of each layer is 6, 12, 18 respectively.
The radius of the local two value mode and the number of sampling points are (1, 8).
Multi-class Support Vector Machine (MSVM) uses the Gauss Kernel function to search the best parameters of the Gauss Kernel by cross-validation method. The average of three separate classification results is taken as the final value of each classification.
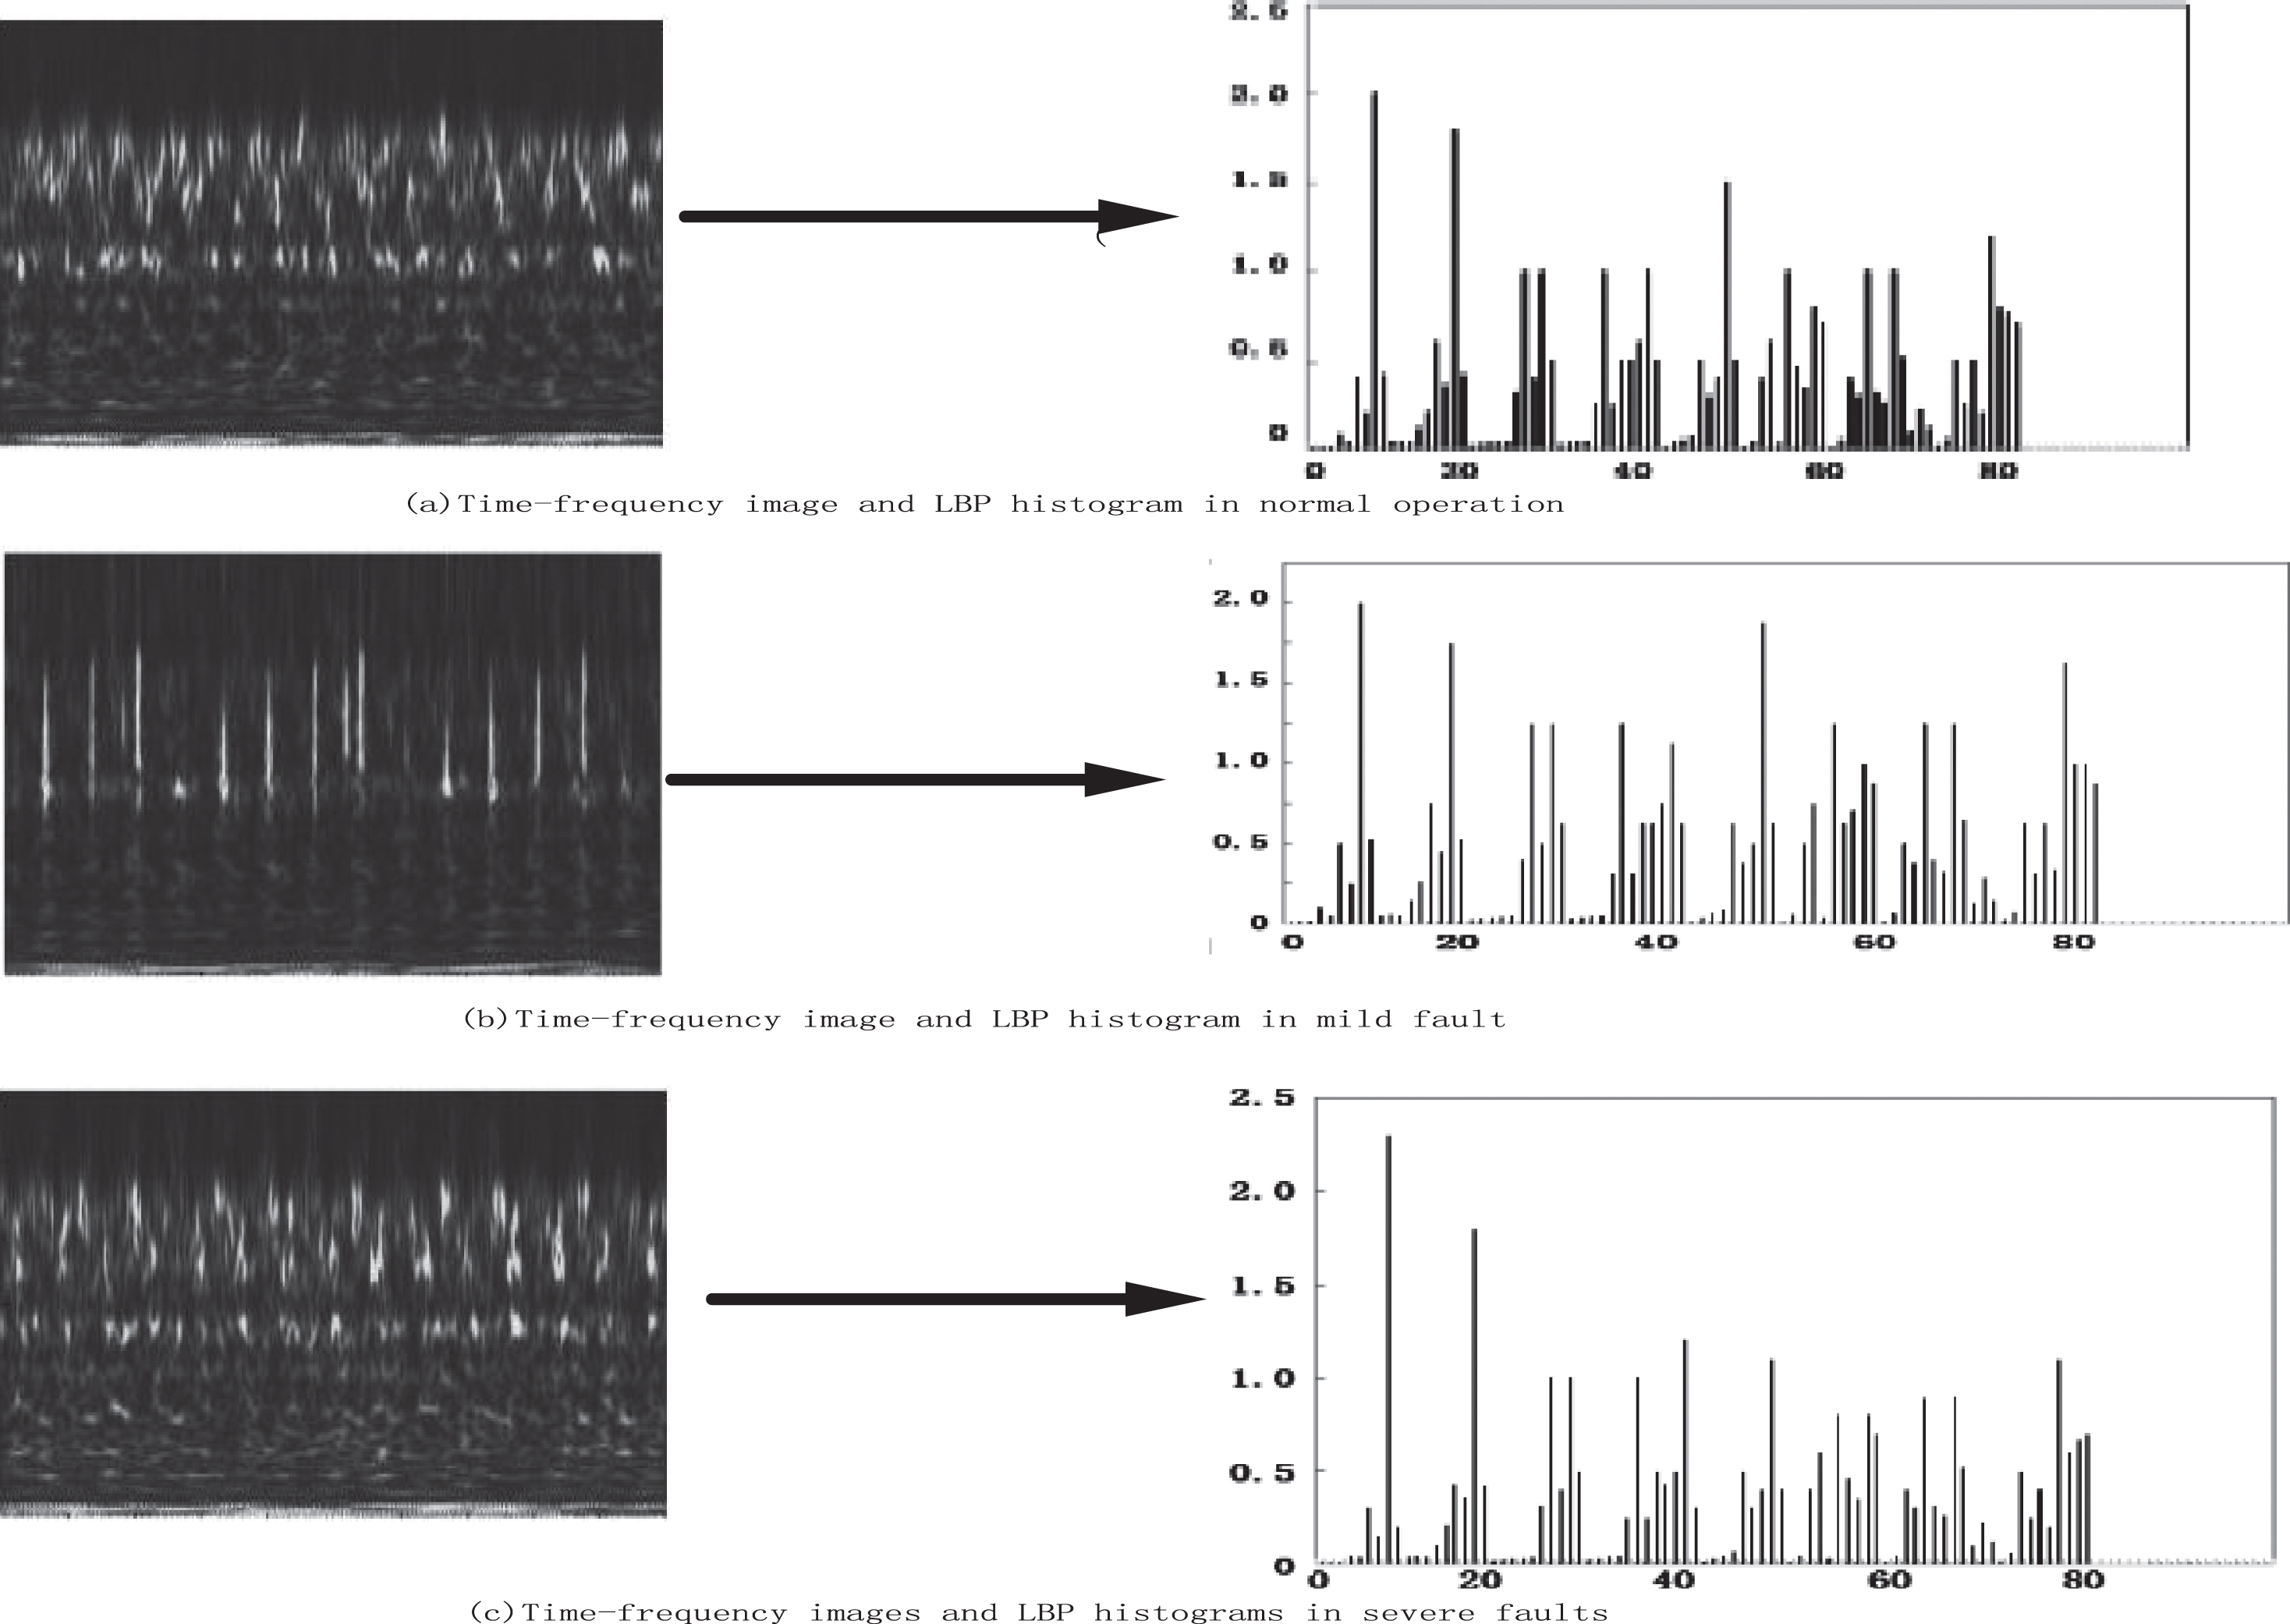
Time frequency grayscale and LBP histogram under three different categories.
1) Analysis of time-frequency grayscale and LBP histogram results
Figure 6 is the time-frequency grayscale and LBP histogram under three different categories. Signals are transformed into corresponding time-frequency images by wavelet transform, and then transformed into corresponding gray-scale images by gray-scale transformation. Then, the final statistical histogram is obtained by calculating and counting with the LBP operator after non-down sampling contour wave transformation. It can be seen from the graph that there are differences in histograms under different categories. This shows that the texture feature extraction of the time-frequency image used in this paper can be used as an effective feature parameter for fault classification.
SVM pattern discriminating output results
SVM pattern discriminating output results
2) Output analysis of SVM model
In the experiment, 40 groups of data were taken as training samples in each state, and the remaining 20 groups of data were taken as test samples. The results of classification are shown in Table 2. The test samples of the normal state and severe fault state are correctly identified, and only one case of a slight fault state is misjudged as a severe fault state. Therefore, its classification accuracy is 98.33%.
Comparison of classification results of different methods
3) The comparison between the method proposed in this paper and the results of other methods.
To validate the effectiveness of the proposed method, this paper compares the proposed method with traditional and frequency domain analysis methods, different time-frequency image acquisition methods and different texture feature extraction methods. Among them, using traditional feature extraction methods, the classification accuracy of time domain and frequency domain features can reach 97.57%; the classification accuracy based on energy features is 96.32%; using ST image texture features + SVM classification rate is relatively low, 95.41%, and the stability of features is poor. In contrast, the accuracy and stability of texture features extracted from time-frequency images using non-down sampling contour wave transform + LBP feature extraction are better.
At present, there are many studies on the detection of rotating machinery faults. In this paper, the time-frequency analysis method is used to further study the mechanical faults. The main works in this paper are: This paper describes the whole process based on time-frequency image processing. Firstly, the vibration signal is processed by a wavelet transform. First, the time-frequency diagram is obtained by wavelet transform, and then the feature of the time-frequency image is extracted. Finally, the classification algorithm is used to establish a model for image classification and recognition. In the aspect of feature extraction of time-frequency image, this paper proposes a method of fault feature extraction of time-frequency image by combining non-down sampling contour wave transform and local binary mode LBP. This method can not only extract the global texture signal features of the image, but also extract the local texture information features effectively. Finally, the validity of the proposed feature extraction method is verified by simulation data. The results show that the classification accuracy of this method can reach 98.33%. It can effectively classify time-frequency images and detect equipment faults.
Funding
This work was supported by Chongqing Industry Common Key Technology Innovation Project. “Research on Key Technology and Engineering Application of Centrifugal Upstream Pump in 1000 MW Nuclear Power Station” (No. cstc2017zdcy-zdyf0169) and The Science and Technology Project Affiliated to the Education Department of Chongqing Municipality. (No. KJ1600517) and the Natural Science Foundation of Shandong Province (No. ZR2015FL007).