
Abstract
Energy is an indispensable material resource for human production and life. It is a powerful engine and an important guarantee for human survival, economic and social sustainable development and world change. The economy is developing rapidly, the demand for energy continues to grow, energy consumption has increased sharply in a short period, and the security of energy supply and demand has also shown a severe trend. Predicting energy demand is especially important. However, due to the many influencing factors and the lack of energy data, the energy demand prediction has great uncertainty in the prediction results. Because of the above problems, this paper proposes an energy big data demand prediction model based on a fuzzy rough set model. Firstly, according to the data, the factors affecting the energy demand are determined, and the fuzzy C-means clustering algorithm is used to discretize the data according to the characteristics of the fuzzy rough set. Then the decision table is established and the attribute importance is calculated, and then the neighborhood rough set is used for attribute reduction. Then extract the correlation rules to establish a prediction model. Compare the prediction model proposed in this paper with the existing gray prediction method and energy elasticity coefficient method. The results show that this method can more scientifically predict the changes in energy big data demand. Finally, based on the experimental results, the corresponding strategies for optimizing the energy structure are proposed to provide reference for the optimization and development of energy demand.
Introduction and literature review
The international political and economic environment is becoming more and more complex. To maintain steady and rapid economic growth in this environment, it is inseparable from the long-term stable supply of energy [1]. Ensuring national energy security is a strategic issue related to the development and progress of the entire country [2]. In China’s energy consumption, coal is the main source of energy. Nowadays, due to environmental issues, governments around the world are promoting sustainable development and low-carbon emission reduction economic models. Most of the existing world energy reserves are in the hands of governments in developed countries. The above reasons have led to a surge in investment demand of energy suppliers [3, 4]. Energy such as oil plays an increasingly important role in the world economy. To adapt to the development and management of the social economy, it is necessary to forecast the demand for energy big data, to provide more accurate reference results for the complex energy market environment and situation [5].
Many experts and scholars have done a lot of research on the field of demand forecasting. Foreign scholars’ research on demand forecasting in many fields is fruitful. Arias M B and Bae S [6] used South Korea’s historical traffic data and weather data to classify the traffic patterns and cluster the decision trees to establish a classification standard, thus constructing a method based on big data technology. Predictive models are to show the different charging loads of electric vehicles in residential and commercial locations. In the short-term air passenger demand forecast, Kim S and Shin D H [7] used the big data and basic regression analysis in the search engine query to construct a prediction model for predicting the number of passengers at Incheon International Airport in South Korea. See-To Eric W K et al. [8] analyzed customer reviews to establish short-term demand allocation and sales forecasting models to help managers make better decisions in supply chain operations. Perea R G et al. [9] used the dynamic artificial neural network architecture and genetic algorithm for short-term prediction of daily irrigation water demand on the Bemb
From the above, domestic and foreign experts and scholars have made great achievements in the research of demand forecasting models, and there are not many studies on energy demand forecasting. However, the predictions of the existing various types of prediction models are not good, mainly in: (1) In the medium and long-term prediction, the prediction results are highly biased with time; (2) The actual influencing factors are not fully considered, and the constructed prediction model cannot flexibly correct the prediction results. (3) The fusion of information sources is not enough, ignoring the role of big data in the prediction model.
The fuzzy rough set was proposed by Dubois and Prade in 1990 and is a model that combines fuzzy sets with coarse sugar set theory [20]. The fuzzy coarse sugar set theory plays a key role in dealing with uncertainties, inaccurate data, and incomplete data. Fuzzy rough sets have been applied in many fields. Xie Song et al. [21] applied fuzzy rough sets to transformer oil-paper insulation state evaluation, which provided a new idea for transformer oil-paper insulation state evaluation and has practical value in engineering applications. Zhang Chao et al. [22] applied fuzzy rough sets to multi-attribute decision-making problems such as occupational assessment, and used the advantages of fuzzy sets and rough sets in uncertain decision-making to provide valuable decision-making models for decision-makers. Guo Rongchao et al. [23] used the fuzzy rough set model in the multi-label classification task, and the classification effect was good through feature selection. Xiao Bai et al. [24] applied fuzzy rough sets to space load forecasting to accurately characterize the unbalanced and uncoordinated load development. It shows that the method is practical and effective. Cao Yuyuan [25] combines fuzzy rough sets with support vector machines for aero-engine fault diagnosis. This method shows strong diagnostic ability and greatly shortens the calculation time without affecting the diagnosis rate. In summary, the application of fuzzy rough sets in data mining is extensive, especially in the processing of uncertain, incomplete and fuzzy information problems. Therefore, consider the application of the reduced fuzzy rough set to the demand forecast of energy big data.
This paper proposes an energy big data demand prediction model under the fuzzy rough set model. First, based on the China Statistical Yearbook from 1992 to 2018, the China Energy Big Data Report, and the China Energy Statistics Yearbook, the factors affecting energy demand are determined. According to the characteristics of fuzzy rough sets, the fuzzy C-means clustering algorithm is used to discretize the data. Then the decision table is established and the attribute importance is calculated, and the neighborhood rough set is used for attribute reduction. Next, extract the correlation rules to establish a prediction model. To verify the validity of the prediction model proposed in this paper, the method is compared with the grey prediction method and the elastic coefficient method. Comparing the predicted results with the energy historical data, the results show that the prediction accuracy of this method is as high as 99%, and the prediction results are relatively stable. Finally, based on the prediction results of coal, oil and natural gas, the corresponding strategies for optimizing the energy structure are proposed to provide reference for the optimization and development of energy demand.
Forecast model and method for energy big data demand based on fuzzy rough set model
Energy demand prediction theory
The prediction of energy demand refers to scientific and reasonable prediction of energy demand in the coming period. Under the guidance of scientific and reasonable forecasting methods, based on comprehensive consideration of the factors affecting energy demand, the data of past energy consumption and related influencing factors are mined and analyzed to find out the relationship and general development rules among the data. The energy demand prediction has the following characteristics: Energy demand prediction needs to proceed from the perspective of meeting the normal and stable development of the national economy and society, and cannot be carried out unilaterally from the industry itself or in certain aspects. The inaccuracy of the results. The consumption demand for energy will be affected by many factors.
The prediction step of the energy demand can be performed according to the flow shown in Fig. 1.
Basic theory of fuzzy rough sets

Energy demand prediction steps.
In the Pawlak rough set model, not all classical sets A in the universe U can be accurately described by the knowledge in the knowledge base (U, R). Then use A’s (U, R) one. Describe the lower and upper approximations. But in real life, many concepts are often fuzzy and inaccurate. This problem is explained by the fuzzy rough set theory.
Where [x]R represents an equivalence class containing x, and
The establishment process of energy big data demand prediction model based on fuzzy rough set mainly includes: determining energy influencing factors, establishing decision table and calculating attribute importance, data discretization, attribute reduction and rule generation.
Selection of energy impact factors
The demand for energy is affected by many factors. According to the China Energy Big Data Report (2018) and other energy-related data, factors such as gross national product, industrial structure, household income, science and technology, investment, final consumption, total exports, heavy industry, and the urban population will affect energy demand to varying degrees. Therefore, this paper selects the factors influencing the model of energy big data demand, such as energy consumption, gross domestic product, industrial structure, residence income, science and technology, investment, final consumption expenditure, total export, heavy industry ratio, and urban population.
Discretization
Rough set theory is easy to handle discrete data. In this paper, FCM (fuzzy C-means clustering) is used to discretize continuous data.
(1) Membership function
The membership function is a function that indicates the degree to which an object x belongs to the set A, and is usually denoted as μA(x). The argument range is all objects that may belong to the set A (that is, all the points in the space where the set is located), and the value range is [0, 1], that is, 0≤μA (x)≤1. μA(x)=1 means that x is completely affiliated with set A, which is equivalent to x ∈ A on the traditional set concept.
(2) Fuzzy C-means clustering (FCM)
The fuzzy C-means clustering algorithm is partitioning-based. Its idea is to make the similarity between objects divided into the same cluster the largest, and the similarity between different clusters to be the smallest. FCM is a clustering algorithm that uses membership to determine the extent to which each data point belongs to a certain cluster. FCM divides n vectors xi(i= 1,2, ... n) into c fuzzy groups, and finds the cluster center of each group, so that the value function of the non-similarity index is minimized. Specific steps are as follows:
Step 1: Initialize the membership matrix U with a random number whose value is between 0 and 1. Rule: The sum of the memberships of the data set is always equal to 1.
Step 2: Calculate c cluster centers ci, i = 1, ⋯ , c using the formula
Step 3: Calculate the value function according to
Step 4: Calculate the new matrix U according to
Establish decision tables and calculate attribute importance
In the data of this paper, energy consumption, gross domestic product, industrial structure, residence income, science and technology, investment, final consumption expenditure, total export, Heavy industry ratio, and urban population, all come from China Statistical Yearbook, China Energy Big Data Report and China Energy Statistics Yearbook. The period is from 1992 to 2018. To find out the influence law of various influencing factors on energy demand, this paper takes each decade as a research object, and the periods are 1992– 2001, 1997– 2006, 2002– 2011, 2007– 2016, 2012– 2018, respectively. Dividing data by period can dynamically reflect the impact of different factors on energy demand in different periods.
The basic tool for expressing and processing knowledge in rough set theory is the information table. Decision tables are a special and important knowledge expression system and a special information table. It indicates how decisions should be made when certain conditions are met. The data discretization is characterized by the FCM algorithm, and a decision table is established. The rows of the table correspond to the objects of the study, or tuples. The column corresponds to the attribute of the object, and the information of the object is represented by the value of each attribute of the specified object. The decision attribute of the decision table is energy consumption (Q); Condition attributes are gross domestic product (GDP), industrial structure (IS), residence income (RI), science and technology (ST), investment (INV), final consumption expenditure (FCE), total export (TE), Heavy industry ratio (HIR), and urban population (UP). The information entropy method is used to find the attribute importance.
Attribute reduction
The purpose of attribute reduction is to eliminate those attributes that are not important and have little effect on the experimental results. Based on the neighborhood rough set reduction algorithm, the steps are as follows:
Step 1: input decision system NDS=(U, A⋃D), input the obtained neighborhood radius set and the appropriate lower limit of importance;
Step 2: initializing the reduced set red to an empty set red=φ; taking the whole sample as the initialization state of the sample set, the formula is expressed as smp = U;
Step 3: to remove all the attributes ai remaining in the set of reduction sets, you need to find its positive domain, that is
Step 4: Compare all the found positive domains to find the largest positive Pos k (D).
Step 5: Compare the importance obtained at this time with the lower limit of the importance set at the beginning. If the importance obtained is greater than the lower limit, the reduction result can be directly output, and the algorithm ends here; Otherwise, you need to record the k value, and red = red+ak, S = S-Posk, then return to Step 3 to loop until the algorithm ends.
Establishment of the demand prediction model
(1) Extract correlation rules
The basic correlation rule set is obtained from the reduced sample data:
Among them, A[x], B[y] respectively represent the factor variation characteristics and economic indicators change characteristics of the equivalence classes [x] ∈ U/R c and [y] ∈ U/R d . If the relevant rules are deterministic, the factor characteristics completely determine the characteristics of the economic indicators. Each basic correlation rule has a certain degree of confidence, and the confidence is defined as:
Attribute importance of condition variables relative to decision variables in each period
Attribute importance of condition variables relative to decision variables in each period
By definition:
1) When P (A[x] → B[y]) =1, it means that A[x] → B[y] is a deterministic rule, that is, when the factor characteristic of the object u is A[x], the economic indicator d is B[y];
2) When P (A[x] → B[y]) =0, it means that the rule A[x] → B[y] is not established, that is, when the factor characteristic of the object u is A[x], the economic indicator d is not B[y];
3) When 0 < P (A[x] → B[y]) <1, it indicates that A[x] → B[y] is an uncertainty rule. When the factor characteristic of object u is A[x], the economic indicator d is B[y] and the confidence is P (A[x] → B[y]).
(2) Building prediction model
The influencing factor value c1,T, c2,T, ⋯ , cm,T of the prediction period T is characterized, the corresponding object is assumed to be uT, the equivalence class under the knowledge system U/Rc is [xT], the feature description is A[x
T
], and the eigenvalue is still represented by c1,T, c2,T, ⋯ , cm,T, ie A[x
T
] = (c1,T, c2,T, ⋯ , cm,T)
T
. The prediction principle of the economic indicator d of uT is to predict the dT by using the comprehensive information of the economic indicator change pattern corresponding to the rule of the highest credibility of the uT. To do this, we need to define the credibility of the object uT and the rule r, assuming any r ∈ L, r : A[x] → B[y],
The set of all the r* corresponding factor characteristics satisfying the above formula is M*, then the prediction model of
Data source
The data used in this paper are from the China Statistical Yearbook from 1992 to 2018, the China Energy Big Data Report and the China Energy Statistics Yearbook. The data includes: energy consumption, gross domestic product, industrial structure, residence income, science and technology, investment, final consumption expenditure, total export, Heavy industry ratio, and urban population, etc.
Model evaluation
The energy big data demand forecasting model based on the fuzzy rough set model proposed in this paper is designed and implemented on an ordinary PC. The relative error and accuracy are used to evaluate the prediction results of the prediction model on historical data.
Relative error:
Accuracy:
Comparison of the demand forecasting model
Comparison of prediction errors of each method (10,000 tons)
Comparison of prediction errors of each method (10,000 tons)
Result 1: attribute importance
The known conditional attributes are gross domestic product (GDP), industrial structure (IS), residence income (RI), science and technology (ST), investment (INV), final consumption expenditure (FCE), total export (TE), Heavy industry ratio (HIR), and urban population (UP). The importance of the above conditional attributes relative to the decision attribute energy consumption (Q) is obtained, as shown in Table 1.
To visually show the difference of each variable, according to the importance of each condition attribute during 1992– 2018, the radar chart is drawn as shown in Fig. 2.
It can be seen from Table 1 and Fig. 2 that by analyzing all the sample data from 1992 to 2018, the conditional attributes are ranked from large to small according to the importance of the decision variables: HIR, GDP, UP, RI, ST, IS, INV, FCE, TE. The attribute importance index reflects the dependence of energy consumption on various influencing factors. The proportion of heavy industry ratio (HIR) and gross national product (GDP) have the greatest impact on energy consumption. The importance of science and technology (ST) and industrial structure (IS) also reached 0.058 and 0.057, respectively. As for investment (INV), final consumption expenditure (FCE) and total export value (TE), the impact on energy consumption is less than that of other conditional attributes.
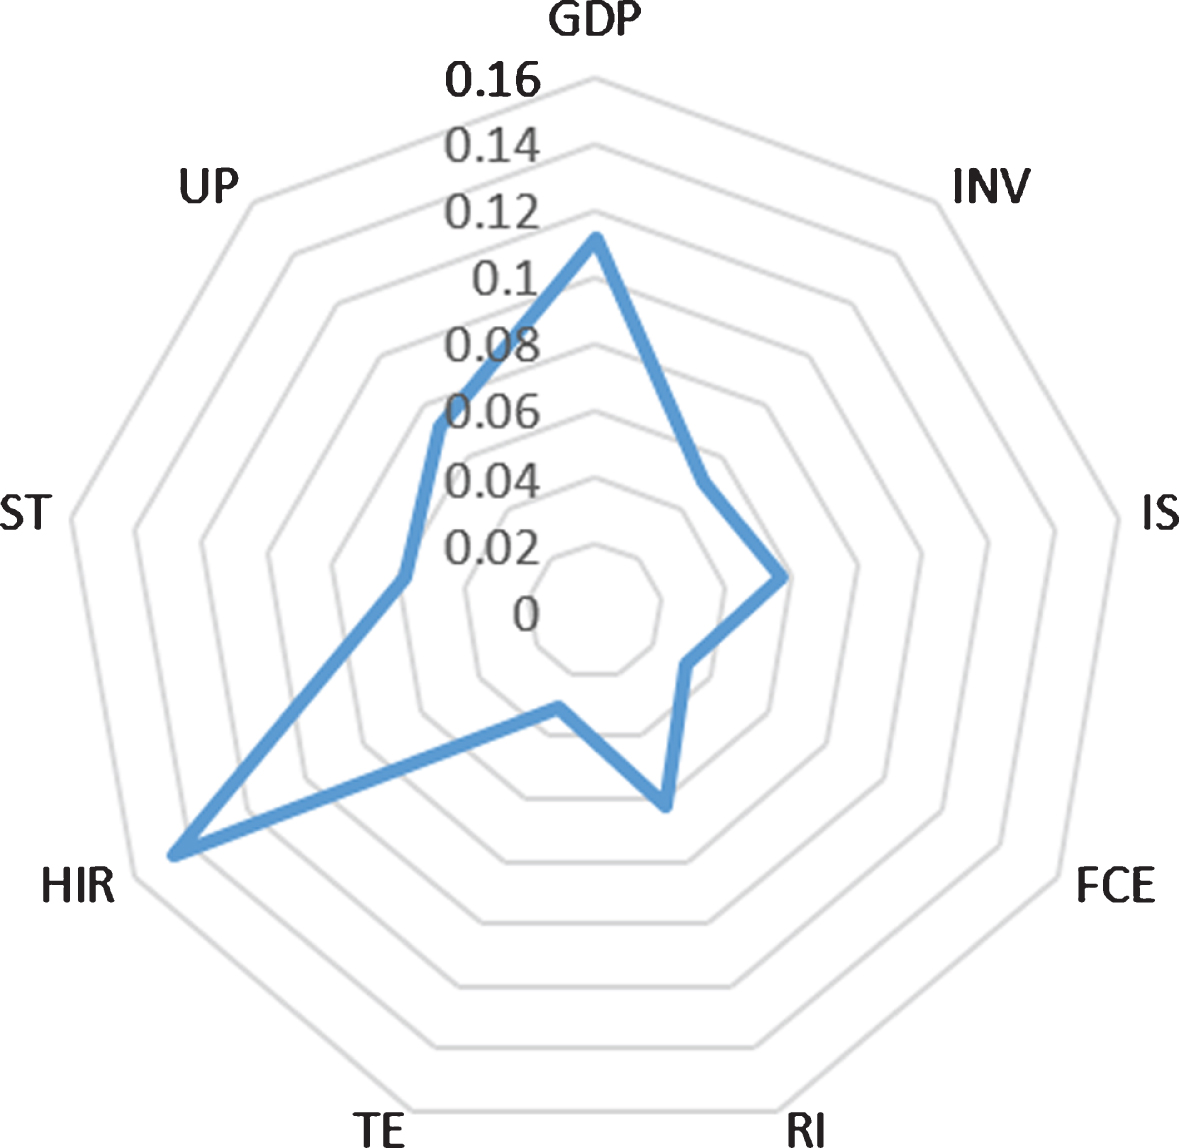
Attribute importance radar chart.
Result 2: Comparison of prediction accuracy of each method
To verify the validity of the prediction model, the historical energy data of the five years from 2010 to 2014 are compared with the predicted values. The method proposed in this paper is compared with the gray prediction method and the elastic coefficient method. Taking coal prediction as an example, the forecast situation is shown in Table 2.
To further observe the difference between the data predicted by each method and the actual data, the T-test is performed on the above-predicted data and the existing historical data, and the T-test value is shown in Table 3.
Prediction of Coal consumption.
It can be seen from Table 2 that the prediction accuracy of the proposed method is as high as 99% or more. The grey prediction method performed poorly on the energy prediction results, with an average accuracy of 93.636%, while the elastic coefficient method had an average prediction accuracy of 97.062%. In Table 3, by comparing the obtained prediction data with the original historical data, the T value of the predicted data and the original data in this method is the smallest, which is 0.0268, indicating that the results obtained by this method are more consistent with the actual situation. The gray prediction method has the lowest average precision and the largest T value. The reason for the analysis is that the gray prediction method uses the fitting idea and is suitable for prediction with certain data characteristics. Energy big data demand prediction is affected by many factors. The energy demand prediction model based on the fuzzy rough set proposed in this paper plays a key role in dealing with uncertainties, inaccurate data, missing data, etc., and thus obtains better prediction results.
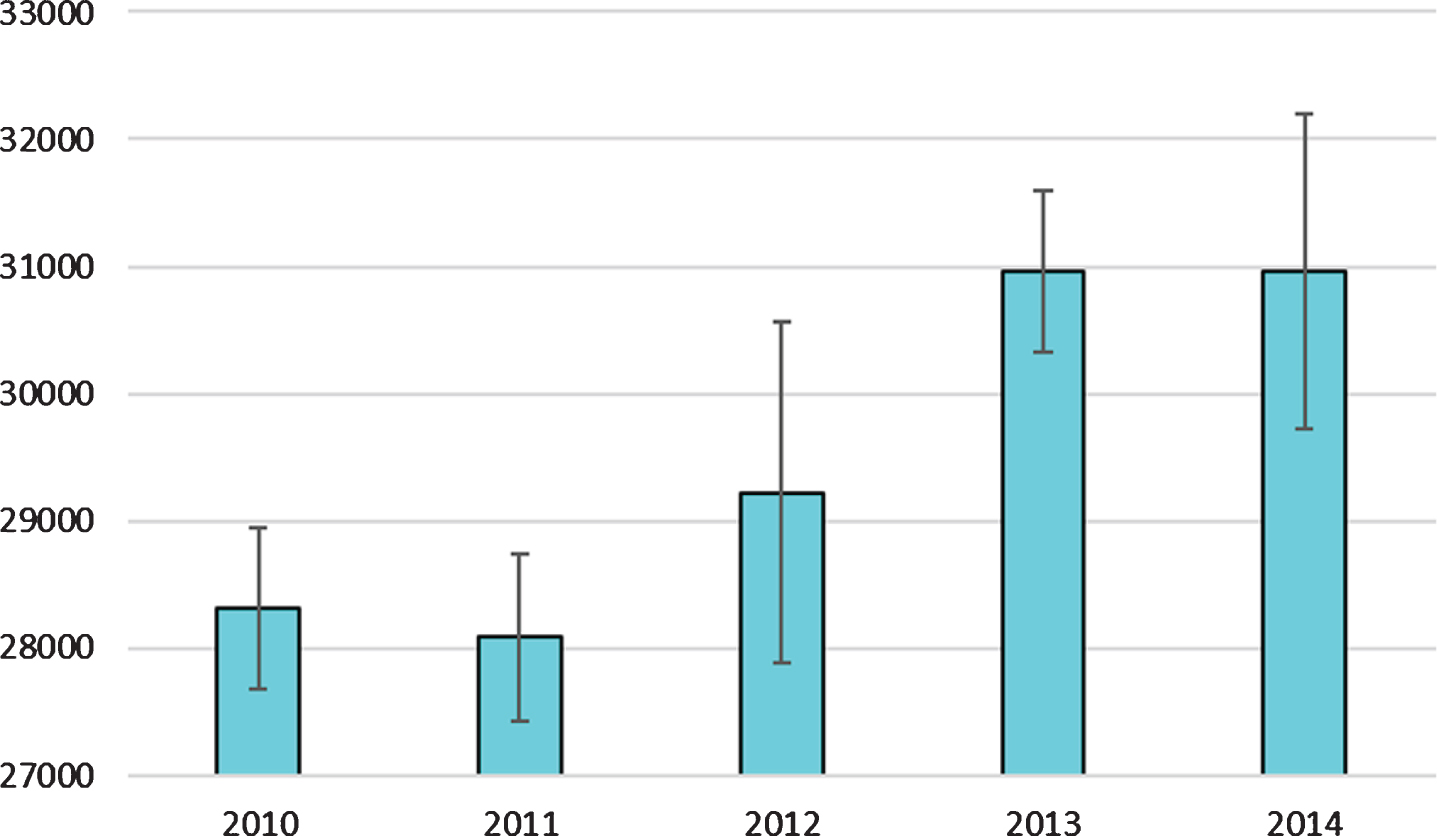
The gray prediction method, the elastic coefficient method and the mean-variance of the prediction data of coal energy in this paper are shown in Fig. 3. As can be seen from the Fig., the demand for coal shows an upward trend with time.
Result 3: Comparison of the method in this paper on various types of energy prediction.
Technology development has an impact on energy supply and demand, so the baseline scenario and the high-tech factor scenario (high scenario) are set. The baseline scenario (base) simulates a low-power alternative where all technical factors are zeroed. The high scenario (high) is the case where the simulated electric energy replacement technology develops effective energy replacement for fossil energy on the demand side. The technical factors of coal, oil and natural gas consumption in the high scenario are set to 3%, 2%, and 1%, respectively, and characterize the degree of development of alternative technologies for electrical energy in different fields. In this paper, there is no major policy adjustment in the future, and the policy factors of the two are set to 0.1% and 0.1% respectively. Since China will be in the stage of energy structure adjustment for a long time, the structural adjustment factors for coal, oil and natural gas are set at 4%, 0.2% and 0.1% respectively. The prediction results of the method in coal, oil and natural gas are shown in Figs. 4, 5 and 6.
T-test results

Mean-variance of the predicted values of the three methods in different years.

Prediction of oil consumption.
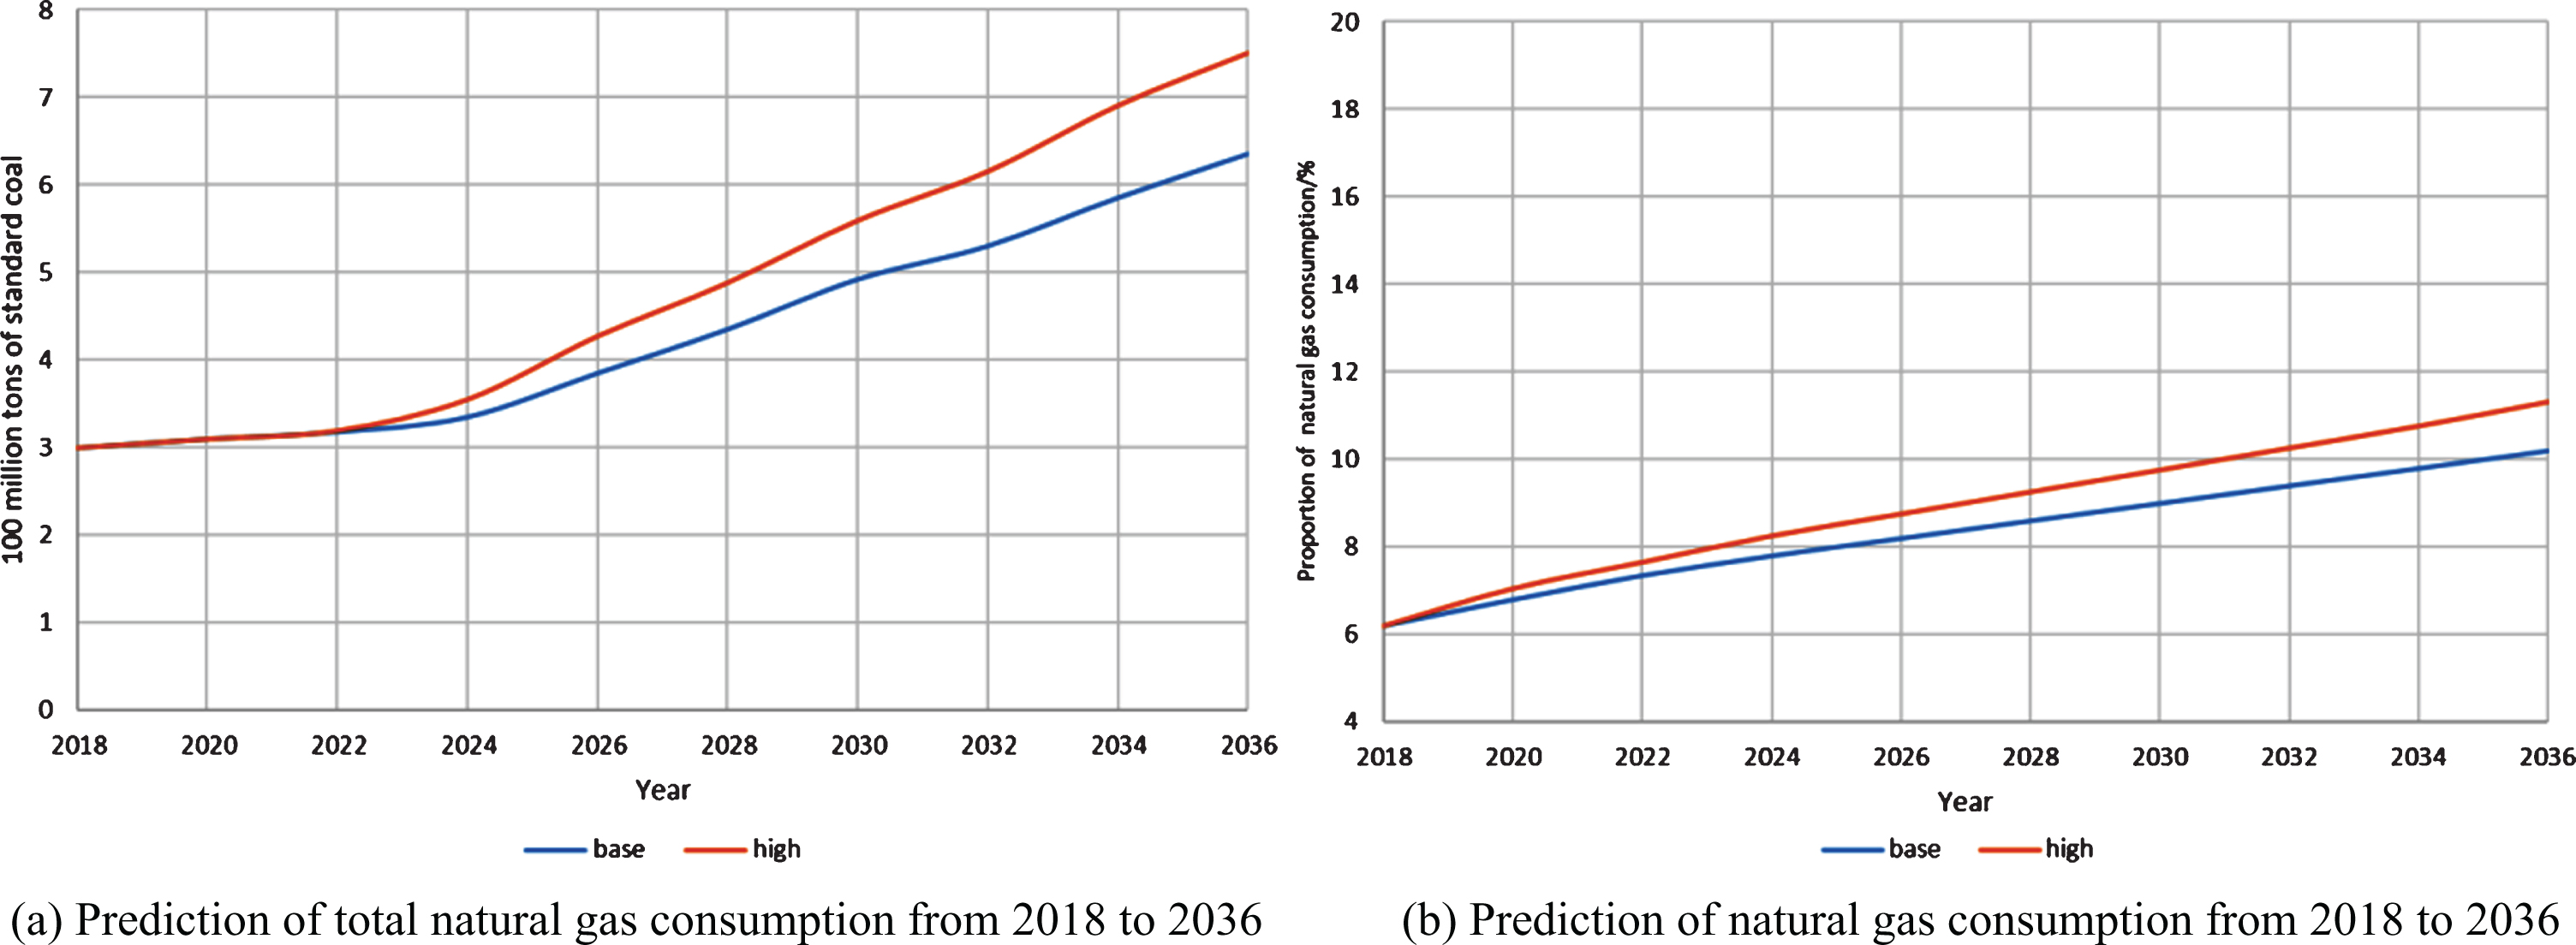
Forecast of natural gas consumption.
As can be seen from Fig. 4, coal consumption still dominates China’s energy consumption in both scenarios. Under the baseline scenario, the total coal consumption will continue to rise by 2035, and the proportion of total coal consumption in primary energy consumption will slowly decrease. Under the high scenario, the total coal consumption will peak at around 2028 and then gradually decline. In the high scenario, coal consumption is always lower than the baseline scenario. As can be seen from Fig. 5, China’s oil consumption will increase steadily in the future, and it will be slightly lower than the baseline scenario in the high scenario. Under the baseline scenario, oil accounted for a slow increase in the proportion of primary energy consumption, while in the high scenario, it slowly declined. As can be seen from Fig. 6, the proportion of natural gas consumption and primary energy in China will increase rapidly in the future, and the high scenario is higher than the baseline scenario. The fossil energy structure has gradually shifted from coal to high-quality energy such as oil and gas. The issue of climate change has attracted much attention, and carbon dioxide emissions have become an important factor restricting the demand for energy production. According to the data, coal dioxide emissions are about 30% higher than oil and about 70% higher than natural gas, while providing the same amount of energy. In the future, China’s natural gas consumption will continue to maintain a relatively high growth rate, and the growth rate in the high scenario is higher than the baseline scenario. By 2036, the growth rate of natural gas consumption in the baseline scenario is 3.05%, and the growth rate of natural gas consumption in the high scenario is 4.45%. This means that China’s demand for natural gas will continue to grow.
The relative error of the fuzzy rough set based prediction model proposed in this paper is within the acceptable range. By comparing with the gray prediction method and the elastic coefficient method in energy prediction, the experimental results show that the prediction method proposed in this paper has achieved very high precision. Energy demand is affected by many uncertain factors. There is an extremely complex nonlinear correlation between energy consumption indicators and influencing factors, which is difficult to accurately represent with an analytical mathematical model. The fuzzy rough set based prediction method starts from the data and reduces the redundant information without losing information, and finds the influence relationship between the energy prediction index and the explanatory variable, and simultaneously deals with qualitative, quantitative factors and uncertain factors.
In terms of coal, oil and natural gas forecasts, although the demand for coal and oil is increasing, the growth rate has slowed down, while the demand for natural gas has increased significantly. This is because the energy structure in the later period of the country is transforming. Coal and oil are non-clean sources of energy and produce carbon dioxide that exacerbates the greenhouse effect. Natural gas is a clean energy source, so its demand will continue to maintain a high growth rate. The vigorous development of clean energy is the trend of the times. We can promote power and energy, such as thermal power, hydropower, wind power and other large-scale development, to ensure the effective development of the renewable energy market.
Conclusions
Sustainable energy development is an important issue related to national economic and social development. Scientifically and reasonably predicting China’s energy supply and demand situation is of great significance for exploring China’s energy alternative path and promoting China’s energy strategy transformation. The medium and long term of energy demand is the focus and difficulty in the field of energy prediction in recent years. This paper establishes a model for predicting energy big data demand based on fuzzy rough set model, and hopes to explore the development path of China’s energy structure transformation and electric energy substitution through predicting future energy demand.
Footnotes
Acknowledgments
This work was supported by Yunnan Local Colleges Applied Basic Research Projects (No. 2018FH001-055) and Scientific Research Foundation of Yunnan Education Department (No. 2018JS477).