
Abstract
Most of the research on stressors is in the medical field, and there are few analysis of athletes’ stressors, so it can not provide reference for the analysis of athletes’ stressors. Based on this, this study combines machine learning algorithms to analyze the pressure source of athletes’ stadium. In terms of data collection, it is mainly obtained through questionnaire survey and interview form, and it is used as experimental data after passing the test. In order to improve the performance of the algorithm, this paper combines the known K-Means algorithm with the layering algorithm to form a new improved layered K-Means algorithm. At the same time, this paper analyzes the performance of the improved hierarchical K-Means algorithm through experimental comparison and compares the clustering results. In addition, the analysis system corresponding to the algorithm is constructed based on the actual situation, the algorithm is applied to practice, and the user preference model is constructed. Finally, this article helps athletes find stressors and find ways to reduce stressors through personalized recommendations. The research shows that the algorithm of this study is reliable and has certain practical effects and can provide theoretical reference for subsequent related research.
Introduction
The core of competitive sports is competition. Through long and arduous training, athletes can only gain recognition and reward if they perform well in the arena. In the past, athletes were characterized by strong physique and strong muscles. However, in the rapid development of competitive sports, the physiological functions of high-level athletes have become smaller and smaller, and the potential of sports ability has reached a certain limit. High-level athletes, coaches and sports research staff are aware that in a close match, the key to winning or losing depends on psychological factors. American scholar Grupo once said that “for the junior and intermediate athletes, 80% rely on biomechanical factors and 20% rely on psychological factors; while for advanced athletes, 80% rely on psychological factors and 20% rely on biomechanical factors [1]. Although the above viewpoints are not supported by empirical research, the intentions expressed by them are consistent with objective facts and verified by facts: High-level athletes need to have good psychological qualities in achieving athletic performance. The failure of high-level athletes as high-pressure groups in major events has occurred. Although the reasons for the loss are different, they are mostly caused by excessive pressure. Therefore, the psychological stress and coping situation of high-level athletes are increasingly concerned by researchers [2].
The pressure, technical and tactical ability and the athlete’s will are unified in the course of the game. Without pressure, the meaning of the game is lost; without good technical and tactical skills, the game loses competition and attracts the audience; without strong will, the athlete cannot show himself under high pressure and win the game [3]. For athletes, stress is power, technology and tactics are the foundation, and will quality is the soul, and these three processes are complementary, dialectical and unified [4].
Traditional psychological counseling is usually conducted through psychological professionals, or by giving some questionnaires to evaluate the psychological state of athletes. However, these methods are inefficient and do not provide counseling advice in a timely and effective manner. Moreover, by participating in the development of the “Sports Competition Pressure Management System” of the National Sports General Administration Research Day, it is learned that the current sports field competition stress counseling adopts this more traditional method [5]. Applying data mining related methods to psychological stress response can solve the problem of a large number of athletes and complex and varied psychological conditions, which can effectively solve the problem of stress response [6]. Therefore, this paper applies the clustering algorithm and content-based recommendation algorithm to the psychological analysis and recommendation of competition stress and gives the corresponding athletes’ stress coping strategies after clustering, which makes the athletes’ psychological condition in the face of stress improve, the athletes have more resistance to stress, and the psychological level of athletes suffering from setbacks and difficulties improved. In this context, this paper analyzes and mines the athletes’ psychological questionnaire evaluation data from the aspects of data mining and recommendation, and obtains valuable information, which is convenient for the assistant psychologist to make an effective psychological diagnosis.
Related work
According to the Dictionary of Psychology, the stressor refers to the threat that the individual feels after cognitive evaluation and the environmental stimulation of his physical and mental health. There are four main sources of stress: (1) physical stressors; (2) psychological stressors; (3) social stressors; and (4) cultural stressors. Physical stressors refer to environmental stimuli that cause damage to an individual’s body, including various physical and biological stimuli such as noise, bacteria, viruses, etc. [7]. Psychological stress refers to the conflicts and frustrations that individuals experience after cognitive evaluation, such as interpersonal conflicts and high returns. Social stressors refer to social life situations and events that affect individual lifestyles and require individuals to adapt and cope, such as poverty, political turmoil, and marital life disharmony [8]. Cultural stressors refer to the stimulation of life culture that requires individuals to adapt and cope, such as moving to a foreign country [9]. Li Hong (2004) believes that the source of stress is the internal and external stimulus that makes people feel nervous. Moreover, she divided the stressors into three categories: (1) life events; (2) daily annoyances; and (3) psychological distress. Life events refer to those non-continuous, clear starting and ending points, observable, and obvious life changes, and life events include active life events and negative life events (acute stressors), but usually only negative life events are highly correlated with psychological problems [10]. Daily annoyance mainly refers to chronic stressors, and daily annoyance can be divided into small troubles caused by life and long-term social events. Psychological distress can also be called a psychological stressor. It is an important source of stress caused by the inner psychological factors of the individual, such as personal psychological conflict, frustration of motivation or behavior, perfectionism and dissatisfaction with interpersonal relationships [11]. Greenberg pointed out that stressors are stimuli that may trigger war or escape reactions. He believes that stressors can be environmental (such as toxins, high temperatures, severe cold), psychological (such as threat of self-esteem, depression), social (unemployment, death of spouse) or philosophical (such as time utilization, life goals) [12].
After Cai Xiankou (1985) surveyed the work pressure of teachers in Taipei, he got the following factors that affected work pressure: relationship with school administrators, student learning, role aspect, workload, bad behavior of students, professional development of teachers. Xu Changjiang (1998) classified the occupational stress of middle school teachers into six dimensions: work factor, role in organization, career development, organizational structure and climate, student factors and test pressure. Among them, career development factors, test pressure and student factors are important reasons for teachers’ professional pressure Gray et al. used self-designed scales to find that nurses have seven main sources of stress: death of the patient, conflict with the doctor, lack of support, lack of knowledge, heavy workload, conflict with other nurses, and less understanding of the patient’s treatment. In terms of work stressors, in the stress study of white-collar workers, Cooper & Marshall (1978) divided the work stressors into the factors of the work itself, the roles in the organization, the relationship in the work, career development, organizational structure and organizational tendencies. Xu Xiaodong (2004) divided the work stressors into endogenous work stressors and exogenous work stressors in the study of knowledge workers’ work stress.
In the 1930s and 1940s, Cannon and Selye conducted pioneering research on the physiological and pathological reactions of stress on the basis of previous studies [13]. Cannon suggests that stress is the destruction of homeostasis under external influences [14]. Hans Selye [15] considers stress to be a reaction to a particular symptom caused by non-specific changes in any form of noxious stimuli in the physiological system. It includes three phases: alert response period, resistance period and exhaustion period. When people face stress, they are psychologically shocked and cause physical changes, which can enhance the body’s function and prepare to fight stress. For example, the ability to withstand stress, the sympathetic nerves are stimulated, the adrenal gland is increased, and the heartbeat is accelerated. If the pressure is too strong or lasts too long, the body will deplete its energy at some stage and will not be able to continue to resist the pressure. At this time, the individual will experience physical and mental failure and cause physical or psychological diseases [16]. Tan Xianming also studied this field and concluded that interpersonal relationships, sports injuries, game failures, environmental factors, life stress, internal and external pressures are the most important sources of stress for athletes [17]. Guo Yu’an and other researchers believe that the evaluation of Chinese athletes’ on-the-spot stress sources is mainly characterized by challenge evaluation (noisy crowd, opponent’s deception) and threat (sorrow, coach criticism) evaluation [18].
Theoretical basis of the algorithm
This section mainly introduces the specific algorithm ideas, advantages and disadvantages, and the improvements made by the predecessors of the K-Means algorithm and the condensed hierarchy algorithm in the partitioning algorithm. Moreover, we will improve the two specific algorithms in the future.
Introduction to convergence hierarchy algorithm and K-means algorithm
The typical K-means algorithm is simple, efficient, and very suitable for the partitioning of large sample data. The division process of the K-means algorithm is simple: First, the algorithm randomly selects k number of objects from the input object as the initial cluster center of the cluster. Then, according to the principle that the similarity between the objects in the cluster is large, and the object similarity between different clusters is small, the algorithm assigns the remaining objects to the corresponding clusters to form the new cluster. Then, by calculating the average of all the data in the new cluster as the new cluster center until there is no change in the cluster center or reaching a certain threshold. The specific process described is shown in Fig. 1 [19].
Schematic diagram of k-means algorithm.
K-means is a representative classical partitioning algorithm in which K is determined by artificial experience or minimizing objective function. Compared with the layered algorithm, the K-means algorithm is more efficient. However, the number of clusters K requires multiple iterations to determine, and usually the algorithm requires multiple experiments to compare errors to determine the final result, otherwise the results tend to fall into local optimum and fail to achieve global optimality. Moreover, when the exact value of K is determined over multiple iterations, the time complexity of the algorithm is correspondingly reduced. In order to solve these problems, L.F. Chen proposed a method called full-scale COPS, which is based on hierarchical clustering to determine the optimal number of clusters. In COPS, the optimal cluster number is constructed by constructing a clustering quality curve. However, the choice of parameters for such an algorithm affects the clustering results.
The K-Means algorithm has linear time complexity, but the clustering quality is not ideal. In order to improve the clustering effectiveness, c.R.Lin proposed a new CSM algorithm, and his proposed algorithm combines the K-Means algorithm with the layering algorithm. Although the CSM algorithm also has better efficiency, the K value cannot be determined in advance. SidLAMROUS introduced a measure function that uses contour coefficients as a hierarchical clustering. For each subtree node, the number of subtree clusters is determined by the contour coefficient. J.F.Lu proposes a method of initializing K-Means that uses a weighted hierarchy to reduce the sampled data set. His method can get a better clustering center and can extend the algorithm to high-dimensional data. However, the number of K still needs to be determined before clustering [20].
In order to solve the problem of cluster center quality and K determination, Chen proposed the H-K (Hierarchical K. mean) algorithm. In the algorithm, he first uses the condensed hierarchy algorithm and then improves the clustering quality through the K-Means algorithm. The specific idea of the algorithm is: First, the adjacent clusters are selected by the condensing hierarchy algorithm to merge. After merging, the average of the two clusters is calculated as the center of the new cluster. Thereafter, the above steps are repeated until the termination condition is reached, at which time the K value determined by the algorithm and the cluster center are used as initial conditions for the next K-means. Then, the K-means algorithm is respectively established in clusters at multiple levels to obtain different K values and initial centers, and the results of clustering of each level are evaluated. Then, the most appropriate K value and initial center are selected. Due to the use of hierarchical algorithms, the H-K algorithm still has a high time complexity. To solve this problem, W.C. proposed a method in which the number of clusters was determined using the contour coefficients [21].
When using clustering algorithm for data processing, it is more important to judge the quality of clustering. Therefore, clustering evaluation is also called cluster confirmation. Generally, for clustering algorithms, the criteria for judging are divided into the following cases: One is to identify whether there are non-random structures or noise data in the data; The second is the determination of the number of clusters; The third is to determine the quality of the cluster analysis results, and the degree of compact separation and so on; The fourth is to compare the clustering results with the known results. The first three are unsupervised assessments and the last one is supervised assessments. Clusters are generally evaluated using metrics of the classification model, and commonly used metrics include entropy, accuracy, recall, and value. Several clustering evaluation criteria are described below.
Contour coefficients
The contour factor is a method for interpreting and verifying clustering results. This technique was first proposed by Peter.J.Rousseeuw in 1986. It can represent the pros and cons of each object in the dataset in its cluster in the form of a simple image. The method assumes that the data can be formed using some sort of clustering method, and the data has been divided into clusters of K numbers. For any data object i, a (i) represents the average degree of dissimilarity between object i with other objects in the same cluster. That is, it indicates the degree of good and bad that the object i is assigned to the current cluster. The more similar i is to the current cluster, the more appropriate it is for the object i to be assigned to the current cluster. The definition formula of a (i) is as follows [22]:
b (i) represents the minimum average value of distance of object i to other clusters (clusters not assigned by i), that is, the distance of object i to the nearest neighbor cluster of the cluster in which it resides. Because if object i is not effectively allocated, then the best cluster it should allocate should be the neighbor closest to the currently assigned cluster. The definition of b (i) is as follows [23]:
Then, the contour factor can be defined as the following formula:
Or, it is written as follows:
It can be obtained from the formula that s (i) takes [- 1, 1]. When a (i) < b (i), because a (i) represents the degree of similarity between i and the objects in the cluster, the smaller a (i) is, the better i is allocated. However, the larger b (i) is, the worse the i is assigned to the neighbor cluster. When s (i) is close to l, it means that the overall distribution of the data set is better; When s (i) is close to 1, it means that object i is at the edge of two clusters; When s (i) is close to -1, it means that the object i is different from the cluster object, and the cluster quality of the object i is poor. On the data set, the average of s (i) is used to assess the goodness and the badness of the clustering results. For example, when using the K-Means algorithm for clustering, if the selected K value is too large or too small, the s (i) value obtained will be significantly different. Therefore, the contour coefficient can be used as a cluster of selected data sets. Therefore, the contour coefficients can be used as a reference for selecting the number of clusters in the data set [24].
The average of the overall cluster is calculated by the overall similarity:
Among them, c i represents the cluster center of cluster i, and x is any object in cluster c i . dist (x, c i ) represents the distance of the object from the center of the cluster c i , and m i is the number of objects in the cluster i. The similarity function is used to calculate the tightness within the cluster. The smaller the value, the tighter the cluster.
Similar to the similarity, the Clustering overall has a standard clustering measure function to measure the overall situation of the cluster using the mean square error. Moreover, K-means is to adjust J to a minimum.
Among them, x ij represents any one of the data objects in cluster i, and c i represents the cluster center of cluster i. The significance of using evaluation criteria is that the interior of the cluster can be compacted as much as possible, and the different classes can be separated as much as possible.
For the sports competition pressure source data, the amount of data is small, and the data features are many. If the K-Means algorithm is used alone, the experiment is not satisfactory when the experiment is done in the early stage, and there is no good discrimination. Therefore, when the cause analysis is carried out, considering the small amount of data and the more data dimensions may affect the clustering results, this paper considers the improvement of the algorithm according to the characteristics of the sports competition pressure source data.
In order to obtain better initial center and time complexity, this paper proposes an improved hierarchical K-Means algorithm for the shortcomings of traditional hierarchical K-Means algorithm. The algorithm assumes that x is {x1, x2, ⋯ , x n }, which is the R-dimensional space of n numbers. For the problem that the K value needs to be determined in advance, the algorithm first uses the contour coefficients to determine the approximate number of clusters. After using hierarchical clustering to achieve this level, the number of clusters and the initial center of the iteration are locally adjusted. Thus, for clusters with more layers, the amount of computation is greatly saved. In addition, when the initial center is locally adjusted, the algorithm uses the evaluation criterion of intra-class similarity to decompose the cluster with the smallest similarity within the class into two new clusters. In this way, it can locally adjust clusters that are not aggregated but misclassified and make the selection of the initial center more rational, and also convenient for calculation.
Algorithm step [25]:
Step 1: The raw data is processed, and the contour coefficient is calculated using the formula. When the value is the largest, this value is taken as the initial value;
Step 2: The condensed hierarchical clustering algorithm is used to merge two adjacent clusters to form a new cluster;
Step 3: The average of the cluster center of the merged cluster and the average of the two cluster cores of the previous layer are calculated;
Step 4: Step 2, 3 is repeated until the number of clusters reaches (K - R) (0 ≤ R ≤ K - 2).(If K = 2, then R = 0);
Step 5: The intra-cluster similarity of all the divided clusters is calculated separately;
Step 6: The cluster with the smallest similarity in the cluster is selected, that is, the cluster with the largest radius of the class. After that, the cluster is decomposed to find the sample point xi1 farthest from the center c i z of the class, and then the sample point xi2 which is the farthest from the distance xi1 in the class is selected.
Step 7: These two points xi1, xi2 and other cluster centers are re-do K-means clustering as a new cluster center.
Step 8: If the centroid changes, the algorithm returns to step 6; otherwise, the algorithm ends, and the result is output.
It can be seen that steps 1 to 4 use hierarchical clustering algorithm to hierarchically cluster the original data. Moreover, steps 5 to 6 are based on K-Means clustering, re-selecting the number of clusters according to the number of clusters calculated by the previous hierarchical clustering algorithm, and the initial clustering center of the K-means algorithm is selected according to hierarchical clustering. At the same time, steps 7 and 8 are performed by the K-Means algorithm for secondary clustering.
The improvement of this algorithm is: Due to the small amount of data of small samples, the direct execution of K-Means by the algorithm will lead to large errors, which is not conducive to analysis and judgment. Therefore, this paper combines the advantages of hierarchical clustering with K-Means to take clusters. The initial clustering center of the K-means algorithm is no longer randomly selected but is determined based on the operation of the pre-step hierarchical clustering. The algorithm selects the cluster with the lowest cluster similarity for decomposition, which fully reduces the computation time. Since the number of competition stress sources is small sample data for the sports competition pressure data that we are about to cluster, the improved algorithm can better improve the clustering effect and obtain more effective clustering results, and the complexity is not high, which is easy to implement and operate.
Algorithm model verification
In order to verify the effectiveness of the improved algorithm, Iris data, Breast Cancer data and Abalone data in the UCI database were selected for verification. The number of data sets and the number of features is shown in the following table.
In order to compare the performance of the algorithm, the above-mentioned data downloaded from the UCI website is clustered, and the K-means algorithm and the improved H-K algorithm are respectively used for clustering. The results of the clustering were compared in terms of operational efficiency and degree of aggregation, respectively. Table 2 and Fig. 2 of the CPU runtime comparison are shown below.
Data list
Data list
Comparison table of CPU operation time

Comparison of running time.
As can be seen from the above figure, as the number of data sets increases, the apparent degree of CPU runtime increases significantly, and the computational time of the improved hierarchical K-Means clustering algorithm is gradually increased compared with the traditional K-Means, and the increasing range is gradually obvious. This is because the improved algorithm uses the contour coefficients to predict the value of k in advance, and only performs small-scale optimization near the K value, which effectively reduces the time complexity of the algorithm.
Through the questionnaire, various data collection is carried out, and on this basis, the model data is analyzed by the research model. According to the improved algorithm, it can be known that after the data is cleaned and converted, cluster analysis is performed. First, the approximate number of clusters K is calculated using the contour coefficients. Figure 3 is a graph showing the value of the contour coefficient (re) when K is between 2 and 100. It can be seen from Fig. 3 that the contour coefficient value is the largest when the number of clusters is 2. This means that the number of clusters is better at 2, but this is not the final result. After that, we can first cluster with the hierarchical clustering algorithm, and according to the improved algorithm, calculate the initial clustering center of the next K-means, which is convenient for subsequent calculation.

Line of contour coefficients.
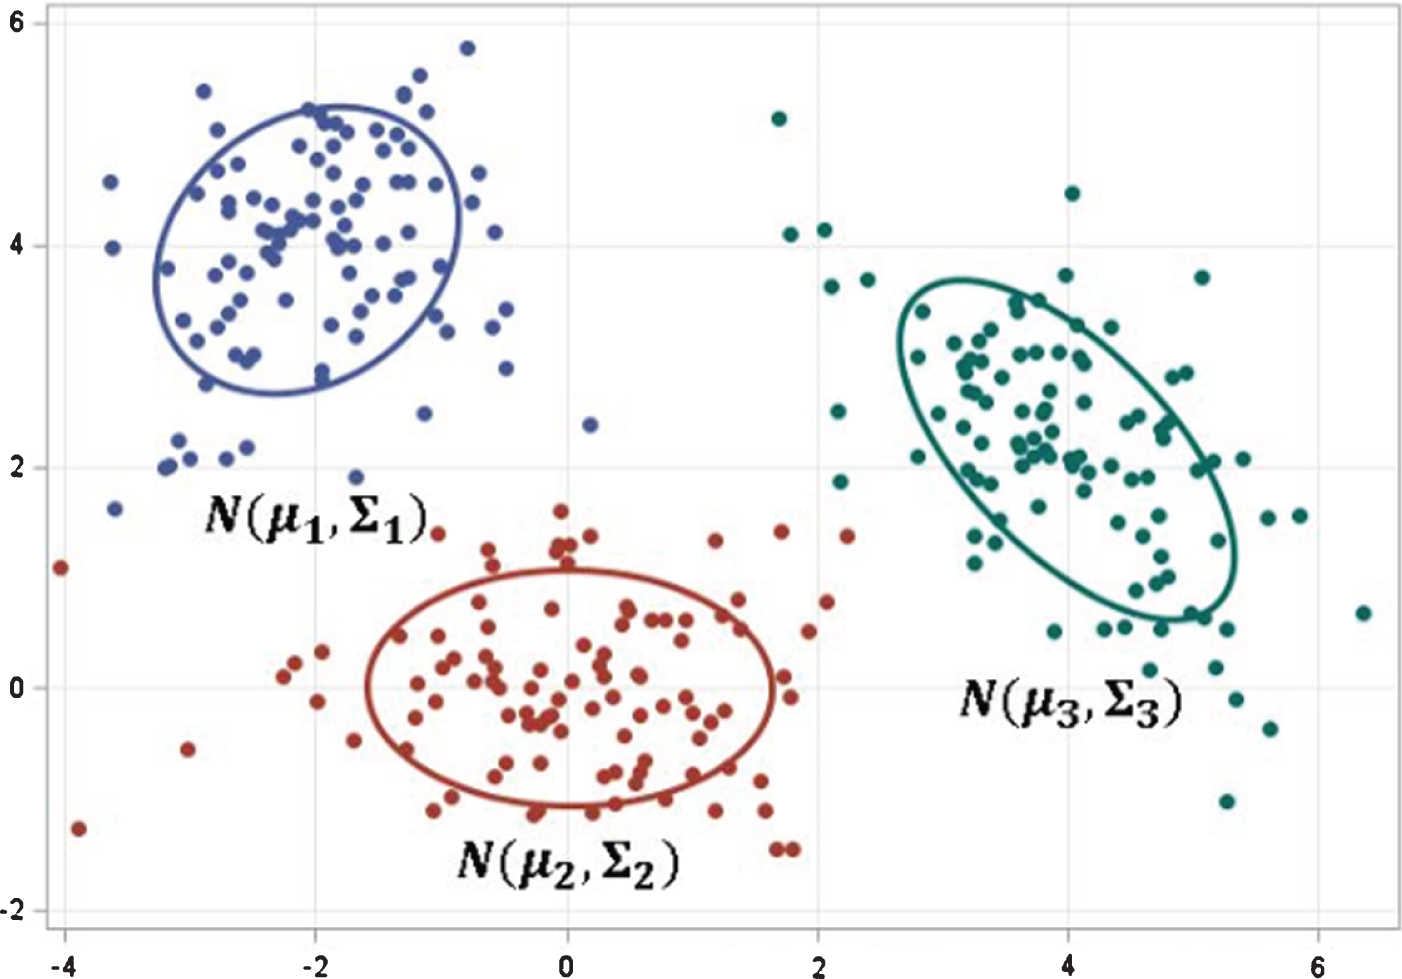
Further, based on this, it is determined that the hierarchical data clustering algorithm is used for the experimental data, and the two types are clustered. Then, according to the improved algorithm, two types of average cluster centers are divided as the initial cluster centers of K-means clusters. The improved hierarchical K-Means algorithm is used to cluster the datasets, and 22 dimensions such as competition pressure source, social support and athlete burnout are clustered, and the final cluster center is shown in Table 3 and Fig. 4.
Cluster center

Distribution map of improved hierarchical clustering algorithm in sports competition pressure data.
As can be seen from Fig. 4, the first category accounts for the most (black); the second category is second (red), and the third category is the least (green). The overall similarity between the first category and the second category is relatively large, and only some attributes are different. However, the third category has a small percentage, but it is significantly different from the first and second categories. This means that the athletes in this group have a poor psychological level (the overall score is low, indicating that the pressure source is not consistent, and the pressure is small).
On the whole, among the three types of athletes, the first type of athletes may belong to the “seed” type of players. Their overall sports quality is high, and their efforts and physical fitness are good, but the investment is not high enough and needs more encouragement; The second type of athletes, which are slightly lower than the first category, may be moderate “hardworking” athletes, and only have problems in certain subtleties, such as: high burnout. It shows that these athletes are usually hard-working and easy to form a burden, but because they are not qualified athletes, they have a lower sense of achievement and the lowest social support. At the same time, it shows that the second type of athletes are prone to form an anxiety mentality that is “inferior to the above, but more than the next”; The third category of athletes accounted for a small proportion, which is the most stressful type. They have a poor mentality in many aspects. Although they have a high level of enthusiasm for sports, they may not be as good as the first two types of athletes, so they are prone to burnout and even easily question and resist training. In addition, the third category of athletes may not be as good as the first two categories in large-scale events, which leads to some pressure on such athletes. They may be more eager to prove themselves, or to have extreme emotions that completely contradict sports. Although this proportion is small, it requires the coach to pay more attention to it, and to help the athletes develop mentally. In summary, for “seed” type players, more encouragement is required to keep them in good working condition; for “hardworking” athletes, encouragement and social support in information can be given to improve their sense of accomplishment, and avoiding excessive training can lead to unnecessary harm; For the last type of over-stressed athletes, the coaches should help them to resolve the reasons, set the goals of the movements reasonably, and also guide the mentality to prevent psychological negative emotions.
The content-based filtering recommendation algorithm is one of the earliest recommended techniques, which can better solve the sparsity and other problems in traditional collaborative filtering recommendation. In this section, the algorithm based on content recommendation is applied to the stress response strategy of sports competition and attempts to recommend competition pressure related strategies to athletes from the aspect of recommendation algorithm.
The key to the text recommendation system based on content filtering is the feature extraction of the document to be recommended (ie, the vector representation of the document), the user’s interest vector representation, and the similarity calculation.
The structural diagram of the recommended system constructed in this study is shown in Fig. 5.
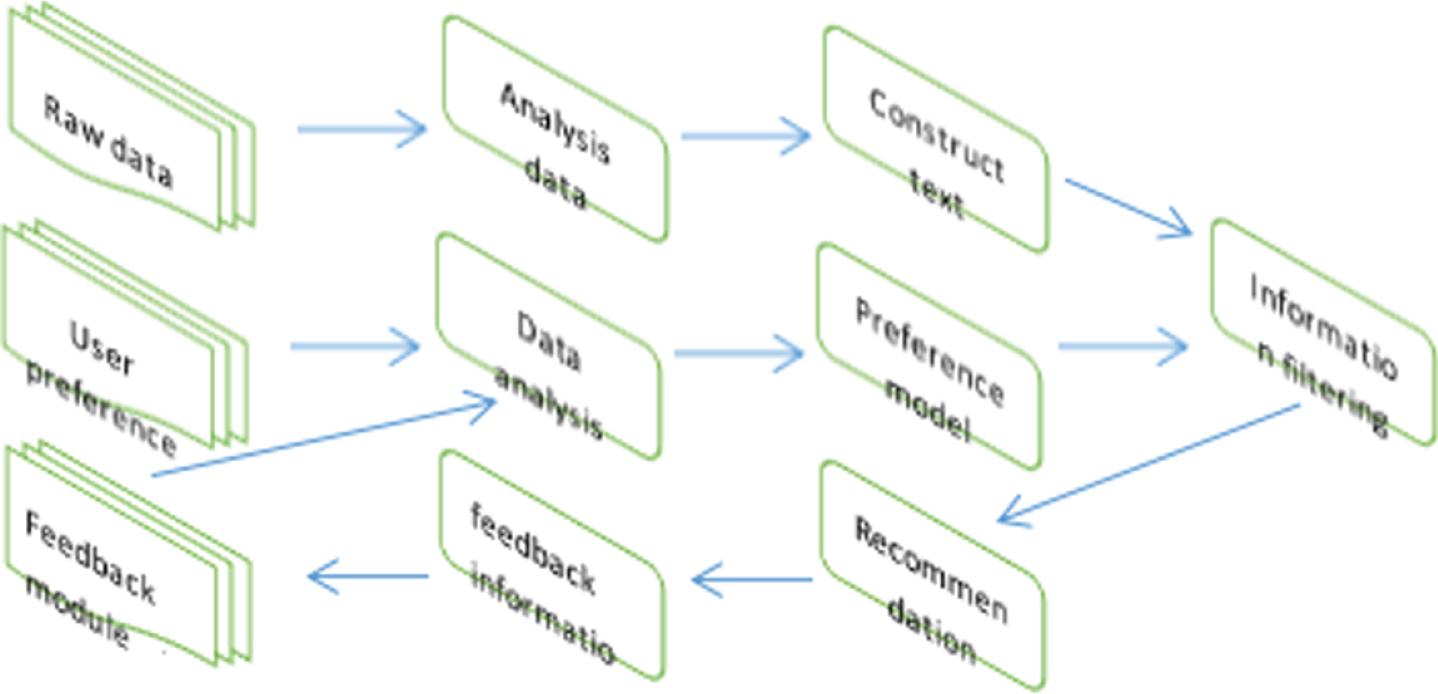
Recommended system structure diagram.
As shown in Fig. 5, the process of generating recommendations relies mainly on three components: (1) Content Analysis Module: It extracts valid user data information from the original data set and represents it in a certain form. For example, the news content is represented as a keyword vector, which is an input portion of the file learning module and the filtering module.
(2) Analysis module of user preference: The module collects data of user preferences and generates user preference information. Usually, it uses machine learning methods (such as: clustering algorithm, Bayesian algorithm, nearest neighbor method, etc.) or user-defined methods to acquire a user’s long-term preference and short-term preference from commodity information that the user likes and dislikes before and establishes a user’s preference information vector.
(3) Filter module: Through the user summary information and the similarity measure, the potential similarity information description or text content is obtained, thereby filtering the invalid information of the user, and recommending the valid information not viewed by the user to the user. It mainly uses the cosine similarity of the user preference information vector and the commodity information vector. In general, the advantages of content-based recommendations are: It can make corresponding recommendation according to the user preference generated by the user history information, which facilitates us to effectively utilize the user information generated by the previous clustering to form a user preference model. Because content-based recommendations do not use user ratings, content-based recommendation systems may not be plagued by user item scoring matrix sparsity issues. The homepage of the sports competition stress response strategy is a textual counseling suggestion, which is not suitable for user use, and is very suitable for text recommendation. By listing the content characteristics of the recommended items, it is convenient to view the keywords, so that the athletes can see the contents of the coping strategies that they need at a glance, and it is more convenient to “prescribe the right medicine”.
However, the content-based recommendation system also has the following shortcomings: the content analysis type is limited; over-regulation can only find content that is similar to the user’s interest; the design of keywords often requires the participation of domain experts.
By using the K-Means algorithm and the related theory of hierarchical clustering algorithm and combined with the characteristics of the sports competition pressure source data, this paper combines the layered algorithm with the K-means algorithm and slightly improves the H-K algorithm, making it more suitable for sports competition pressure source data. Then, this paper clusters the data of each dimension, and obtains the corresponding results, and comprehensively analyzes the results, which can facilitate the subsequent recommendation algorithm to model user preferences.
This paper studies the basic theory of content-based recommendation algorithms, including algorithm ideas, algorithm descriptions, and algorithm implementation. Moreover, combined with the characteristics of the stress source data of sports competition, this paper further improves the algorithm from the perspective of similarity calculation and latent semantic analysis, and then calculates the word frequency of the data. In addition, this paper obtains several suggestions with the greatest similarity with the user preference model and analyzes the results.
At the same time, this paper analyzes the stress sources and related theories of sports competition in detail, and successfully applies the theoretical knowledge of computer to the psychology field of sports competition pressure, which paves the way for the future use of sports psychology and computer science.
Finally, this paper applies the improved hierarchical clustering algorithm to the sports competition stress source data, and then recommends the user preference model established by clustering through the content-based recommendation algorithm and recommends some suggestions that match the athlete’s stress. However, there are still some shortcomings in the algorithm, and for subsequent research, it needs to be continued.