
Abstract
Sales forecasting with high accuracy is crucial in many industries. Especially, in fast-moving consumer goods, retail and apparel industries, the products are not tailor-made and must be produced and made available in chain stores to the customers, in advance. Therefore, for sales and operations planning, forecast information is required. However, traditionally, time series based forecasting techniques are used that merely consider the seasonality, trend, auto-regressive and cyclic factors. This type of forecasting is not suitable especially in cases where many other factors involved and affect the product sales. In apparel retail industry, special factors such as promotions, special days, weather (temperature), and location of the store may affect the product demands of the chain stores. The unique aspect of this study is that the sales of a product family of the fashion retail chain stores were estimated by means of artificial neural networks, for the first time in the literature. Besides, in this study, new significant factors in forecasting were explored that influence the demand of the chain stores. So, in this study, artificial neural networks are developed and used for sales forecasting of a product family of a real chain store, in Turkey. The stores exist in many cities, and some of the cities have much more stores than the other cities. The city with the highest number of stores was selected and some of the stores in this city chosen among them. The past sales, sales price and promotion data of selected stores are used. In addition, store information, number of customers visiting the store, and weather temperature data are included in the model. Sales are estimated by artificial neural networks. Besides, Regression Analysis was used for forecasting and the results of both techniques were compared. As a result of the study, the most appropriate network structure has been obtained, and a high sales forecasting performance has been reached.
Introduction
Full collaboration within the supply chain is an ideal practice where the most up-to-date and exact demand information is shared among the stakeholders [1]. Hence, all members of the supply chain can make long, intermediate or short term decisions. However, when full information sharing is not applicable, demand forecasting is strongly required to make accurate and suitable plans, in changing market conditions and to stay competitive.
Both tactical and strategical decisions in the short and long term are very crucial in supply chain management. Past studies investigated and shown the impact of demand forecasting bias and information sharing on the supply chain performance [2]). It was observed that demand forecasting can be used as a tool to reduce the bullwhip effect within the supply chains [3]. Therefore, sales forecasting with high accuracy becomes basic requirement in many industries. However, the market conditions, the factors that affect the demand vary among the industries. In some industries with relatively stable demand, traditional short term forecasting methods such as moving average, exponential smoothing and intermediate term methods such as regression analysis can be employed. On the other hand, in the industries with a huge variety of products and variable product demand patterns, those traditional methods are too narrow to represent the demand behavior. So, advanced methods such as machine learning based forecasting techniques that consider several factors significantly affecting the demand are strongly needed.
Especially, in fast-moving consumer goods, retail and apparel industries, products are not tailor-made and must be produced and made available in chain stores for the customers, in advance. Large variety of products, diversity in customer expectations and changes in trends make forecasting very difficult for the retail products [4, 5]. Demand is not stable, especially in big data era [4] and fashion supply chain is primarily based on quick and competent forecast [2]. Poor forecasting cause stock outs and insufficient usage of resources [6, 7]. To increase forecasting accuracy, lower the inventory holding, shortage and order costs and to increase customer satisfaction level, forecasting performance should be improved with the advanced approaches.
In this study, artificial neural networks have been developed and used sales forecast of a product family sold in a chain store in Turkey. The stores exist in many cities, and some of the cities have much more stores than the others. The city with the highest number of stores was selected and 37 of the stores in this city were chosen and considered. The past sales, sales price and promotion data of selected stores are used. In addition to these, store type and location information and weather temperature data are included in the model. Sales are estimated by artificial neural networks. As a result of the study, the most appropriate network structure has been obtained and a high sales forecasting performance has been reached that is applicable to other similar studies. Besides, the demand of the stores was forecasted also by means of the traditional Regression Analysis. The results obtained by the ANN was compared those of the regression analysis technique, and it was shown that the ANN performs much better than the regression, in terms of forecasting accuracy.
The unique aspect of this study is that the sales of the fashion retail chain stores were estimated by means of ANNs, for the first time in the literature. Instead of forecasting sales of the stores separately, the chains have to forecast their demand for all of their stores in order to make effective purchasing, inventory planning and resource allocation, and to exploit the economies of scale. Besides, in this study, new significant factors in forecasting were explored that influence the demand of the chain stores. Therefore, authors believe that a significant contribution is made by this study, to the contemporary practice and forecasting literature.
The paper is organized as follows: In the Literature Review section, forecasting methods in retailing explained and literature review in fashion retail forecasting is conducted. In the Methodology section, a brief information about the artificial neural networks (ANN) is presented, and the proposed ANN is explained. In section 3, the application of the proposed ANN on a real retail chain store data for a specific product group is made and the results are discussed. Later, the paper is concluded and future research opportunities are presented.
Literature review
Forecasting methods in various sectors
Although there are lots of methods for demand forecasting, it is also important for the company to choose the right method considering all factors (environmental, economic and legal) that may affect products’sales. Therefore, for sales and operations planning, forecast information is required. Usually two types of forecasting are emphasized in the literature;traditional statistical methods and modern heuristic methods.
Statistical methods are generally used for forecasting of products with smooth and high volume demand [6] Using the historical data, these methods can make simple predictions. Moving average, trend based forecasting, linear and multi linear regression, exponential smoothing, Holt and Winters, Box &Jenkins and ARIMA (Auto-Regressive Moving Average) are the main statistical methods used in the literature. Classical methods use linear functional form for modelling which are simple and fast. However, they are not satisfactory in predicting demand for the industries having several external and sometimes correlated external factors, and retail fashion sector is a good example for this kind of industries [1, 8].
With the new approaches, advanced techniques such as neural networks, data mining and some hybrid models have started to be applied [9]. Advanced models have been developed to overcome the weaknesses of traditional methods such as requirement of individual statistical method for each model and inapplicability for multi-dimensional time series [10] and these advanced methods are usually able to handle the irregular patterns and high variability in demand.
ANN is briefly the transfer of the functioning and processing of the human brain to the computer environment and was first used for weather forecasting [11]. Each neuron which is the basic element of an ANN, connected to its neighbors with varying coefficients which indicate connectivity strength among them [12]. The prevalence of the model came after it was used in a company and thus entered the sector.
In the literature, artificial neural networks were used in different business fields, such as fraud detection, stock price and currency rate forecasting, credit scoring, and decision support for sales forecasting [13].
Besides, neural networks were used for electrical load forecasting [14], solar irradiance to be received by the photovoltaic systems [15], electricity usage of the buildings [16], and day-ahead electricity price [17], and for demand forecasting [12] among others. Yao et al. [18] used sales promotion, seasonal factors, brand preference, avarage price, press and screen size indicators for TV sales forecasting and analaysis of marketing data using neural networks in 1998.
Forecasting methods in fashion retailing
Traditionally, time-series based forecasting techniques merely consider the seasonality, trend, auto-regressive and cyclic factors. These statistical methods mostly rely on past sales data, and assume that historical demand pattern will continue in the future as well. These methods provide acceptable forecasting, when the product demand is not affected by external factors. Especially, other factors such as fashion trends and customer preferences cannot be involved in forecasting. This type of forecasting is not suitable especially in cases where many other factors affect the product sales.
Fashion industry is in a state of transition because of the need for globalization, need for cost reduction and constantly changing customer expectations. In fashion industry, lead time is very long compared to the short lifespan of products sales period [8]. Croxton et al examined uncertainty in retail forecasting and introduce 4P which stands for Product, Promotion, Placement and Price parameters [19]. Sales amounts are very sensitive to the weather changes and the demand is volatile as it has to be produced in many colors and sizes. In addition, seasonality is another feature that should be taken into consideration according to the type of the product. Compared to other retail sectors, the fashion retail supply chain has a longer chain. So, it is more prone to the bullwhip effects. Especially for the new products, there are many factors that will affect the sales. If the customer’s demand cannot be met at that moment, the customer is more likely to switch to another brand or store.
Main challenging factors affecting forecasting in fashion retailing are as follows: High demand uncertainty because of the customers’constantly changing needs and preferences, Short lead time for replenishment, Limited amount of data [20] Strong seasonality, Wide number of products [21] If the prediction accuracy increases, the following can be achieved: Bullwhip effect’s impact reduction, Lost sales reduction, Optimum resource utilization and decrease in cost
Classification methods and data mining techniques should be employed if the product is new or the number of the Stock Keeping Units (SKU) is high to manage separately. Besides, product family groups can be formed to understand the past behavior of the similar products [22].
Chu &Zhang (2013) proposed comparative study between linear models and nonlinear neural networks in aggregate retail sales forecasting and found that the nonlinear method was the preferred approach in modelling retail sales [23].
A novel neural network technique called extreme learning machine (ELM) was proposed by Sun et al to investigate the significant factors affecting the sales amount and these factors were selected as the inputs of ELM [24]. Au et al studied evolutionary neural network (ENN) for sales forecasting in fashion retailing with two years past sales data and they achieved promising results [25].
Thomassey (2010) investigated different characteristics of the textile–apparel market including horizon and the level of sales aggregation [21]. In addition, the advanced methods used by the companies were mentioned, and some methods were suggested to respond to the uncertainties and to perform more accurate and reliable sales forecast. These include fuzzy logic, neural networks and data mining.
Fashion industries are often faced with forecasting problems because they have to consider many SKUs at once. ELM known as intelligent fast sales forecasting model was studied for the fashion products to achieve a high forecasting accuracy, in short time and low cost, at the same time for multiple SKUs [26].
Hybrid methods based on extreme learning machine models with the adaptive metrics of inputs were proposed for improving sales forecasting accuracy in fashion retail by Xia et al, (2012). These metrics were used to define excessive demand change and trends in order to reduce the effect of the overfitting problem of the neural networks.
Liu et al. (2013), Nenni et al, (2013), Thomassey (2014), and Beheshti-Kashi (2015) are the main articles that studied the literature about fashion retail and discuss the methods used in this field comparatively [6, 27].
Recently, the ANNs were used to forecast the demand of a product family of the retail fashion chain stores, such that promotions, special days, weather conditions are the dynamic factors represented in the ANN models [28]. However, this study did not analyze the performance of the ANN to that of the traditional time-series analysis techniques, in forecasting.
Although retail sales data is complex and random, neural networks can provide fairly accurate forecast results [25]. Therefore, in this study, artificial neural networks have been developed and used in estimating the sales of the product family of a chain stores of fashion, in Turkey.
So, in this study, sales of the fashion retail chain stores were estimated by means of ANNs, for the first time in the literature. Although the fashion stores’demand was estimated separately in earlier studies, the retail chains have to forecast their demand once for all of their stores in order to make effective purchasing, inventory planning and resource allocations, and to exploit the economies of scale. Besides, in this study, new significant factors in forecasting was explored that are the store’s locations in the city and the store types (traditional or concept stores) that influence the demand. Therefore, authors believe that a significant contribution is made by this study, to the contemporary forecasting literature.
Methodology
An Artificial neural network (ANN) can be defined as a numerical model developed in a similar way with the structure of the biological nervous system. Although there are changes in different models, the main characteristics of ANN are non-linearity, learning, generalization, and flexibility features. In artificial neural networks, there are multilayer (MLP) as well as single layer (consisting only of input and output) models and like problems encountered in daily life, inputs and outputs relations are not linear and this non-linearity allows complex problems to be solved. Learning is the ability to make inferences from data, inspired by the human brain. Thanks to this feature, ANN can stand out from the classical algorithms and can tolerate erroneous and missing data. ANN can easily adapt to the changes that may occur in the models. For this reason, it is a flexible algorithm. There are programs, modules and add-ons developed for the studies of artificial neural networks.
Unlike traditional methods, ANN can work on its own without any intervention. In traditional methods, the system response is longer than that in an ANN, so it is efficient in terms of time. The disadvantage of ANN is that it does not guarantee the best solution and only works with numerical data. The inability to explain the behavior of the network is another handicap. In addition, too much data is needed to train the model. Considering that we have enough data in our model, this is no longer a problem for us.
There may be changes in the operating speeds of the models according to the preferred learning algorithm and other parameters. It is also possible to classify artificial neural networks according to the types, learning method, number of layers, structures and time of learning [29]. Networks are classified into two types as forward and back feed. In feed-forward type networks, there is no loop between process elements. The network generates data in response to the inputs and has a fast system. A sequential flow occurs between the process elements. In feedback networks, no sequential flow in the network structure is seen. The information in the neuron may be input to a neuron in former layers or in its own layer.
Back propagation has a simple architecture but provides a powerful problem solving ability [30]. Most of the past papers used Back Propagation, and this method quite relies on parameter setting, such as numbers of neurons and hidden layers. In order to find the optimum set-up, different network structures should be established for different problems [31].
Configuration of multilayer perceptron ANN.
According to Karaatli et al. the decision maker determines the type of network that is suitable for the type of the problem [32]. The weights between input and output are changed repeatedly to reduce the difference between the actual value and the output.
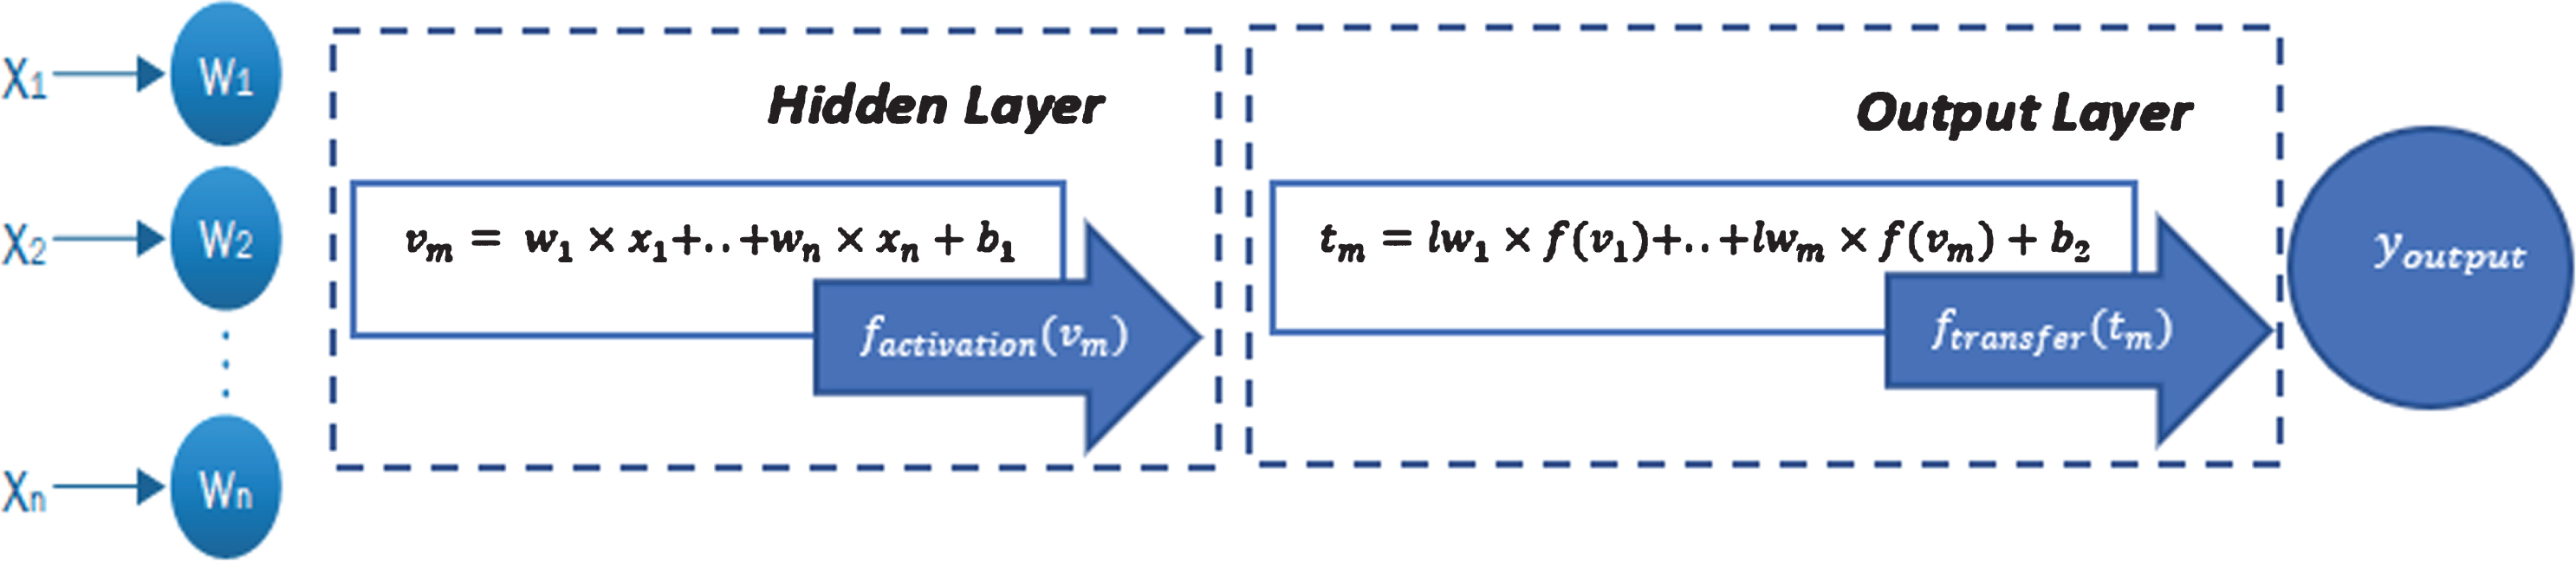
In artificial neural networks, an aggregation process is performed with the function of collecting information. In the addition function, inputs are multiplied by weight values. The weights between input and output are changed repeatedly to reduce the difference between the actual value and the output. These weights are replaced by the self-training process of the network until the smallest error occurs during the training of data across the network. This process generates the input of the neuron [33]. The different collection functions as well as the aggregation function relation used in the study are given in Equation (1) [29].
x i = output value of the neuron
w ij = weight of the connection between the neurons-I and j
b j = bias value for jth neuron
y j = net input value of the jth neuron
The functions that convert input values are called activation functions. The activation function affects the performance of the network. The results are evaluated according to different activation function values. Activation functions used in multilayered neural networks are sigmoid, hyperbolic tangent and linear, as shown in Equations (2), (3) and, (4), respectively.
The data processed in the activation functions pass through the similar transfer functions and generate the output of the model. To evaluate the artificial neural network performance, the actual data and outputs reached by the neural network are compared, and the forecasting error is computed. In these evaluations, Mean Absolute Percentage Error (MAPE), Mean Absolute Error (MSE), Sum Square Error (SSE), and Mean Square Error (MSE) can be used, as error of estimate measures, that are denoted in Equations (5), (6) and (7), respectively.
In Fig. 2, we present the stages of the general forecasting methodology applied in this study. First, in the Data Pre-Processing stage, the dependent and independent data are collected. Here, the dependent variable is associated with the past sales. The independent variables are determined by means of the literature review and expert opinions. Besides, the outlier values of the dependent variable must be excluded, in order to prevent misleading results. This can be called “data cleaning”. Later, since the variables usually have different scale, a normalization step is required. There are different methods for data normalization. In artificial neural networks, the data must be in the range [0.1]. Then, the collected data is divided into test and training data. After Data Pre-Processing, the ANN Model must be built. However, the performance of the ANN varies according to the different activation and transfer functions as well as the number of hidden layers. So, the most suitable ANN configuration must be searched for, to reach a high performance, especially low forecasting error (MSE). After deciding on the configuration of the ANN model, the results are collected, and the normalized output data (estimated demand) is denormalized, and the mean absolute percent error (MAPE) of the forecasting technique is computed. When different ANN models are considered, the results of them must be compared, so that the best forecasting model is determined.
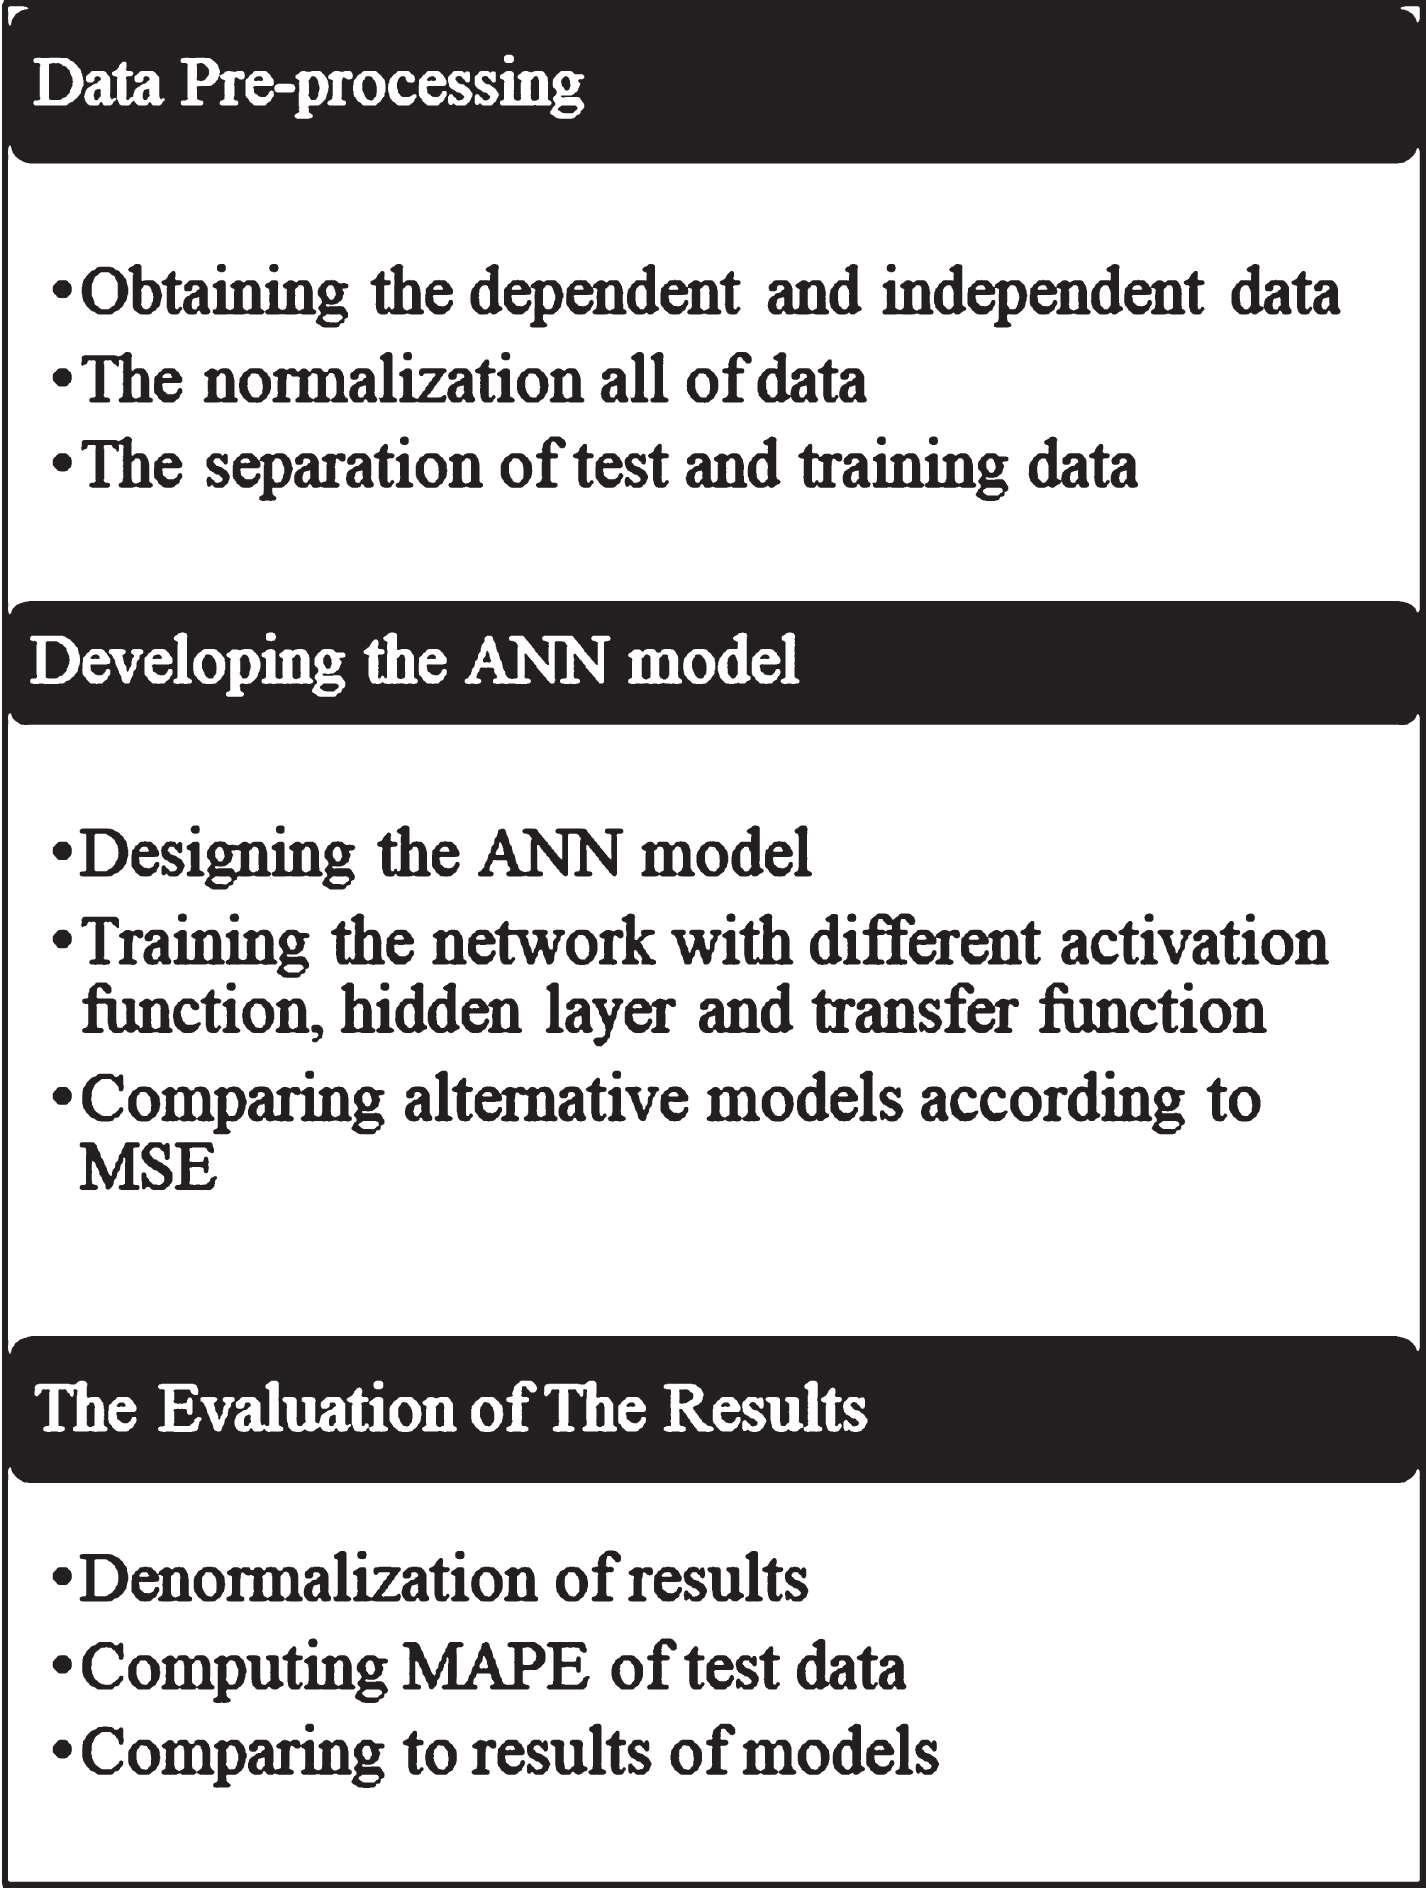
Stages of proposed forecasting methodology.
In this study, MATLAB® “nntool”toolbox was used for the network model. In order to compare the performance of the ANN with the traditional time-series forecasting models/techniques, we used the Regression analysis.
Regression analysis is a method to find a relationship between independent variables and dependent variables. In linear regression method, the function is linear equation that is shown in Equation (8) [34]. In this study, in the regression function, the dependent variable is the sales, and the independent variable is the time period.
In regression analysis models as in ANN models, the results are generally evaluated according to the performance criteria given in Equations (5), (6), (7).
In the next section of the paper, an application of the proposed methodology based on ANN is presented.
The study consists of two parts. Firstly, the data set used belongs to the sales of sports shoes model in the stores at the shopping centers in Istanbul. Street stores are not considered because they may vary in product models and prices. Secondly, the stores and concept stores were also considered for both shopping malls and street stores. The models for these two different prediction models are defined as modelstores and modelgeneral, respectively.
Most sellers have detailed sales information for the past. ANN can analyze the data in accordance with this information and solve the complex relations between them. The data set used belongs to the sales of a sports shoes model in the shopping center in Istanbul. Street stores are not considered because they may vary in product models and prices. An artificial neural network model (ANN) has been proposed to estimate the sales of the model that can be used in all seasons. The weekly sales data for 2014–2017 are used in the ANN model.
If ANN is directly applied without pretreatment of data and learning techniques, they are not suitable for fashion retail. Therefore, lots of techniques were applied to fit data to the ANN [27].
In the data set, the years for which the data of the independent variables exist are included in the study. So, some of the weekly data that had missing values were excluded. Besides, the outlier values were also excluded that could cause biased or misleading results. Here, while sales data are output values, independent variables entering the network are the average weekly air temperatures, the percentage of discount, the number of customers coming to the store, special days and store information. Input variables include numeric, nominal and binary data. The information about the variables is explained in Table 1.
Information about variables
Information about variables
Independent variables were determined based on articles and industry studies. Our selected product, shoes, are the product that can be used according to the air temperature. Therefore, the air temperature was taken as an independent variable. It is known that on special days, shopping companies campaign to increase their sales. Therefore, mother’s day, Father’s day, Valentine’s day, Christmas and religious holidays of the country are included in the data set as nominal variable according to the relevant year.
Fashion items are very sensitive to prices changes. Textile fashion deals with volatile demand, wide range of products with short life-cycle. Sales of product are output variables that are intended to be estimated (dependent variable). Sales of product was obtained from product manager of the company. Product price information and discount amounts are also independent variables. The price of the product has an effect on the sales quantity. The discount percentage also plays an important role in whether or not the customer purchases the product. These two variables show the material dimension that affects the demand for the product. The number of customers coming to the stores was recorded separately for each store on a weekly basis by the company. The number of customers coming to the store gives information about the preferability of that store. There is a relationship between product delivery to stores and the number of customers arriving. It can be said that the number of customers has an effect on the demand. This is included in the model as a separate variable. The store information is a nominal data group and it is included in the system with separate dummy variables for each store in the modelstores. In the modelgeneral, store information is one nominal variable. In the modelgeneral, store information is the only variable and indicates whether the store is an shopping mall store or not. After the data set was created, the rows containing the missing data were cleared.
The second step of the data preprocessing phase is data normalization. The data must be normalized before being submitted to the network. Normalization is a preliminary study to prevent the imbalance between the data groups or to eliminate the negativity of the extremely large / small data. There are different methods such as statistical normalization, min-max normalization, median normalization, sigmoid normalization to achieve normalization [35]. Min-Max normalization method is preferred for data normalization. The normalization applied is shown in Equation (9).
Normalized data in the range [0,1] are randomly mixed. The data is divided into training and test data set. Since the network will be trained according to the data of stores in the training data set, it will encounter different store data in the test data set. Although the network is trained, the simulation results in a high error percentage. The random distribution of data ensures that training and test data sets are no different. Randomly distributed data rows are divided into 80%training and 20%test data set. Therefore, the data pre-processing phase is completed.
The next stage is the development of the ANN model. The pre-processing phase is common to both forecasting models. However, the modelling phase is different for them. The first model was developed for the company’s stores in Istanbul.
The ANN structure of modelstores is presented in Fig. 3. At this stage, many network designs are established and networks trained and results are obtained. At the end of experiments, the error value is the lowest, and the best learning model is accepted.
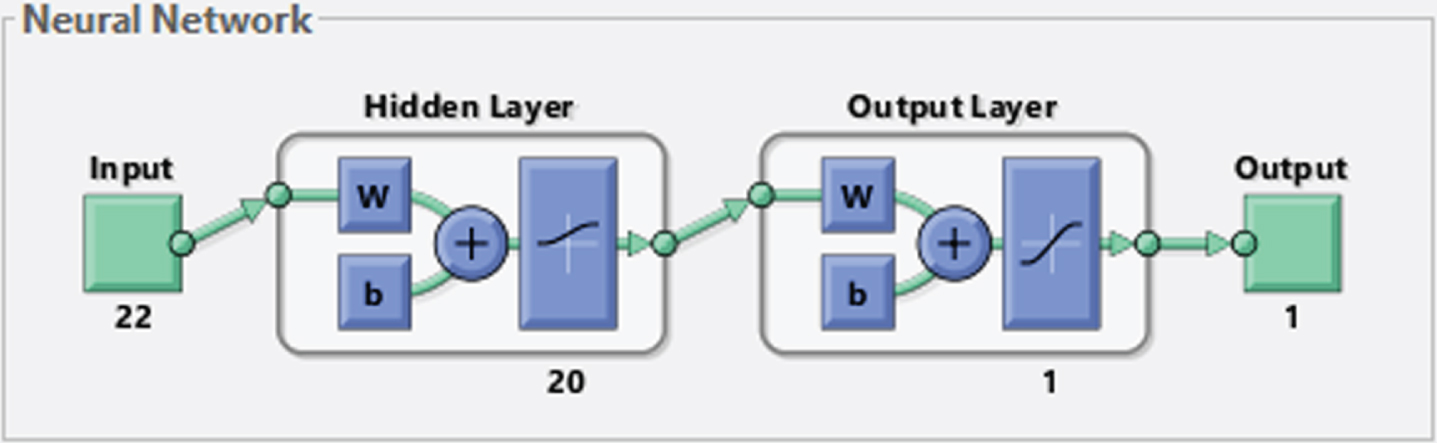
Model of artificial neural network structure.
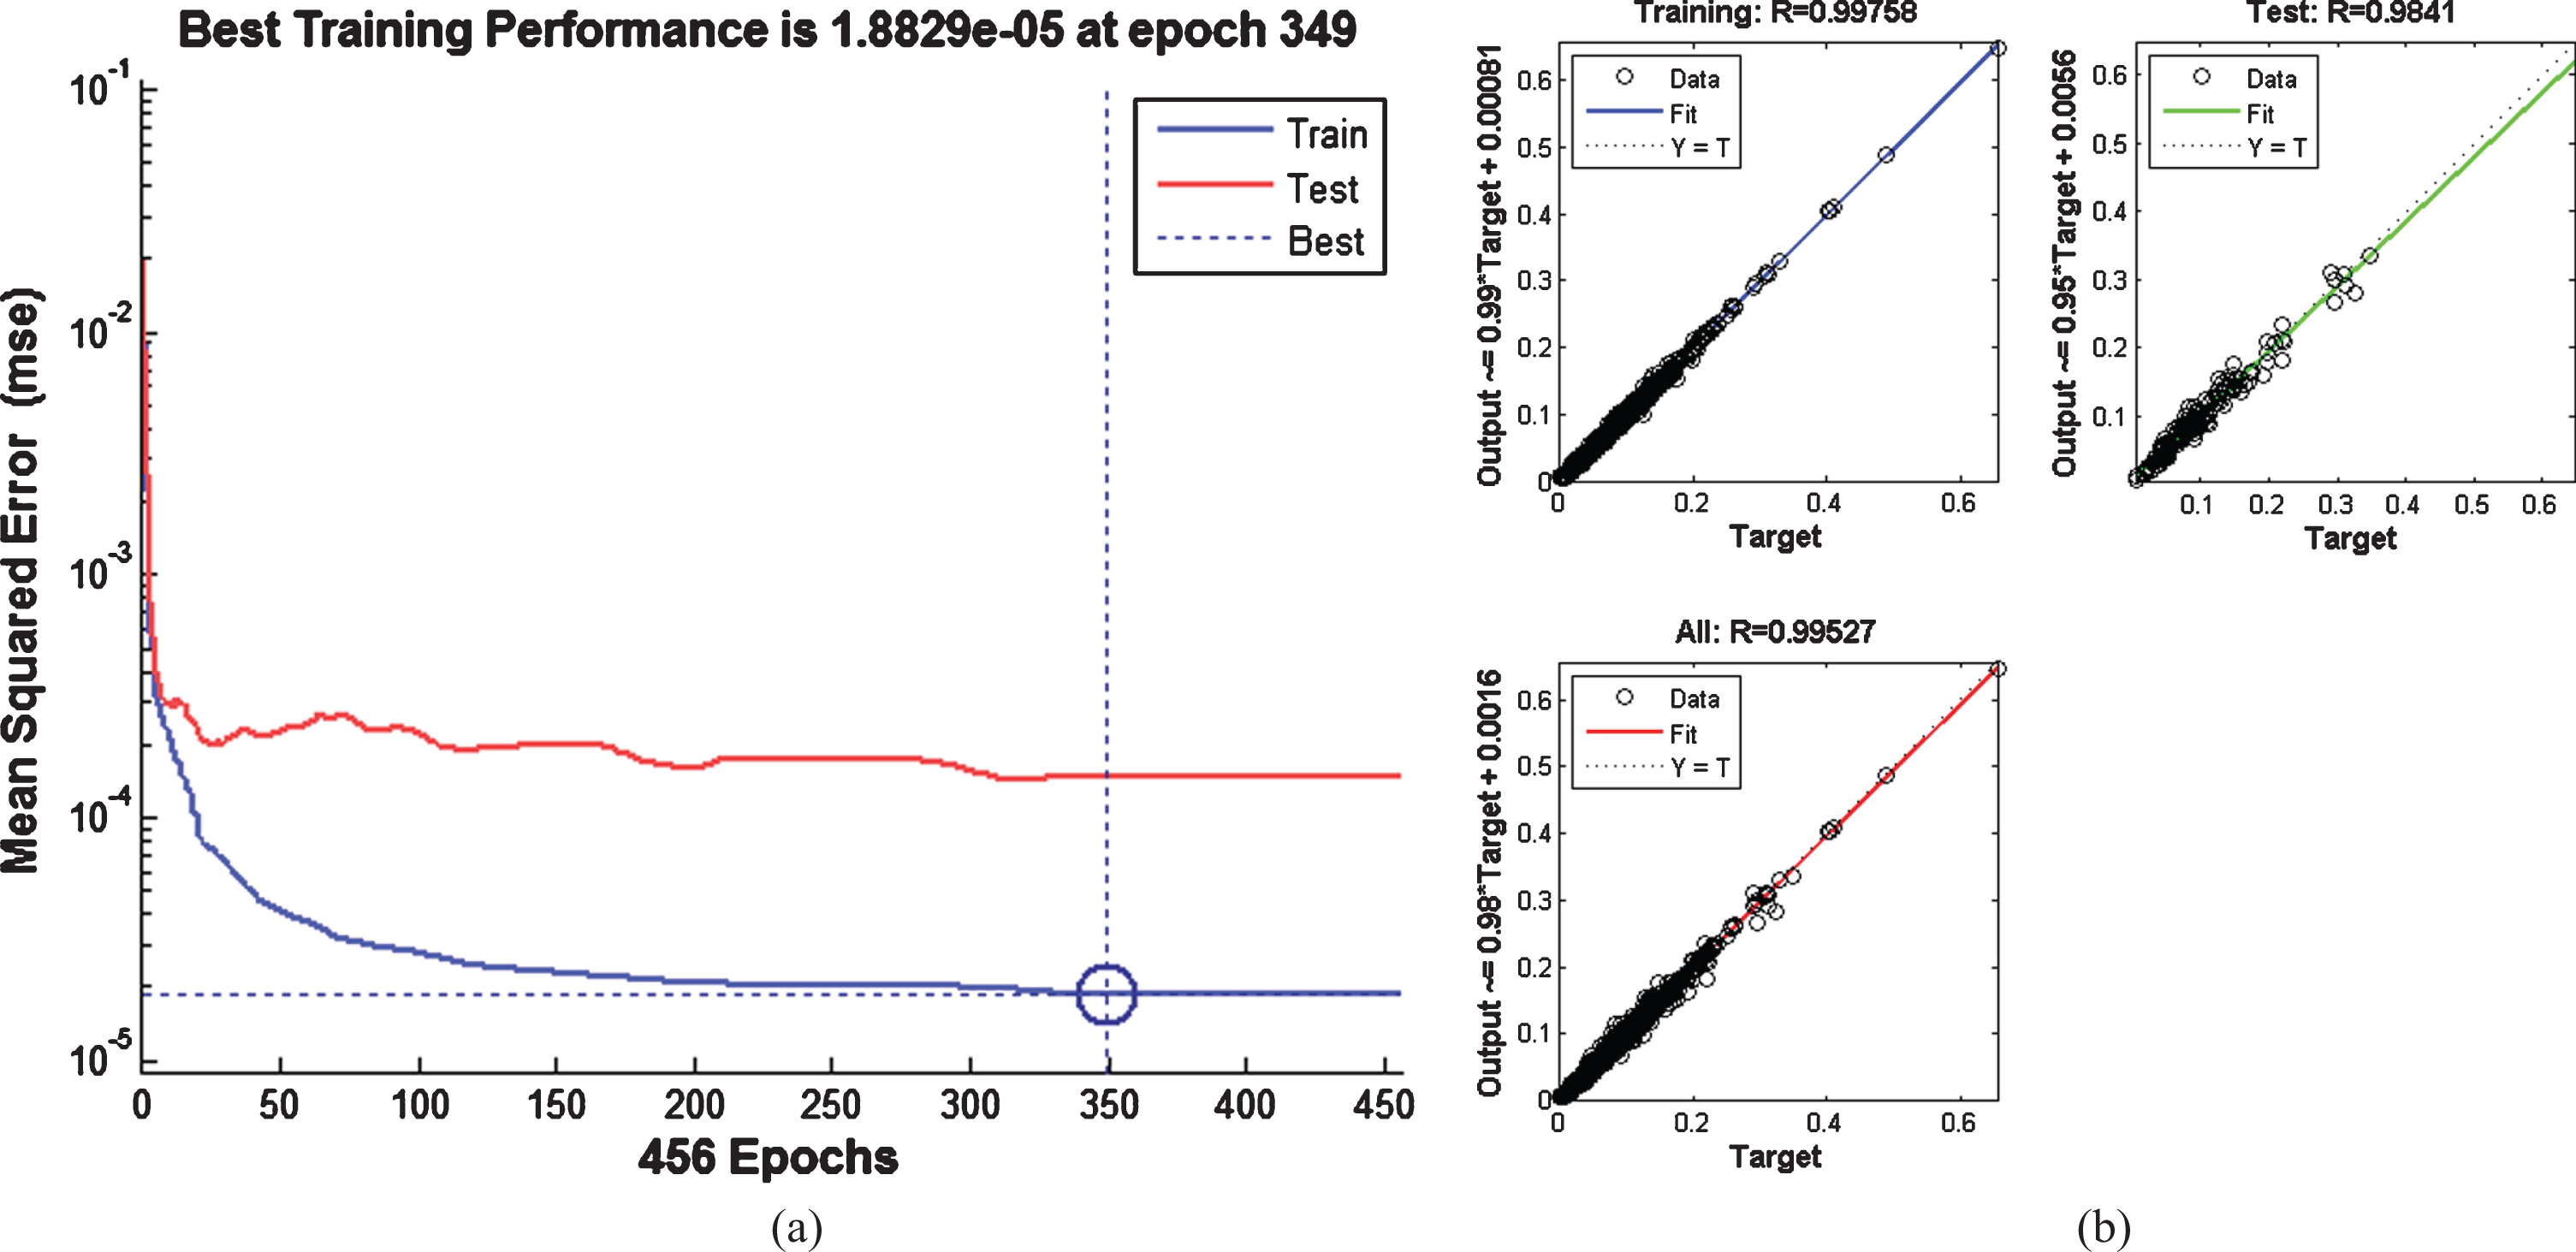
Training performance(a) and regression charts(b) of the network.
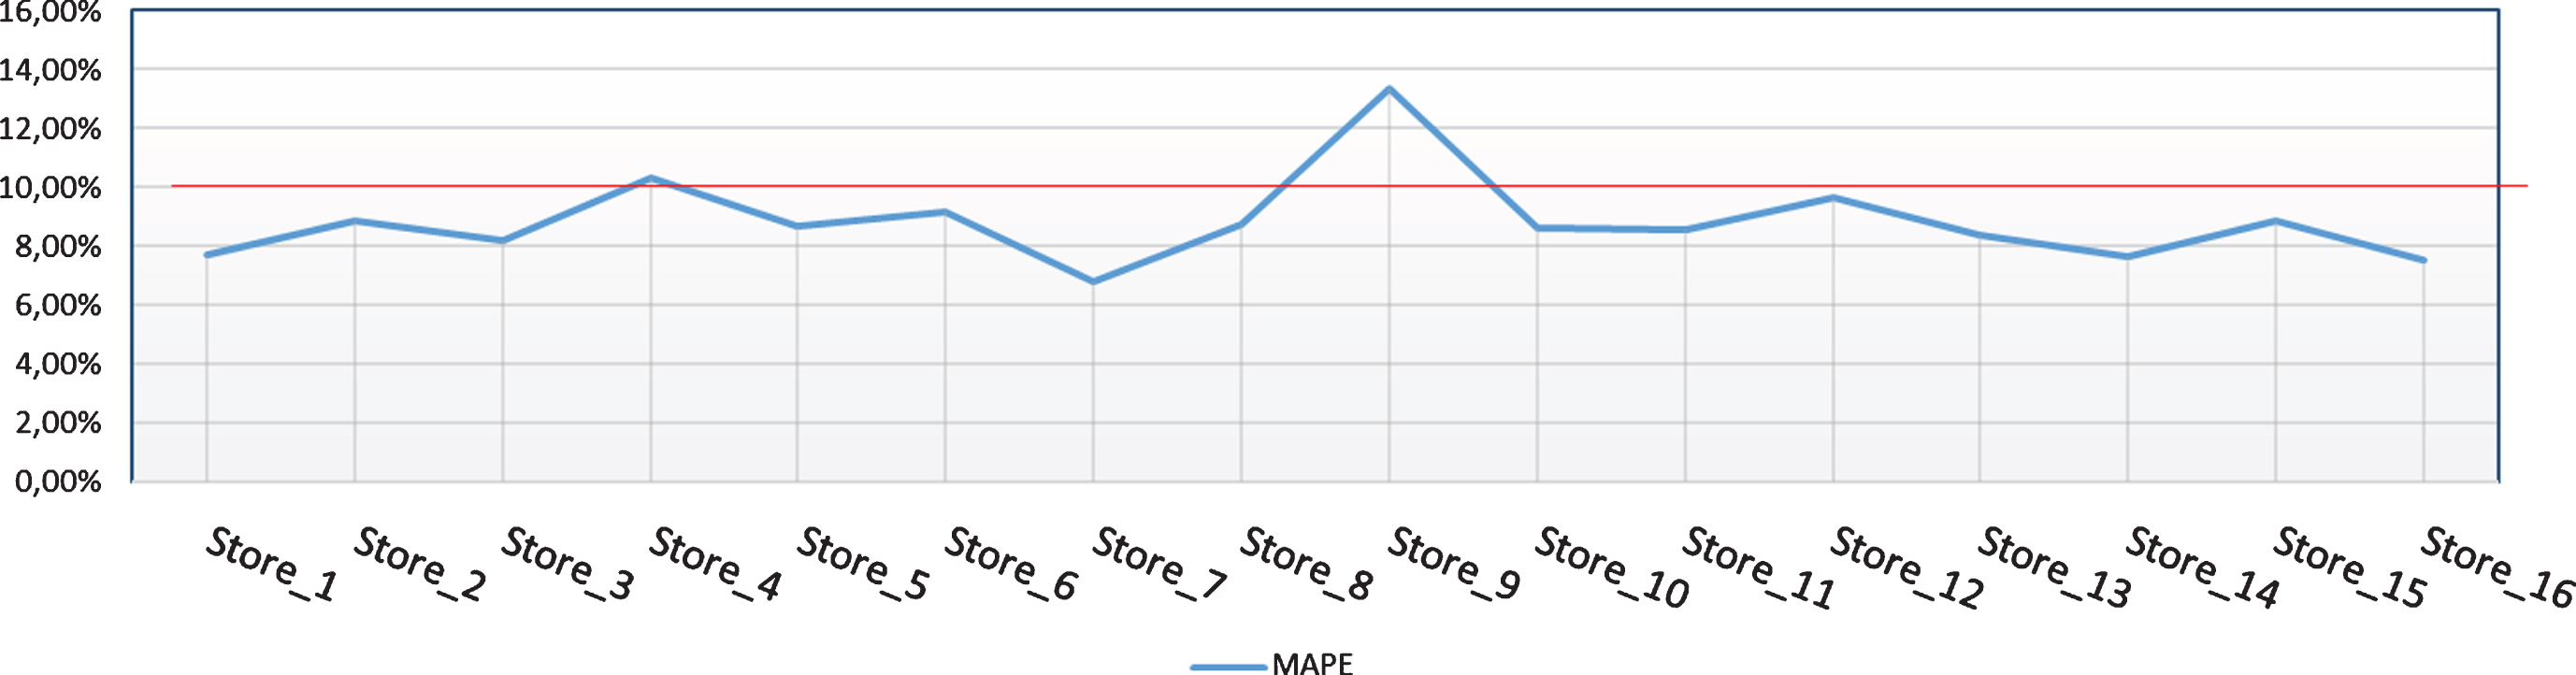
The MAPE values according to stores.
In this study, Bayesian regulation learning function and feed-forward back propagation algorithm are applied. The network structure includes two layers, twenty hidden neurons, sigmoid activation and tansig transfer functions. The type of the ANN, the number of hidden neurons, activation and transfer functions and the number of layers were found as a result of many trials, so as to reach a better forecasting performance, in terms of MSE and MAPE. Figure 4 shows the graphs of error and regression coefficient (R) as a result of the training. According to the R values of the model, the results are close to 1 for both training and test groups. The MSE value is 1,88e-5.
After the training of the network, the data reserved for the test are simulated. After the test results are obtained, normalized results are converted into the original values of the input factors. If the output data is evaluated directly, it will cause misleading results. As a result, the error value of 8,79%was obtained according to the MAPE performance criterion. This value shows that the proposed ANN with its current structure and parameters provided a superior performance, for the specified product family. When the estimation results are evaluated on the basis of stores, MAPE value of two stores is higher than 10%. MAPE ratios of 20%and below may be acceptable levels in estimation studies. Mean absolute percentage error values according to the stores are shown in Fig. 5.
The first model was developed for the shopping mall stores of company in Istanbul. The second model was developed for the stores and concept stores of the company in Istanbul. In the second model, weekly sales data for 37 stores were used for the years 2014–2017. Unlike the data set of the first model, no separate dummy variables were created for store information. In this model, the stores are defined as binary as shopping mall stores or others. The MAPE value of the model, which was developed with 20 The MAPE graph of compared ANN models. The MAPE graph of compared ANN models. Training performance(a) and regression charts(b) of the network.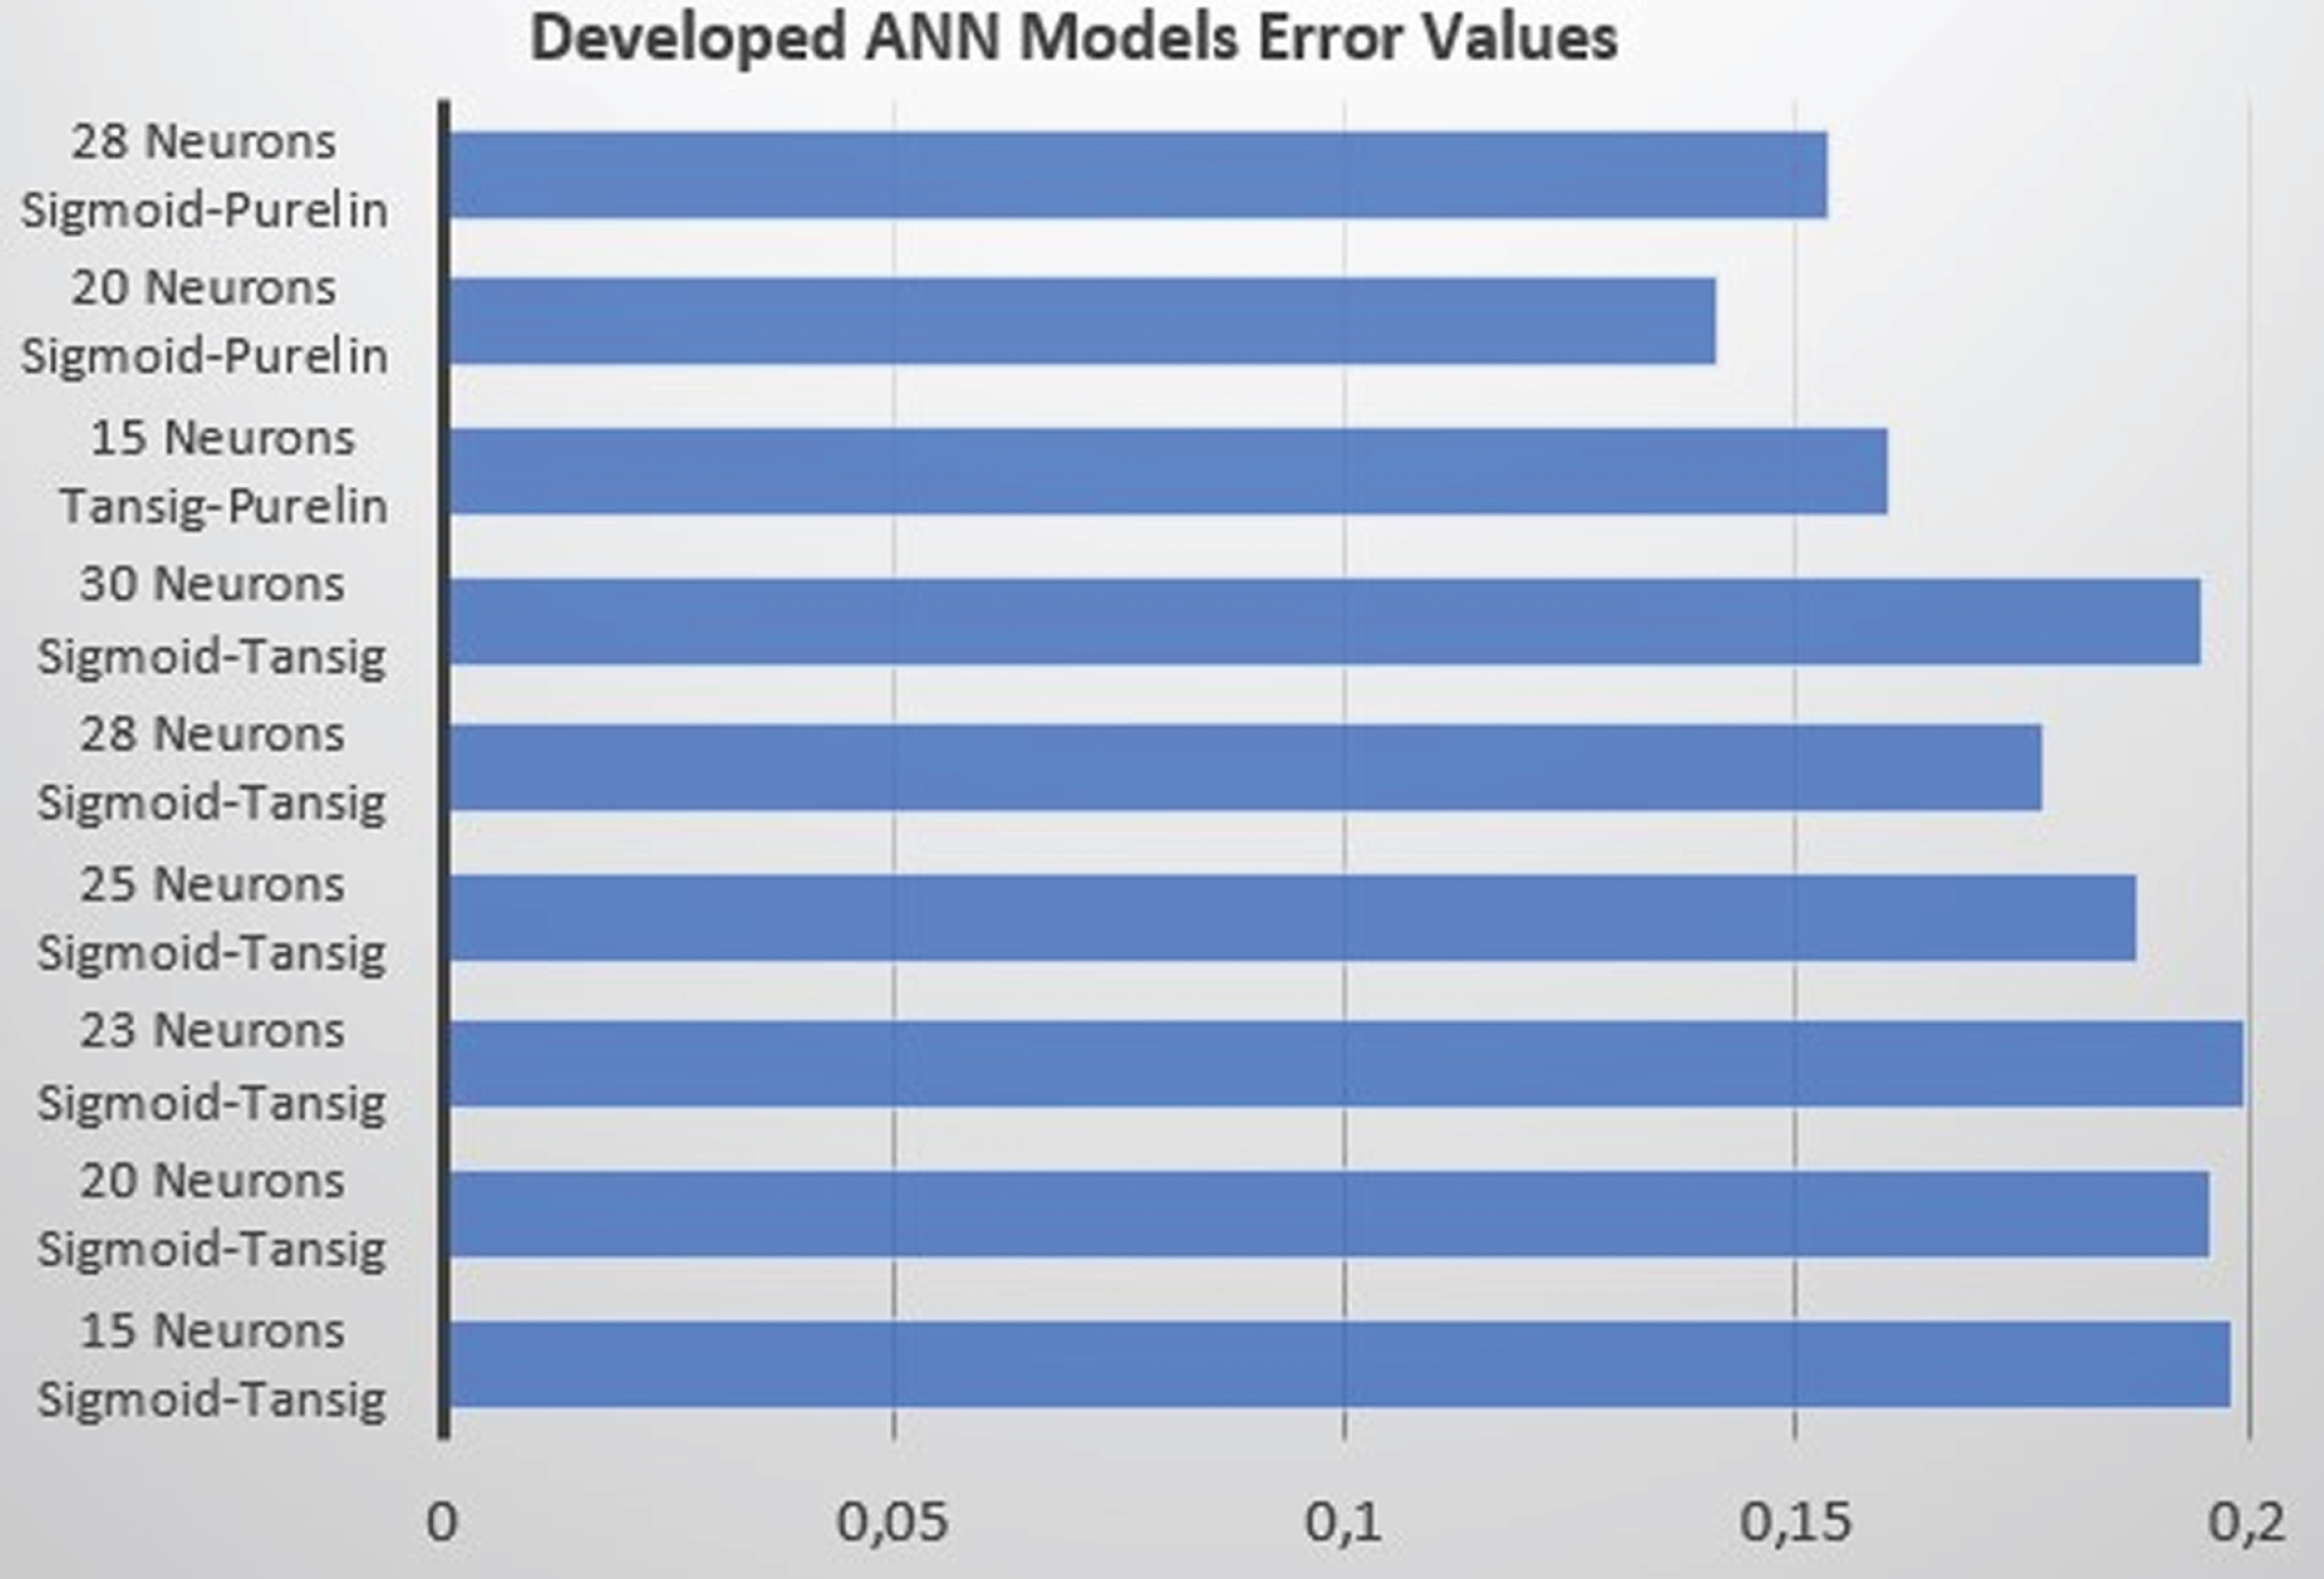
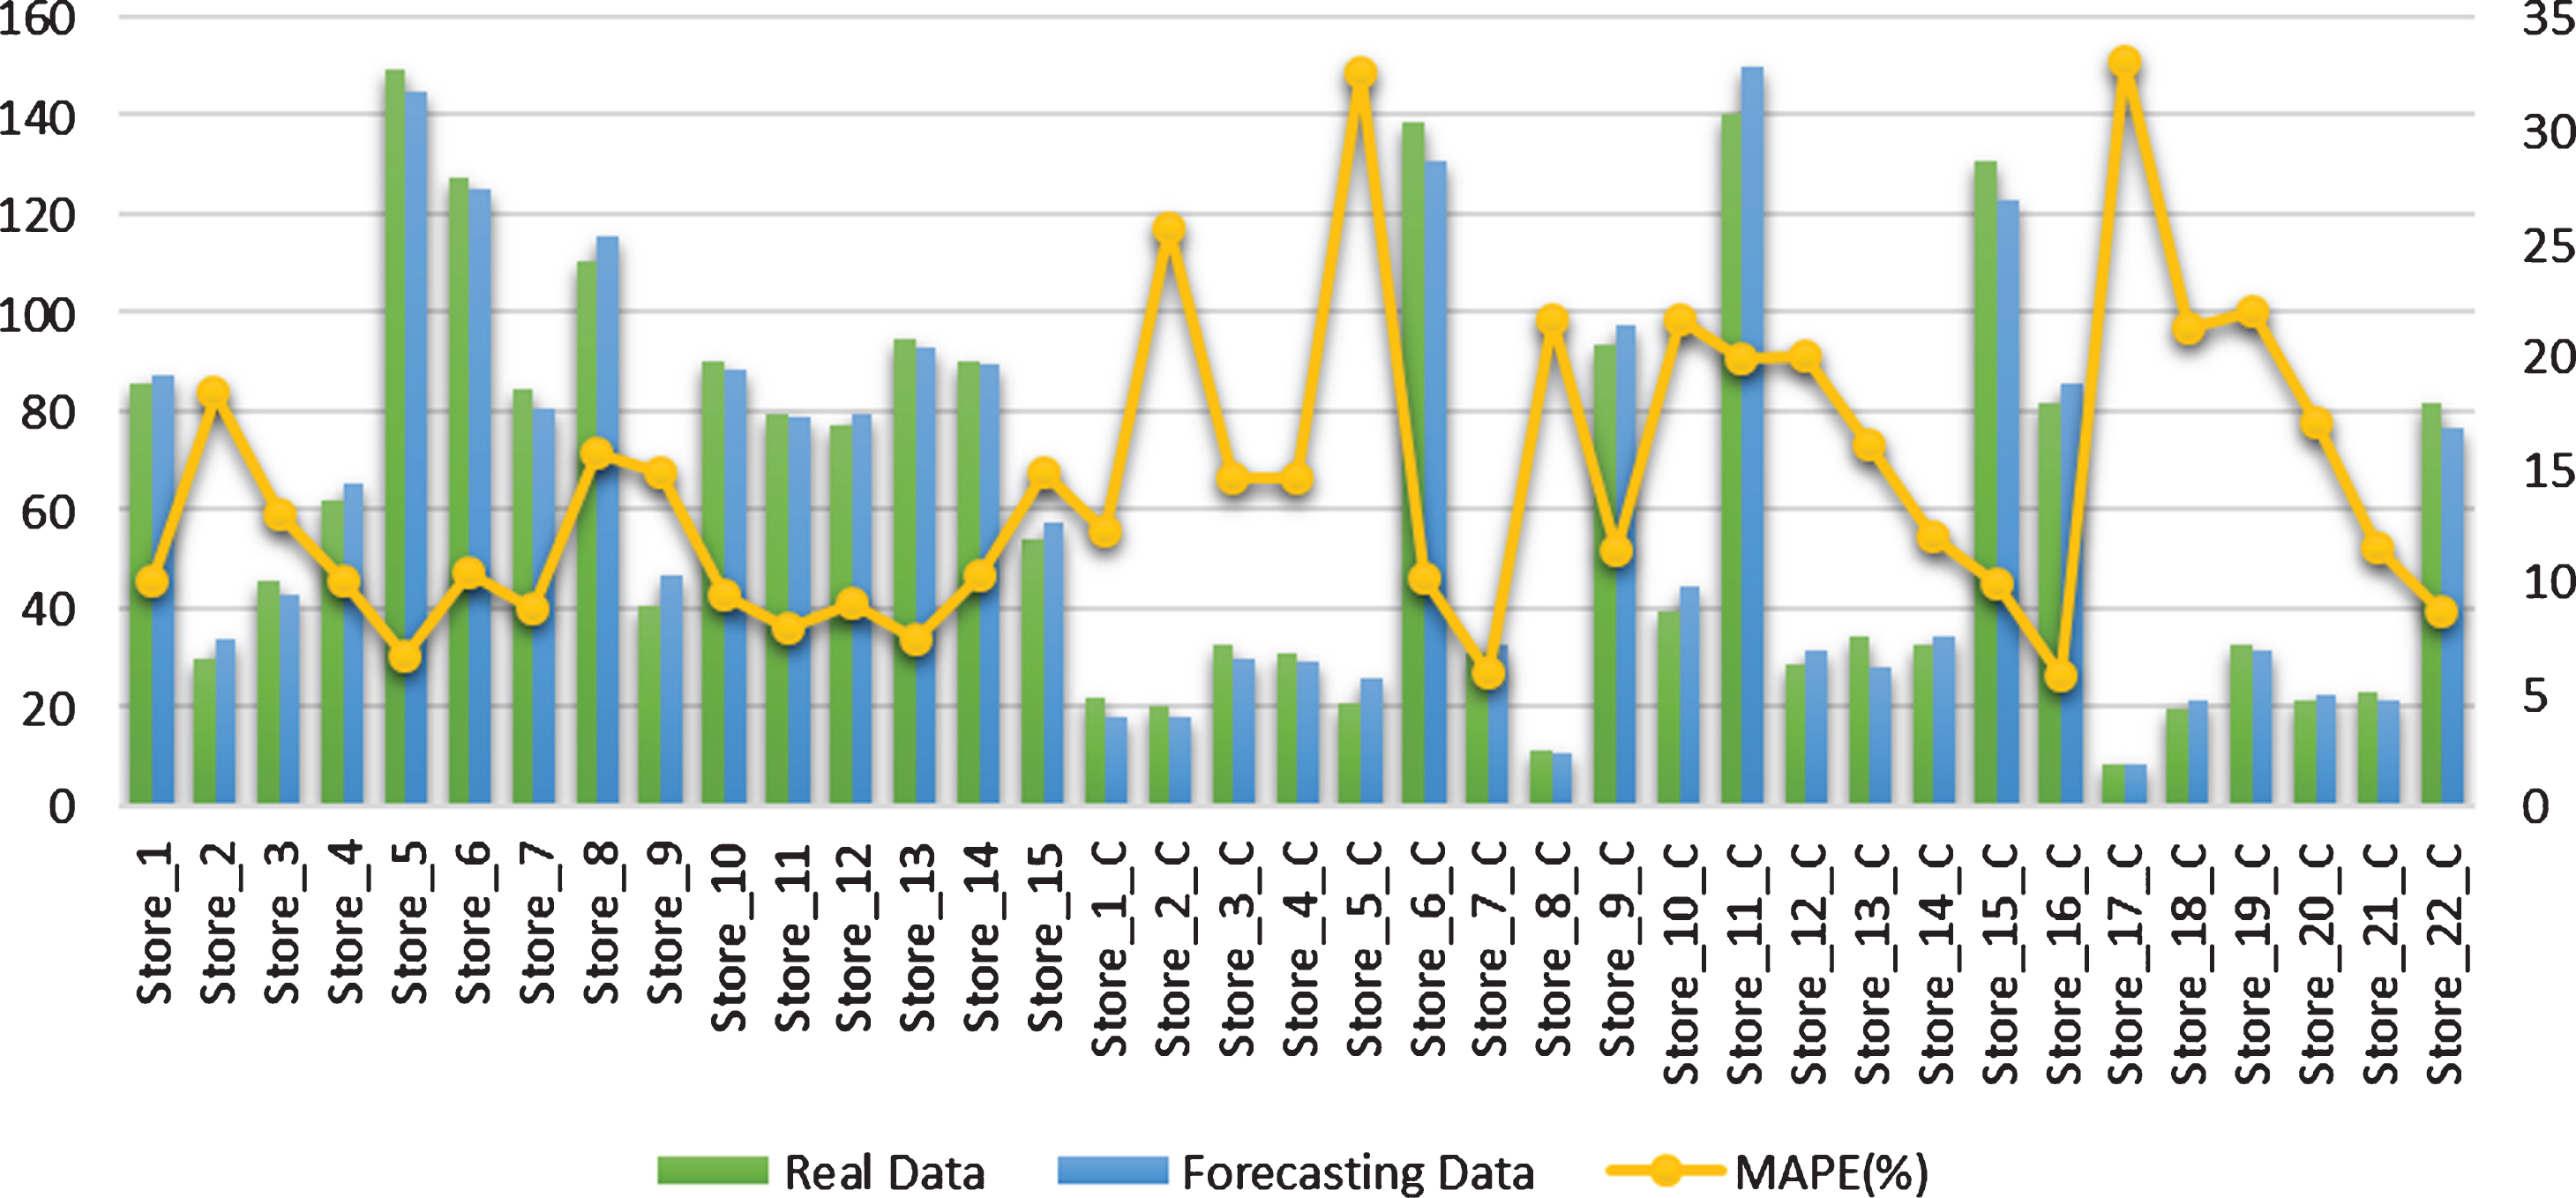
Comparison of actual and forecasting sales data (weekly average).

Comparison of regression analysis and artificial neural network.
The developed ANN models are compared with each other. The MAPE of models is shown in Fig. 6. Many models have been developed and trained. According to the model test results, models with MAPE values below 20%were included in the graph. Based on these results, the model that minimizes the error rate is the ANN model developed with 20 hidden neurons, sigmoid and purelin (linear) functions.
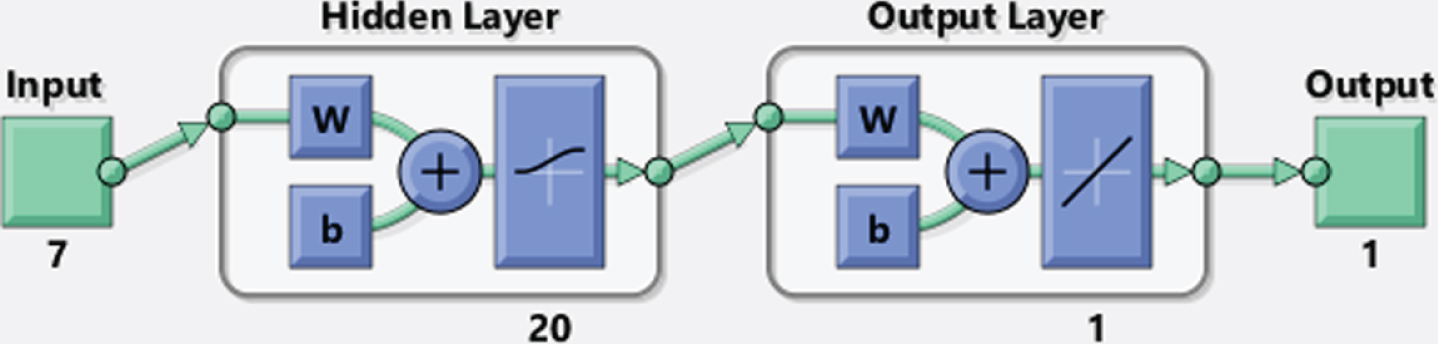
The network structure is shown in Fig. 7. In the second model, Bayesian regulation learning function and feed-forward back propagation algorithm also are applied. In the model that includes all stores in Istanbul, the lowest MAPE value is 15%approximately. The network model was configured with 20 hidden neurons, sigmoid and purelin functions, respectively. Likewise, the type of the ANN, the number of hidden neurons, activation and transfer functions and the number of layers were found as a result of many trials, so as to reach a better forecasting performance, in terms of MSE and MAPE.
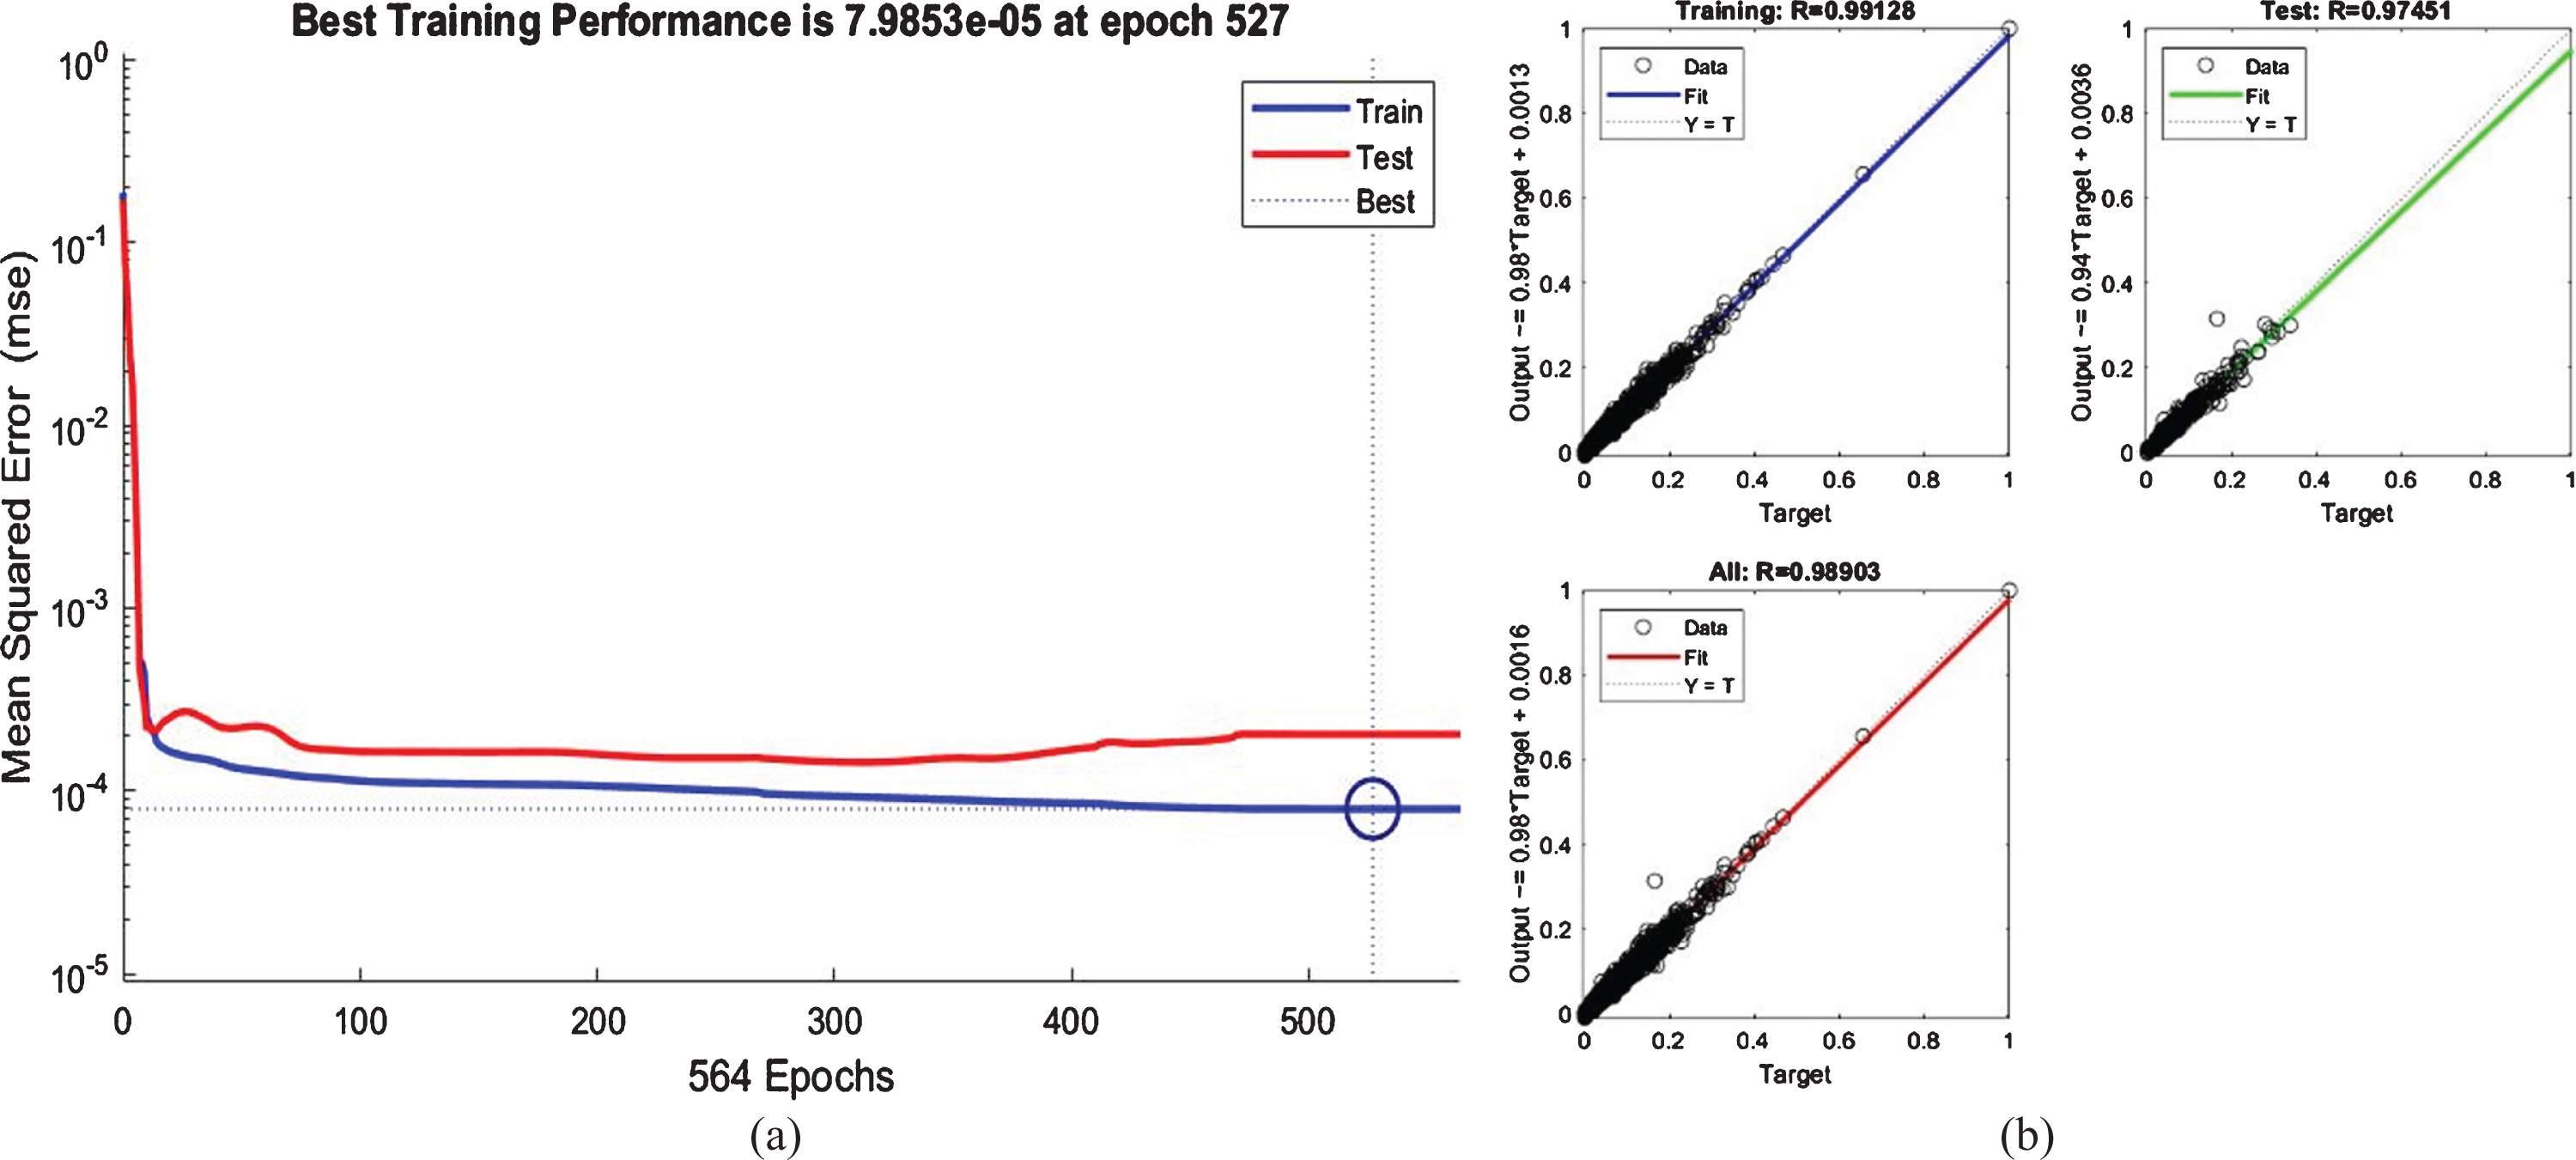
Figure 8 (a) presents the training and test results of the model. The model had the lowest error level at 527. iteration. The descriptor of the model and the data set is shown in Figure 8 (b). It was found to be relatively lower than the first model, but above 0.97 in all of the R coefficients.
The test results obtained from the model including all stores are evaluated. The results obtained from the simulated test group are calculated weekly average values for each store. Figure 9 shows the weekly average real and forecast values of the simulated predictions. In addition, MAPE error percentages were added to the graph to make the values more meaningful. The results showed that when the sales of the stores are analyzed on the basis of weekly average values, most of them have an error rate of less than 10%. This means that the ANN models are suitable for use in sales forecasts for the stores in the data set.
In this study, the demands are estimated for the stores in different locations and concepts. In addition, the results are compared using different methods. Regression analysis was applied to make this comparison. Estimation is made for weekly product sales data of all stores. Time variable is used as explanatory variable. According to the results of the analysis, ANN and regression model MAPE values were compared for the stores with 95%confidence level. SPSSâ is used for linear regression analysis. Figure 10 presents results of the regression analysis. It was clearly seen from the figures that, linear regression modeling based on time variable is not enough to forecast for these data sets.
In this study, a sales forecasting for the apparel retail chain stores is performed using the ANN, based on real data. The weekly data set used is actual data and, unlike other studies, the descriptive data group is composed of numerical and categorical data. In this study, it is aimed to determine how the independent variables considered affect the model and determine the optimal ANN network structure. The results of the developed ANN show its high performance, in sales forecasting.
The study was systematically advanced. After the independent variables were determined and the data set was created, the data cleaning and pre-processing steps were performed. The study consists of two data sets. The first group includes stores located in shopping centers (malls), while the other group includes all stores and brands located in the same city. First, the ANN model was developed for the shopping mall group. The results were obtained with the model with the least error rate in many experiments. It was aimed to investigate whether the same model is suitable for the other data set. The data was entered to the same ANN model and the network was trained. Although the training results (MSE) were low, the results in the simulated test group did not meet the expectations. The different neural network models are developed for the data set that includes all stores. The networks were trained by changing the number of hidden neurons and hidden layers and the test results were compared. Network models with error less than 20%are presented in the study. The overall error computed according to the weekly sales on store basis of this model was at acceptable levels.
In this study, it was focused on determining independent variables. In order to determine the most appropriate variables, the experts’opinion, literature research and the sales variables that can be affected the sales of this product group were decided according to the results of the analysis. So, new independent variables that were not used before were considered in the ANN based forecasting, in this study. These are weather temperature, discounts, number of customers visiting the stores, the store types and locations. Especially, for the retail chain stores, those independent variables were found to influence the demand, that is a new finding.
Besides, in order to see the performance of the estimation by time, time dependent regression analysis was performed. The results of the study showed that this method is not enough in terms of estimation performance. So, we conclude that only time series based forecasting is not suitable for demand forecasting, in retail fashion industry that has many external factors affecting sales.
When the results are examined in more detail, it is concluded that there are similarities or differences in the estimation results according to the information of the store such as location, number of customers. For this reason, after determining the characteristics and information of the stores as a future study, different ANN models can be developed for similar groups. In addition, product sales can be forecasted by adding new independent variables for future years.
In future studies, it is aimed to increase the data volume and to examine regional differences by using different algorithms based on ANN. Besides, for different product families for which past sales data exist, ANN method can be applied.