
Abstract
Companies need to know customer preferences for decision-making. For this reason, the companies take into account the Customer Relationship Management (CRM). These information systems have the objective to give support and allow the management of customer data. Nevertheless, it is possible to forget causal relationships that are not always explicit, obvious, or observables. The aim of this study on new methodologies for finding causal relationships. This research used a data analysis methodology of a CRM. The traditional analysis method is the Theory of Forgotten Effects (TFE), which is considered in this work. The new approach proposed in this article is to use Data Mining Algorithms (DMA) like Association Rules (AR) to discover causal relationships. This study analyzed 5,000 users’ comments and opinions about a Chilean foods industry company. The results show that the DMA used in this work obtains the same values as the TFE. Consequently, DMA can be used to identify non-obvious comments about products and services.
Keywords
Introduction
Nowadays, social networks have a high impact on companies. Daily, more companies obtain information about multiple data sources. This information is used to have control of the users’ comments about products and services [1]. Consequently, Business Intelligence (BI), marketing, and Data Mining Algorithms (DMA) have increased their popularity about the topic of computer science research. In the main researchers of BI and DMA, the methods used have been sentiment analysis, text mining, ontologies and opinion mining [2–4].
The events, phenomena, and acts that interact with the people are elements of some system. That is, causes-effects influence many peoples’ activities [51]. Although, companies have a precise control system, there is always the possibility of not considering or forgetting causal relationships. These causes-effects are not always explicit, obvious, or observables, and they are usually not detected directly. Commonly, the relationships’ effects remain hidden and, therefore, cause an accumulation of effects [5].
Human intelligence needs the support of tools and models that can create a technical basis for all the information. The tools and models must show all direct and indirect causal relationships. Causes and effects are significant to business strategies because these elements allow informed decision-making to improve customer service. For these reasons, the companies developed Customer Relationship Management (CRM), which has the objective to support a business strategy focused on the client and allow the management customer data. In this study, the customers’ interest data to companies are preferences and impacts [6–8].
Companies value the customers’ feedback about their products or services offered. This topic can be studied, for example, using the Forgotten Effects Methodology (FEM) [47–50] and DMA. Therefore, the customer-oriented approach is fundamental to the organizations that are focused on achieving customer satisfaction. It is essential to provide products and services that meet customer expectations [9].
According to the literature, sentiment analysis is one of the most commonly used techniques. This method allows pattern analysis in the customer data. BI studies customer satisfaction about products and services that organizations offer. The most use DMA are the Association Rules (AR) by apriori algorithm, e-commerce studies, and care service [6, 10–12]. Besides, other data extraction methods, like as Naïve Bayes and Ontologies, are used for investigations about service quality and sentiments analysis [3, 13].
The service quality of companies like Walmart and Kmart has been recently studied in [14] by social media analytics of Twitter and Facebook. Social media analytics refers to obtain data from social media platforms and analyzing the data to help decision-makers [15]. This process analyses the information of customers and competitors [15]. For example, in [16] has been analyzed the social media competitive of the three largest drugstore chains in the United States: Walgreens, CVS, and Rite Aid.
One of the most used DMA is sentiment analysis [2, 17]. The main application of sentiment analysis in BI has been the financial market prediction [18–20] and business review analysis [21–26]. On the other hand, [27] has studied the opinion mining for CRM by fuzzy formal concept analysis and sentiment analysis. [28] Has presented an approach for CRM by Data Mining (DM). The DMA used were Fuzzy c-means and AR. However, previous researches do not give a method to retrieve forgotten information.
DM is a set of techniques that allow the search of correlations between the data. These techniques generate strategic information for the business. On the other hand, this research paper proposes: DMA can be used to determine causes-effects and forgotten effects. Hence, DMA and FEM can determine the causes-effects of text data obtained from user opinions in social networks. This information serves as decision-making support for areas such as marketing [4, 29]. In this manuscript are used methods to provide additional knowledge for companies. That is, the previous methodologies serve to recover the forgotten knowledge of a company [30]. Therefore, we present a practical case study of a CRM data of a Chilean foods industry company. In this research, we compared the results of FEM and DMA. Besides, we evaluate the feasibility of automating the data analysis methodology of CRM by DMA [31].
The main contributions of this manuscript can be summarized as follows: (1) FEM is the actual methodology used to determine the cause-effect elements in BI. The FEM and DMA results are very similar in our approach. Hence, AR can be used to determine cause-effect elements. (2) This manuscript describes the main steps to determine cause-effect elements by FEM and DMA. These two methodologies are applied to a data set of a Chilean food industry company. This cause-effect results can be applied as customers’ recommendations. (3) The support, confidence, and lift of AR have been used to measure the cause and effect. As AR are DMA, we present the first approximation to discover forgotten effects by DMA. These algorithms are implements using high-level programming languages like R and Python. Therefore, the previous methodology can be easily automated.
The rest of the paper is organized as follows: Section 2 details the conceptual framework proposed for FEM. Section 3 exposes fundamental concepts about DM, explain AR and performance measures used in this research. Section 4 presents the results and discussion about the case of the study. Finally, Section 5 summarizes the main conclusions.
Forgotten effects methodology
Theory of Forgotten Effects (TFE) allows obtaining the relationship between data and getting the forgotten effects. According to [5] the events that interact with people are part of a system, which can be described as “causes” and “effects”. Although, companies have a good control system, there is always the possibility of forgetting causal relationships that are not always explicit, obvious, or observables. This work adapted the FEM to identify no-obvious content.
Figure 1 shows the FEM steps used: (1) obtaining coincidences between the causes; (2) obtaining coincidences between the effects; (3) obtaining coincidences between the causes and effects; (4) obtaining similarities using coincidences; (5) obtaining similarities between causes and effects using TFE, and (6) association map. These steps are exposed in the following sub-sections.
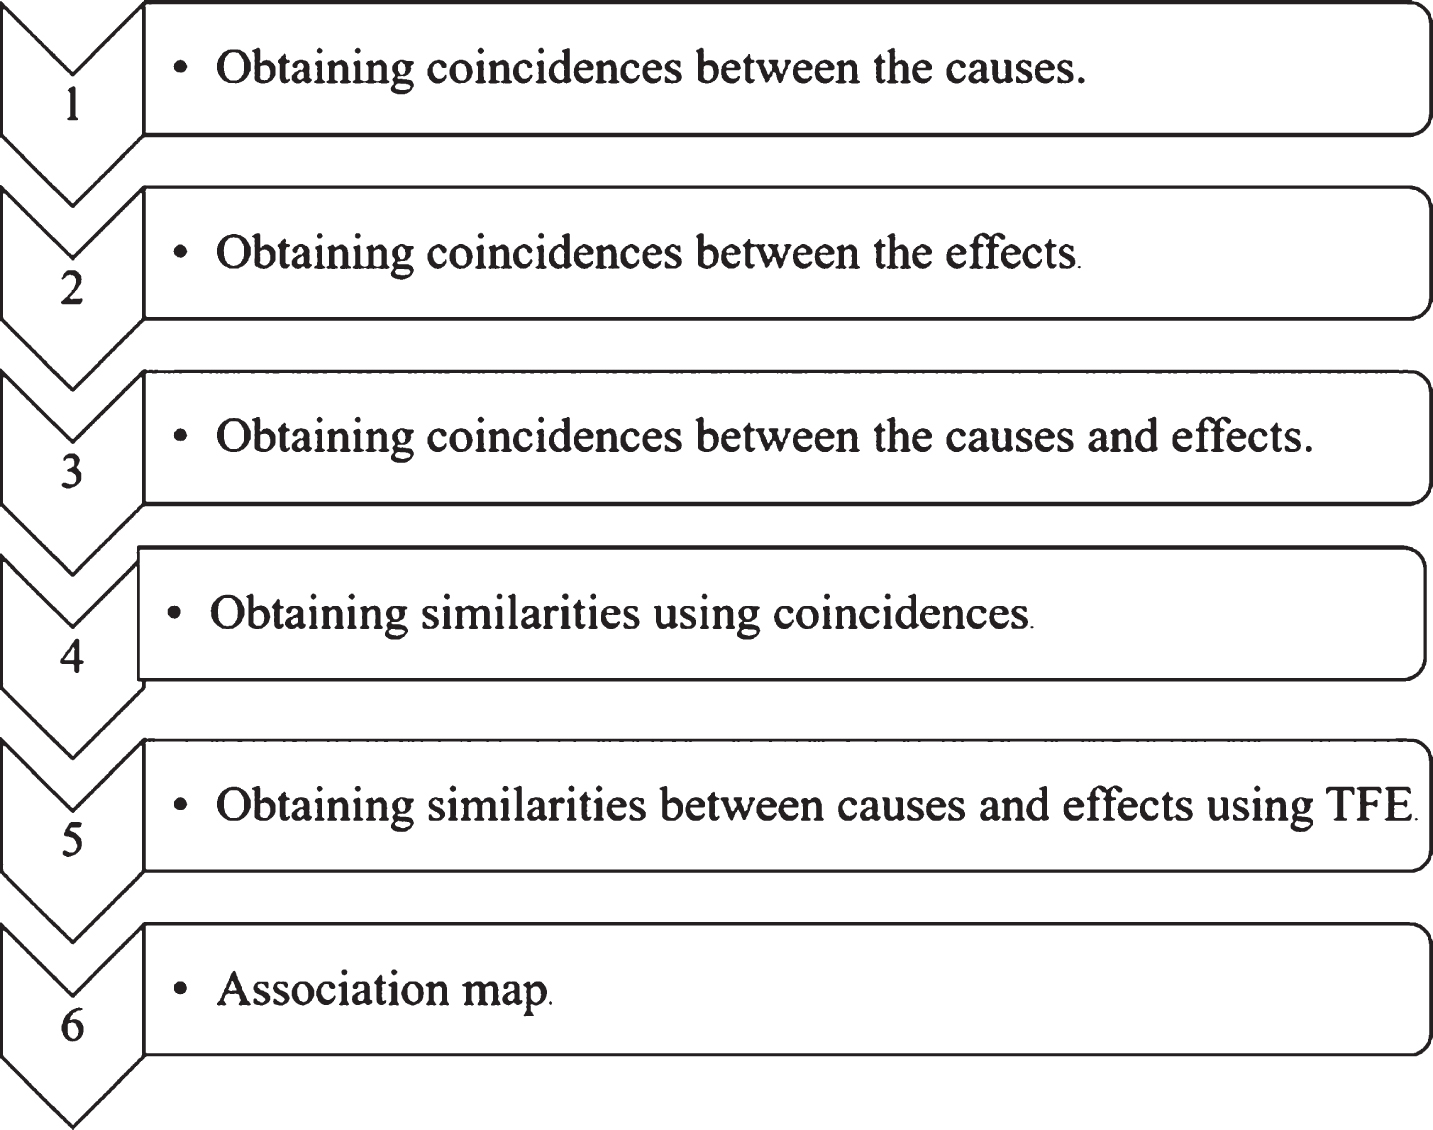
Steps forgotten effects methodology.
Table 1 shows cause matrix. A ij index represents the closeness between the causes. Therefore, A High index corresponds to close causes. The process for obtaining the cause matrix is the following: The first step is to define the object of study. The object of study corresponds to a keyword about the research topic. Then, the causes list is set. An expert (marketing manager) validates the causes. The coincidences correspond to the interceptions between the causes. For example, the formula for the coincidence between a1 and a2 is: “keywords″ + a1 + a2.
Cause matrix
Cause matrix
Table 2 shows the effect matrix. The same method was used as in the cause matrix (Table 1). In this step, the keywords associated with the effects is defined. B ij index represents the closeness between the effects. For example, the formula for the coincidences between b1 and b2 is: “keywords″ + b1 + b2.
Effect matrix
Effect matrix
Table 3 shows the cause and effect matrix. C ij index represents the closeness between causes and effects. Alike as in the previous steps, the coincidences correspond to the intersections between causes and effects. For example, the formula for the coincidence between the cause a1 and effect b1 is: “keywords″ + a1 + b1.
Cause and effect matrix
Cause and effect matrix
Jaccard similarity coefficient is used to calculate the similarities using coincidences [7]. Given two matrix, A and B. Where A represents causes, and B represents effects. Each matrix with n binary attributes. Each element of A and B can either be 0 or 1. The total number of each combination of attributes is specified as follows: M11 represents the total number of attributes, where A and B both have a value of 1. M10 represents the total number of attributes, where the attribute of A is 1 and the attribute of B is 0. M01 represents the total number of attributes, where the attribute of A is 0 and the attribute of B is 1. M00 represents the total number of attributes, where A and B both have a value of 0.
The Jaccard similarity coefficient, J, is given as:
The similarity index (S
C
) corresponds to the proximity between the causes and effects, where: C
cicj
is the coincidences between the cause a
i
and the effect b
j
, C
i
is the amount of match for the cause a
i
, and C
j
is the amount of match for the effect b
j
. It is defined as:
TFE is used to obtain all similarities between causes and effects. The following summarizes the rectangular matrix that will be used [5].
Let A be a set of elements, A = {ai/i = 1, 2, … , n}, which will be called causes.
Let B = {bj/j = 1, 2, … , m}, which will be called effects.
Let C be a third set of elements, C = {ck/k = 1, 2, …, p}, which act as effects of set B.
The expression v (a i , c k ) correspond to the set of pairs elements, which is known as the “direct incidence matrix.” [M ∼] will represent this matrix.
The max-min composition of matrices is the mathematical operator that sets the incidences of A on C. The formula (3) represent the relationship of a
i
over c
k
.
Causes-causes are noted in the incidence matrix for the set as [A ∼], and effects-effects as [B ∼]. A new matrix of incidences between the elements of A and B is obtained by composition [M ∼ *] = [A ∼] ° [M ∼] ° [B ∼]. This result composition represents indirect causal relationships.
An association map is a graphic representation of the elements in a cartesian plane [32]. The causes and effects are represented by multivariable analysis, which is a technique to adjust the distribution of the items [33]. The distribution evaluates the distance between the different elements. [M ∼ *] adjust the causes, and [M ∼ *] ’ transposed adjust the effects. The tool used for multivariable analysis was the Statistical Package for the Social Sciences (SPSS) [34].
The distances between the causes were observed. The closest causes are the most similar causes. Also, the effects were correlated. The distance between the causes and effects allowed interpreting aspects of cause-effect similarity.
Data mining
DMA extracts concise and useful knowledge of available data. [35] defines these methods as a “set of techniques used for information discovery in a large dataset.” There are two DM task: (1) predictive tasks, and (2) descriptive tasks. Predictive tasks infer unknown or future values. Examples are classification and regression. Descriptive tasks find data describing patterns, relevant information. Examples are AR and clustering.
Association rules
AR is a technique links data set attributes using some association. This method examines the dataset, and then, these techniques identify the frequent co-occurrence [36]. Although, AR are not specific causes and effects rules, in our case study, the cause and effect relationship is validated by the results of FEM.
Consider X and Y (two items set), X → Y defines the AR, X is called antecedent, and Y is the consequence. AR use three performance measures: support, confidence and lift. The support designates the proportion of data that contains the items set X and Y. This measure determinates the overall impact of the AR. On the other hand, the confidence designates the conditioned probability that contains Y in a conditioned rule that also contains X [37, 38]. Lift denotes how efficient the rule compared with the random selection of set items. If the lift is greater than 1, the rule has weight compared with the random match about antecedent and consequence [39]. The AR has been used in BI for itemset mining, wich generates more profitable itemsets and the association among these itemsets [40].
The Apriori Algorithm has been used in this study. This algorithm does multiple searches in the data set. Based on the frequency of an item set is use to obtain the AR [37]. A rule is defined as an implication of the form, X → Y where X intersection Y equal 0.
Result and discussion
This section shows the results of a case study by FEM and DMA. First, the case of the study is presented. Then, the application results of FEM: coincidences between the Chilean Regions, coincidences between categories, coincidences between regions and categories, similarities using coincidences, similarities using TFE and association map. Finally, this section shows the application of DMA.
Case of study
The first step has been to get comments and opinions from the CRM data of a Chilean food industry company. The users (customers, consumers, suppliers, and applicants) enter requests, inquiries, or complaints. Therefore, positive and negative users’ comments about products and services are known. For the application of the methodology, the region and category have been defined. A region is the country’s first-level administrative division for Chile. The regions represent the causes, and the categories are the effects. Table 4 shows a description of the fields of the users’ comments.
Field description data set
Field description data set
In this study, a Chilean foods industry company gives us 5,867 users’ comments for this BI analysis. These records are obtained from the CRM of “Productos Fernández S.A.”
The following sections show the results of the Forgotten Effects Theory.
Application of the FEM
The following sub-sections show the results of the FEM: coincidences between the Chilean Regions, coincidences between categories, coincidences between regions and categories, similarities using coincidences, similarities using TFE and association map.
Coincidences between the Chilean regions
This work answers the following research question: what is the interaction of users on the company’s website? Therefore, the interactions of the site in the regions and the coincidences between regions have been counted. For this analysis, an Excel pivot tablet has been used. This table of statistics summarize the data of a more extensive table. The regions used in this study have been 13. The Table 5 shows the code and name for each region.
Chilean regions. Roman numeral code
Chilean regions. Roman numeral code
Table 6 shows the coincidences between the 13 Chilean regions. The Maule region (VII), and the Metropolitana region (XIII) are important for this study because the food industry company is located in VII region. The XIII region is the Capital of Chile, which has more than a third of the Chilean population. For example, the matches between the VII and XIII region are 2,176 (marked cell). A large coincidence number corresponds to a high similarity between the regions. The previous result indicates the high interactions of people with the company’s website in these regions (VII and XIII). The table shows that the coincidences between the XI and XII are 25. On the other hand, the coincidences of the VII region are 3,712, and the coincidences of the XIII region are 4,246.
Similarities between Chilean Regions
Table 6. Coincidences between Chilean Regions. The marked cell corresponds to the matches between the VII and XIII region. The company studied belongs to the VII region, and the capital of Chile is the XIII region.
Table 7 shows the categories list defined by a marketing manager. The categories are 13 because the number of elements must be equal to the number of regions (matrix definition for TFE, Section 2.5). Table 8 presents the coincidence matrix between these categories, which has been calculated by the analogous procedure of Table 6. For example, the matches between Quality (1) and Work with us (11) are 3868 (marked cell). The coincidences in Collaborators (3) are 36, the same value than in Transportation (12).
Categories list. These categories have been defined by a marketing manager
Categories list. These categories have been defined by a marketing manager
Coincidence matrix between categories. Matches between Quality (1) and Work with us (11) are 3868 (marked cell)
Table 9 shows the matrix coincidences between regions and categories. As with previous steps, the coincidences between regions and categories have been counted. For example, the matches between VII (Maule) and Quality are 107 (marked cell). The XIII region and I want to be a customer have 403 coincidences. The columns of the XI and XII region have values 0 in most categories.
Coincidences between regions and categories. Marked cell shows the matches between Quality and VII (Maule)
Coincidences between regions and categories. Marked cell shows the matches between Quality and VII (Maule)
Table 10 shows the similarities obtain by coincidences. The formula of similarity (Sc) used for this calculation is (2). Values closer to 1 correspond to higher similarity. Values closer to 0 correspond to lower similarity. The cell market is the highest similarity, which is the XIII region and I want to be a customer (9). As in Table 9, the columns of the XI and XII region have values 0 in most categories.
Similarities between regions and categories. Marked cell shows the matches between I want to be a customer and XIII (Metropolitana)
Similarities between regions and categories. Marked cell shows the matches between I want to be a customer and XIII (Metropolitana)
Table 11 shows the incidence matrix [M ∼ *]. The max-min composition of matrices establishes the indirect causal relationship. Every category has the same value for each one region.
Similarities using TFE. The rows 1 to 13 have the same value. This table represent [M ∼ *]
Similarities using TFE. The rows 1 to 13 have the same value. This table represent [M ∼ *]
In the following, the results are presented graphically. An association map presents the elements of the study in an area. Figure 2 shows the association map obtained by IBM statistics tool SPSS and Correspondence Analysis. The map display position of regions and categories. The distribution evaluates the distance between the different elements. [M ∼ *] adjust the causes, and [M ∼ *] ’ transposed adjust the effects. The distance evidence the similarity. The nearest regions have a higher similarity. Close categories have a higher correlation [41]. For example, the categories: Transportation with Credits and payments.
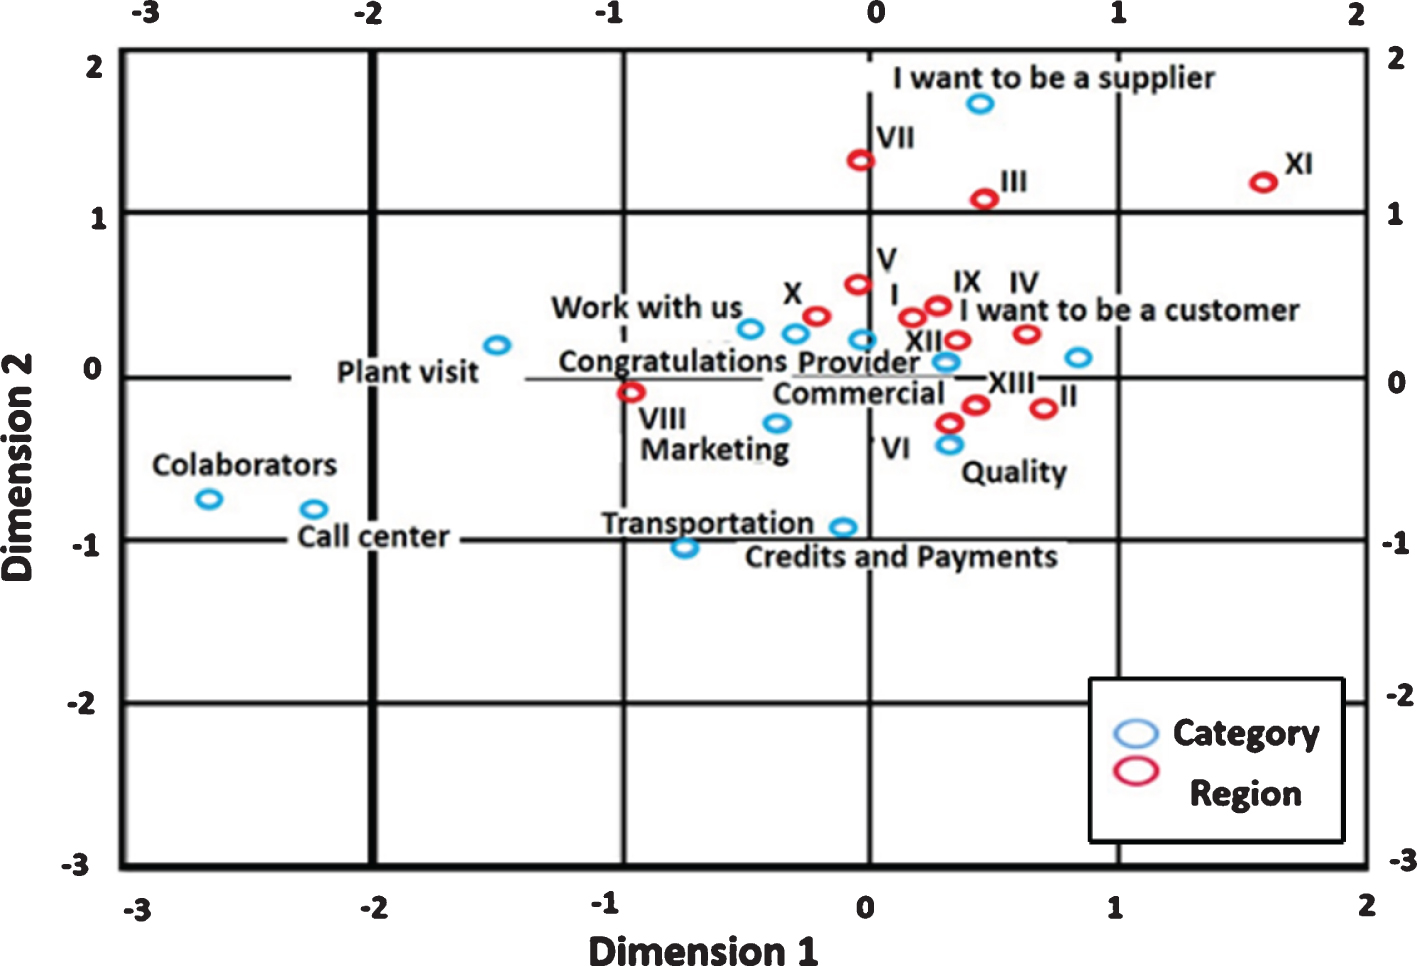
Association map. Categories marked in blue, and regions marked in red.
The distance between the cause and effect explains the causes close to each other. For example: I want to be a customer with the XIII region. The association map has two dimensions. The categories or “incidents categories,” mostly define dimension 1. Dimension 2 determines the regions.
Free computational statistics software R (2018) [42] has been used, specifically Apriori Algorithm [43] by packages arules and arulesViz [44, 45]. This Algorithm is a technique to find associations between many variables by using an intelligent search level for frequent itemsets. Based on work [46] has been employed a support of 0.01 and confidence of 0.35. Table 12 shows 10 first AR obtained by this algorithm. The first rule is the set of items that appears most frequently in the data set, namely the co-occurrence for the category: I want to be a customer in the Metropolitana region. The second and third rules possess the same support and also have the same frequency, which is quantified by the TFE. Table 13 shows confidence. The two previous rules differ in confidence. In the Table 13 the first rule is plant visit in Maule region and the second rule is I want to be a customer in Metropolina region. Confidence means Cause-Effect relationships more than support. Therefore, this performance measurement can be used to compare the results of the Apriori algorithm with the TFE.
AR ordered by support
AR ordered by support
AR ordered by confidence
Table 14 shows the lift measurement. As in Table 13 the first rule is plant visit in Maule region. Only the last rule has a lift less than 1. In particular, this rule has a frequency less than expected under independent conditions. If the last rule is suppressed because this rule does not exceed a threshold 1. Rule 5 is deleted, which is the same rule 4. The eight rules are as follows. Regarding the region: (a) three rules about Maule; (b) three rules about Metropolitana; (c) one rule about Araucania (d); and one rule about O’Higgins. The other hand in terms of the category: (a) three rules speak about work with us; (b) one rule about plant visit; (c) one rule about marketing; (d) one rule about I want to be a customer; (e) one rule about quality; and (f) one rule about commercial.
AR ordered by lift
Figure 3 shows a graph of the AR considering the lift. Highlighting the following rules: (1) I want to be a customer in Metropolitana region; (2) Work with us in Maule region; (3) Quality in Metropolitana region; and (4) Marketing in Maule region.
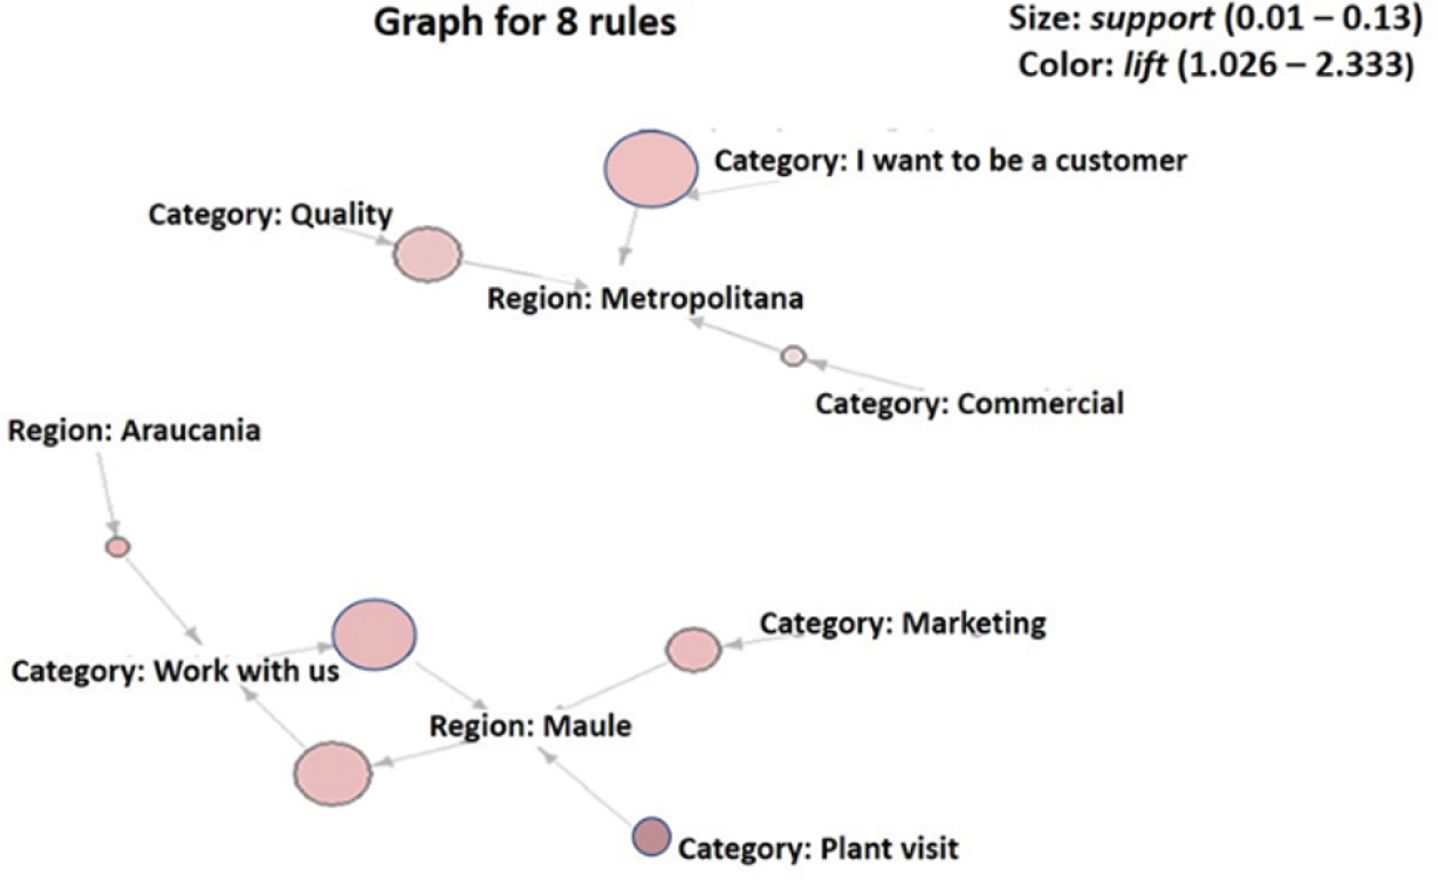
Graph of the AR by lift. The size bubble represents the support. Color intensity denotes the lift.
Figure 4, shows the bubble chart of the ten rules with higher confidence. The biggest bubble represents the rule: I want to be a customer Metropolitana region.

Matrix of 10 rules with the highest confidence. As Fig. 3 the size bubble represents the support. Color denotes the lift.
Figure 5 shows an association map that is very similar to the previous Fig. 2. This graphic describes the majority of the variables in dimension 1. This association map has been obtained by analysis of similarities. This method is a statistical technique used for evaluating by graphical viewpoint, the dependent and independent relations of a categorical variable set from a contingency table. This analysis is a DMA that strengthens the results of the Apriori algorithm (Figs 3 and 4).

Graph of the correlation between variables. Dimension 1 describes 71.2% of the data, and dimension 2 describes 9.5% of the data. Blue circles represent categories, and red triangles denote regions.
The traditional analysis BI of causal relationships is TFE. Causes and effects, which are not always explicit, obvious, or observables, are useful to discover new knowledge. This causes-effects and incidences allow to support for the decision-making and creating of indicators not considered, such as highlighted elements by the customers. This information is useful for organizations that need analyzing customers’ opinions and changing the focus to determine where there are problems in the company. The literature presents several DMA studies for different tasks for BI in recent years. The commons topics research of DMA for BI has been: e-commerce studies, care service, sentiments analysis, and service quality. However, the actuality research of DMA for BI does not present forgotten effects. Therefore, we proposed a new approach for discovering the forgotten effects. For this task has been used AR, which are not necessarily causes and effects. In this study, the AR algorithm has found the same relationships as FEM. Therefore, AR serves to find forgotten effects.
This document presented an analysis of comments and opinions from the Chilean foods industry company. FEM analyzed coincidences, similarities between Chilean regions and categories. The method shows the regions and categories with more coincidences. The analysis of this information between regions and categories shows the most relevant relationships in Tables 6, 8, 9, 10. Association map (Fig. 2) denotes relationships between categories and regions. As well, the distances between different variables are observed. This analysis presents that FEM has the same results as AR. The AR were ordered by support, confidence and lift. These results allow to obtained rules, which determined the most important regions and categories for the company. These rules have been represented by a graph of association and a matrix of rules (Figs. 3, 4). The graph of the correlation between variables is presented such as association maps in Fig. 5, which is highly similar to the previous association map obtain for FEM (Fig. 2). In this study, these results strengthen the DMA. The previous algorithms are implemented by high-level programming languages such as R and Python. Therefore, the proposed is the first approach DMA for forgotten effects that are easily automated.
For future investigations, it is proposed to continue reviewing other DMA to support the results obtained by applying the FEM. Thereby, to detect new indicators or strengthen this existing. Additionally, it is a task to find DMA that support the FEM in each one of the steps of this methodology.
The main limitations of the investigation are the characteristics of the CRM systems’s databases. Because these usually do not have text data standardized, purified and classified. So, to develop the data mining process it requires cleaning and classifying the data of the base, then an ETL (extract, transform, load) process is performed, and then filter and extract classified data, finally create a groundwork on which you can apply the Theory of Forgotten Effects (TFE) methodology. In the process of text classify errors or loose of information can occur.
Author contributions
Conceptualization, A.U.-S. and C.N.-A.; Data curation, F.R.-O.; Formal analysis, F.R.-O.; Funding acquisition, A.U.-S.; Investigation, R.A.-G., A.U.-S., F.R.-O. and C.N.-A.; Methodology, F.R.-O.; Project administration, A.U.-S. and C.N.-A.; Resources, A.U.-S.; Supervision, A.U.-S. and C.N.-A.; Validation, C.N.-A.; Writing - original draft, A.U.-S., F.R.-O. and C.N.-A.; Writing - review & editing, R.A.-G. and A.U.-S.
Funding
This research was funded by Department of Computer Science and Industry, Faculty of Engineering Science, Universidad Católica del Maule; and School of Economics and Business, Universidad Santo Tomás.
Conflicts of interest
The authors declare no conflict of interest.
Footnotes
Appendix: Abbreviations
The following abbreviations are used in this manuscript:
Association Rules Business Intelligence Customer Relationship Management Data Mining Data Mining Algorithms Forgotten Effects Methodology Theory of Forgotten Effects Statistical Package for the Social Science
Acknowledgments
This project is supported by “Red Iberoamericana para la Competitividad, Innovación y Desarrollo” (REDCID) Project NO. 616RT0515 in “Programa Iberoamericano de Ciencia y Tecnología para el Desarrollo” (CYTED).