



Abstract
This paper presents a system that allows for the identification of two values: arousal and valence, which represent the degree of stimulation in a subject, using Russell’s model of affect as a reference. To identify emotions, a step-by-step structure is used, which, based on statistical data from physiological signal metrics, generates the representative arousal value (direct correlation); from the PANAS questionnaire, the system generates the valence value (inverse correlation), as a first approximation to the techniques of emotion recognition without the use of artificial intelligence. The system gathers information concerning arousal activity from a subject using the following metrics: beats per minute (BPM), heart rate variability (HRV), the number of galvanic skin response (GSR) peaks in the skin conductance response (SCR) and forearm contraction time, using three physiological signals (Electrocardiogram - ECG, Galvanic Skin Response - GSR, Electromyography - EMG).
Keywords
Introduction
The relationship between personality and emotions has been extensively reviewed in social psychology [1–3]. Eysenck’s theory proposes that extroverted people require more external stimulation than introverted people, and that neurotic people are more easily stimulated [4–6]. However, there are few works that have conducted research into this direct relationship on a computational level. An example of the use of emotional recognition and personality traits is found in [7], where a database was created with information from individuals who took the Big Five personality test and underwent a laboratory experiment where they watched a series of videos while their physiological responses, such as ECG, EEG (Electroencephalography), GSR, facial expressions, etc. were captured. In some studies, where the relationship between personality and emotion in an individual has been investigated, it was found that Eysenck’s concept of extraversion is correlated with the parameters of Russell’s idea of arousal, and that in the same way, neuroticism is inversely correlated with the parameters of valence [8–10]. In other works, emotions were investigated through facial expression recognition [11–13] and in different areas, such as, emotion recognition in social networks [14], emotions in video games [15], emotion recognition using simple recurrent units network and ensemble learning [16], automatic emotion recognition from the analysis of body movement [17], among others.
For the proposed work, two sources of information will be used to identify the emotions in each of the four quadrants of Russell’s model of affect, which is correlated with the Eysenck model. For the arousal axis, three physiological signals are used (ECG, GSR, EMG), the characteristics of which are directly related to the excitation and relaxation of the individual’s BPM, HRV, SCR and forearm contraction time. For the valence axis, the PANAS questionnaire (Positive and Negative Affect Schedule) is used, which is a questionnaire that includes 20 elements to measure positive and negative affect, developed by Watson, Clark and Tellegen [18]. With these two sets of metrics, two values are obtained, which will be correlated with Russell’s model of affect.
Materials and methods
The project is focused on the development of a prototype system which can record, analyze and extract metrics related to the activation of the sympathetic and parasympathetic autonomic nervous system, from the ECG, EMG and GSR signals of an individual while they are playing a video game. These metrics can then be related to the Eysenck model in order to identify personality traits. Fig. 1, shows a schematic of the system architecture implemented, which identifies the elements by which the individual will be evaluated, and the visual reports that will be delivered to the professional in charge of analyzing and evaluating the personality of the subject from the resulting data.
For the implementation of the software application, five sections were defined that integrate its basic functions in order to display the information:

Block diagram of the emotion and personality traits recognition system proposed.
This shows graphic and quantitative information of the three signals (ECG, GSR, and EMG) using graphs, recording time indicators, sample frequency and the number of samples acquired simultaneously.
Signal conditioning panel
This shows the information of the three signals, in graphic form, recorded before and after the application of filtering techniques for noise reduction.
Analysis panel
This shows, both graphically and quantitatively, the metrics extracted from the three signals (Fig. 2).
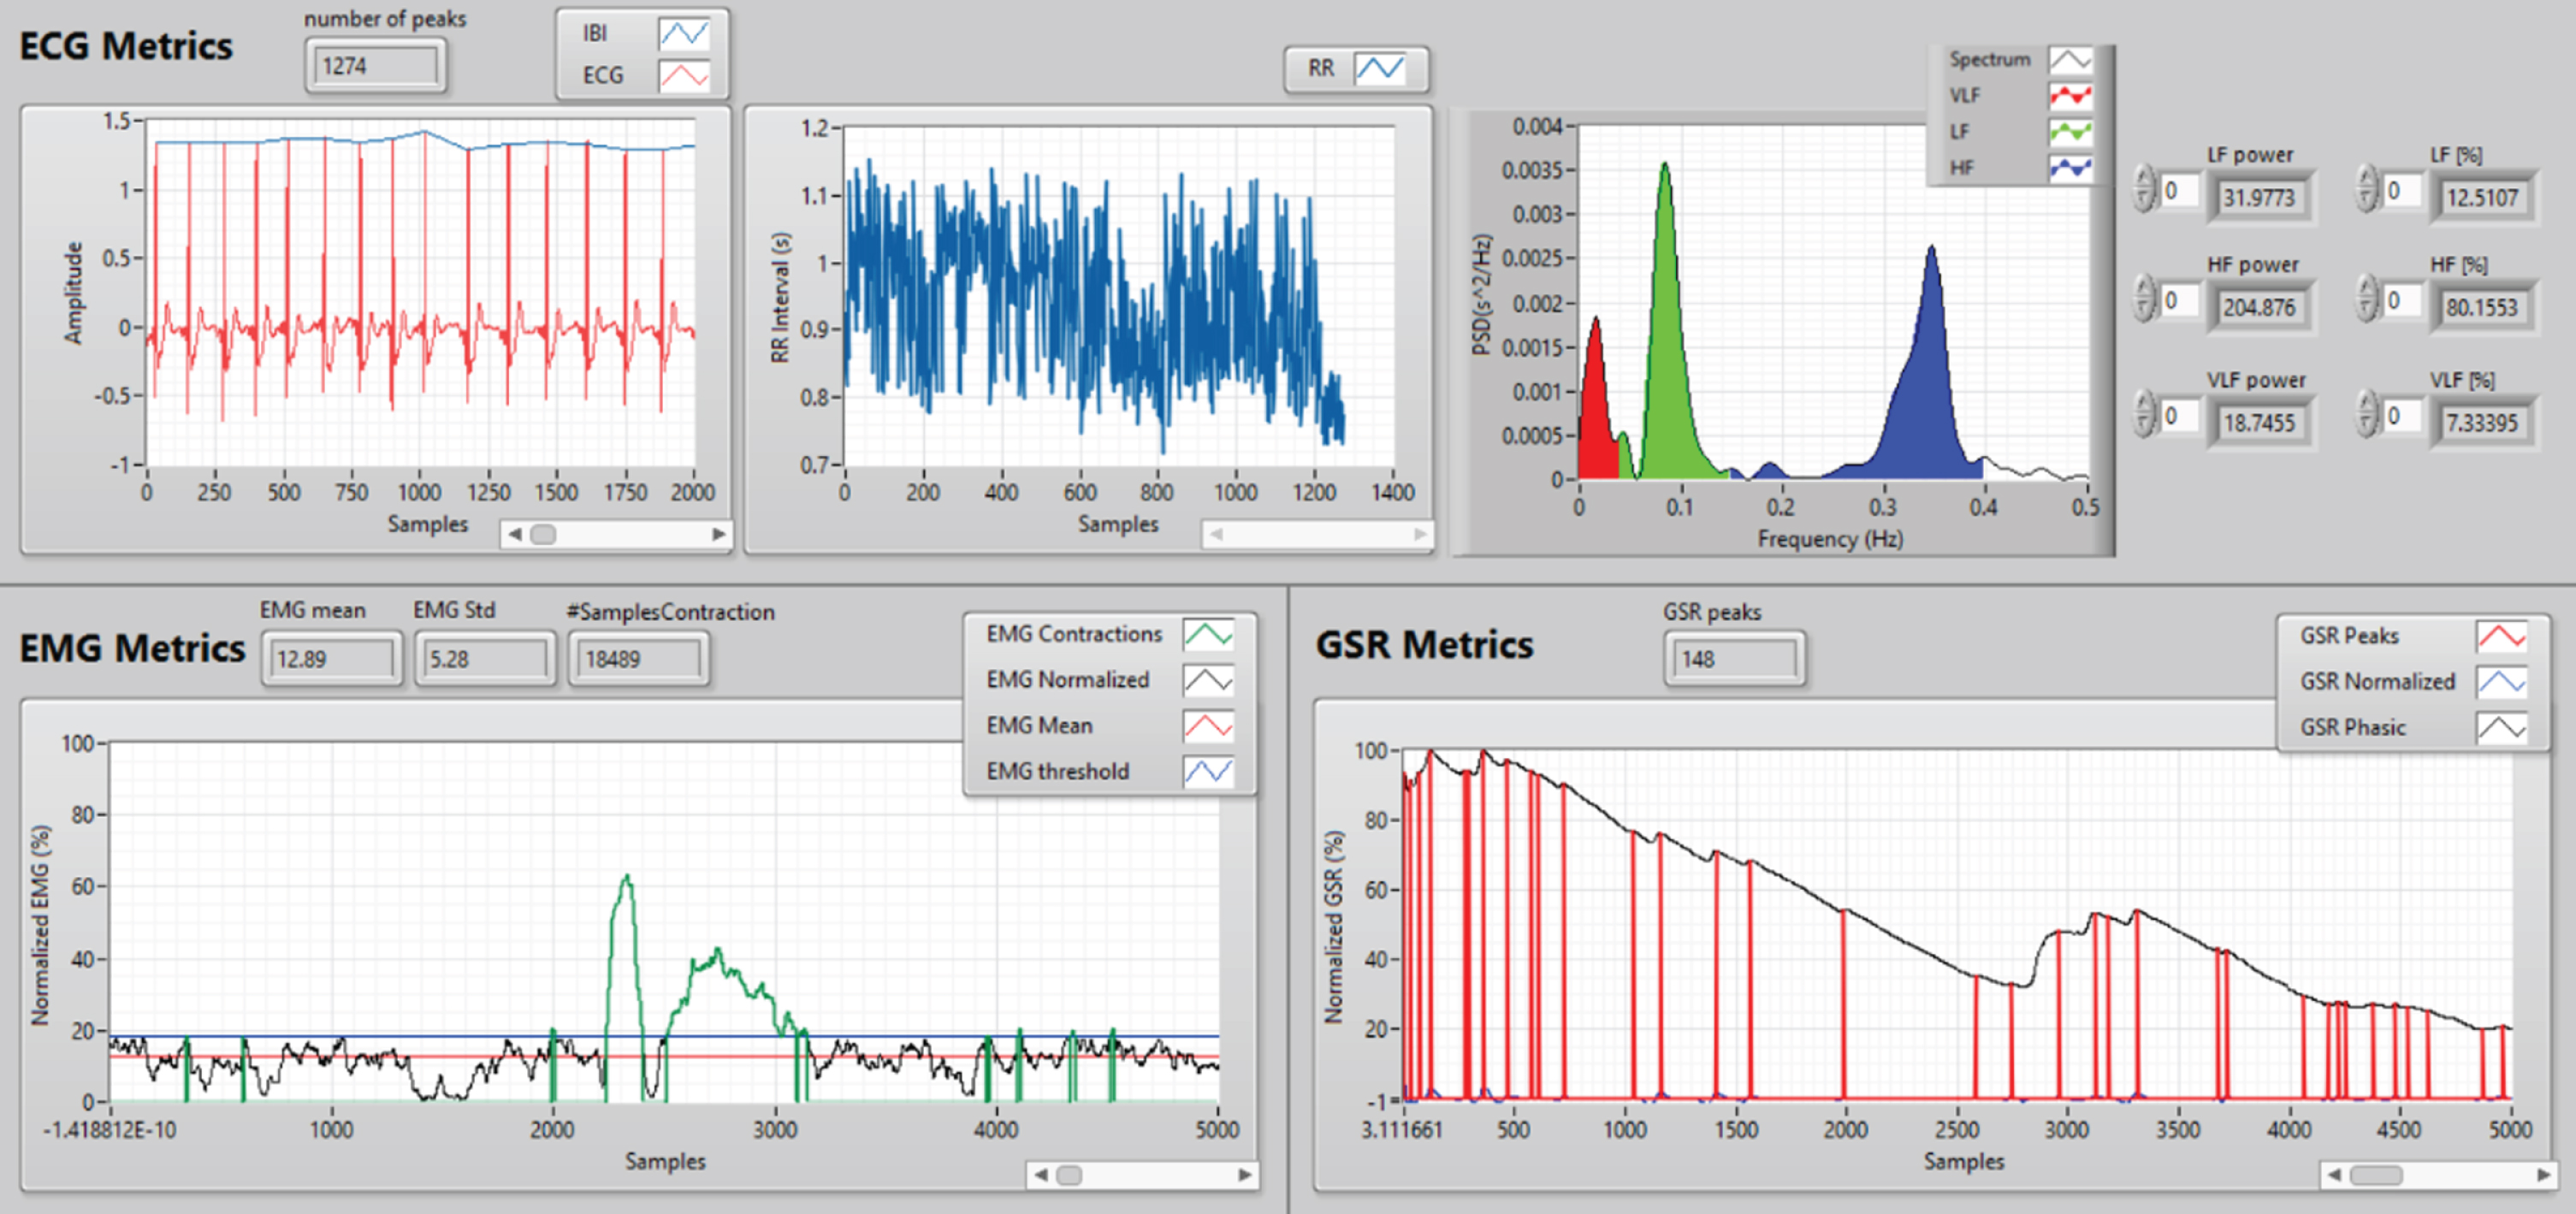
User interface for the visualization of the physiological signals metric extraction process.
This allows the input of the information corresponding to the results of the EPI personality test as well as the answers to the questions from the PANAS form (Fig. 3).

User Interface to enter EPI values and answer the PANAS questionnaire.
This allows for the visualization of the information corresponding to the results of the EPI personality test and the results obtained from the PANAS form and the physiological signals related to Russell’s model of affect.
Information on metrics and questionnaires
In order to identify and describe the behavior of these four metrics, and their relation to the arousal axis of Russell’s model of affect, an alignment sequence (Fig. 4) is implemented, corresponding to two different time windows from an experiment in which a subject was evaluated. First, the metrics must be collected when the subject is in a state of relaxation (from 3 to 10 minutes), the longer the recording, the more accurate the average from the metrics within the defined time window will be. From the average of the four metrics, both a positive and a negative threshold are calculated, adding and subtracting the standard deviation from the average.
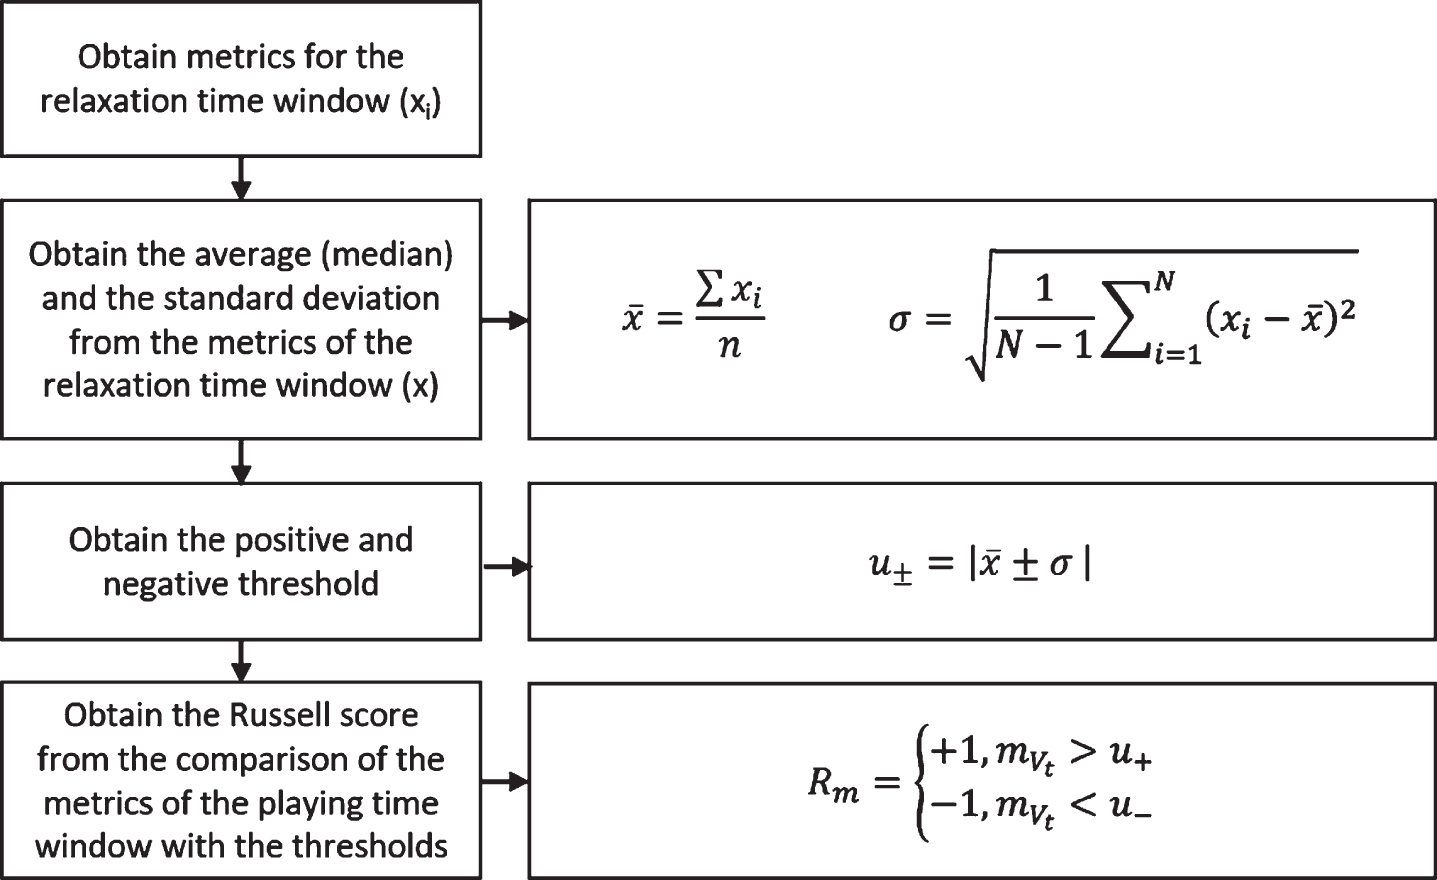
Flow diagram of the proposed sequence to calculate the arousal score (Russell’s model).
Then, the metrics are recorded at 60-second intervals within the time window in which the subject is playing the video game (from 15 to 20 minutes approximately). Each of these values will be compared to the average and to the thresholds obtained during the relaxation state time window. If the value from the metric is higher than the positive threshold, a + 1 to the arousal score is counted; if the value from the metric is lower than the negative threshold, a –1 to the arousal score is counted. The resulting score gives a reference value that indicates the arousal level of the subject.
In order to perform the correlation with the valence axis of Russel’s model of affect, the values of the PANAS questionnaire are gathered. The questionnaire is answered immediately after the application of the stimulus (video game) and the EMG, GSR and ECG signals are registered. These values will be compared with the result of the EPI questionnaire, which must be completed prior to the test.
Once the prototype metric detection system that will allow the identification of the emotion and its correlation with personality traits has been built, it is necessary to select the tool to be used to stimulate emotions in the individual. According to a study conducted by Nick Yee [19], the choice of a specific video game genre is directly related to the personality traits of the player. In this study, the personality model proposed by the Big Five is used as a reference to relate personality traits and video game genres. In the study carried out by Yee, video game genres are related to 3 personality types: extroversion, conscientiousness, and openness to experience. From these relationships, three different groups are created: action - social, mastery - achievement, immersion – creativity. From the results, the video game is selected based on two basic criteria: the first is that the video game should not belong to categories that are directly related to extroversion, so that the video game has no direct influence on extroverted or introverted personalities; the second criterion is that it should be a virtual environment that provides tasks or challenges that the individual must solve with low-medium difficulty and with a relatively short introduction to the game. This is so that the individual does not spend most of the test’s duration trying to understand the story of the virtual environment, but instead interacting with the tests.
From these criteria, a puzzle-type video game was chosen, which tests the ability of the player to solve problems that may be of a mathematical, spatial or logical nature. Within this genre, the video game Portal 2 was selected, which is a first-person, single-player video game of logic and consists of a series of puzzles that must be solved by teleporting the character as well as simple objects using a device that can create interspatial portals.
Results
The participants of the study were fifth and ninth semester students of the Electronic Engineering undergraduate program: 16 students from the fifth semester and 19 students from the ninth semester. The EPI test was applied by means of a Google form which was filled out by the 35 students, from which the three scores (Extroversion, Neuroticism and Lie) were obtained. A filter was made based on the students’ score in the Lie item, which registers how socially desirable a subject is trying to be with their answers, with values from 0 to 9. Those who received a score of 5 or higher in this field were not considered for the study. After applying the filter, the number of students was reduced to 20. Finally, prototype tests were performed on 11 students (those who wished to participate in the project) out of the 20 who were selected based on the result of the EPI. Of these 11 students, 6 were in fifth semester and 5 in ninth semester, 3 were women and 8 were men.
In order to perform the system tests, a series of tasks were defined as necessary, in which three important stages are summarized. The first stage is that of relaxation, which ensures that the metrics of the physiological signals of the individual reflect a state of calmness. This time window serves as a reference in order to compare the metrics recorded during gameplay. The second stage refers to the individual interacting with the video game. The signals are recorded and the metrics for each minute are registered, both during the period of relaxation and while playing the video game. The third stage consists of the entry of the previously obtained EPI values and those from the PANAS questionnaire provided by the individual being tested, as well as the data from a graph of the behavior of each of the metrics, which summarizes how the individual felt during the gaming session.
An inter-core i7 computer with 12GB of memory and an NVIDIA GTX 860M graphics card with 4GB of memory are used to run the emotion detection software, the video selected for the relaxation phase and the video game. As additional hardware, a monitor, a keyboard and a mouse are used as external peripherals to the main computer equipment, which the individual will manipulate during the test. The work space is adapted and the following activities are carried out: Sensors are connected to the body of the subject by means of disposable electrodes to record the ECG and the EMG signals. Pads with electrodes are also attached for detecting the GSR. Data acquisition tests are performed, evidencing that the signals are being registered correctly by the software. Headphones are used to isolate ambient noise, and focus the subject’s attention on the sounds of the video game.
Once the subject is ready, with the sensors and other elements correctly placed on the body, the test protocol is applied (Fig. 7) with a duration of approximately 25 minutes, performing the following activities in sequential order:
Video playback with relaxing music (3 min): This step aims to ensure that the individual is in a state of passivity and relaxation. The signals are recorded and metrics extracted while the subject is in this state. These will serve as a basis for the comparison of the autonomic nervous system activity together with the metrics extracted while the individual is playing (Fig. 5). Interaction of the subject with the video game (16 min): During this period of time the individual interacts with the video game. Depending on their performance, they are able to advance in the game, encountering challenges of greater difficulty. Throughout the process, the test supervisor can observe the signals being recorded in real-time, without interrupting the individual’s gaming session (Fig. 6). Entering the EPI values: In this step, once the recording of the signals is completed, the person responsible for monitoring the test enters the values of the individual’s E, N and L scores, which were obtained earlier, into the software. Entering the PANAS questionnaire answers: In this step, the test supervisor will administer 20 questions to the participant. These consist of a series of 20 adjectives to which the individual responds with a quantitative value, referring to the degree to which they had been experienced during the test. The responses are then entered into the software by the test supervisor. Obtaining the visual values in the graphs displayed in the user interfaces for the analysis, correlation and detection of emotions: After entering all the necessary information into the software, the results will be displayed graphically so as to be interpreted by the test supervisor. Both the values taken from the EPI and Russell’s model of affect are shown, which displays the consolidation of the signal metrics and the PANAS questionnaire. Producing an Excel report with the data of the signals and metrics: Finally, in order to have a record of the test, a report is created in Excel containing all the information generated by the software. Screen capture of the user interface of the signal and a video recording with relaxing music. Screen capture of the user interface of the signal register and video game. Subjects testing the prototype system.


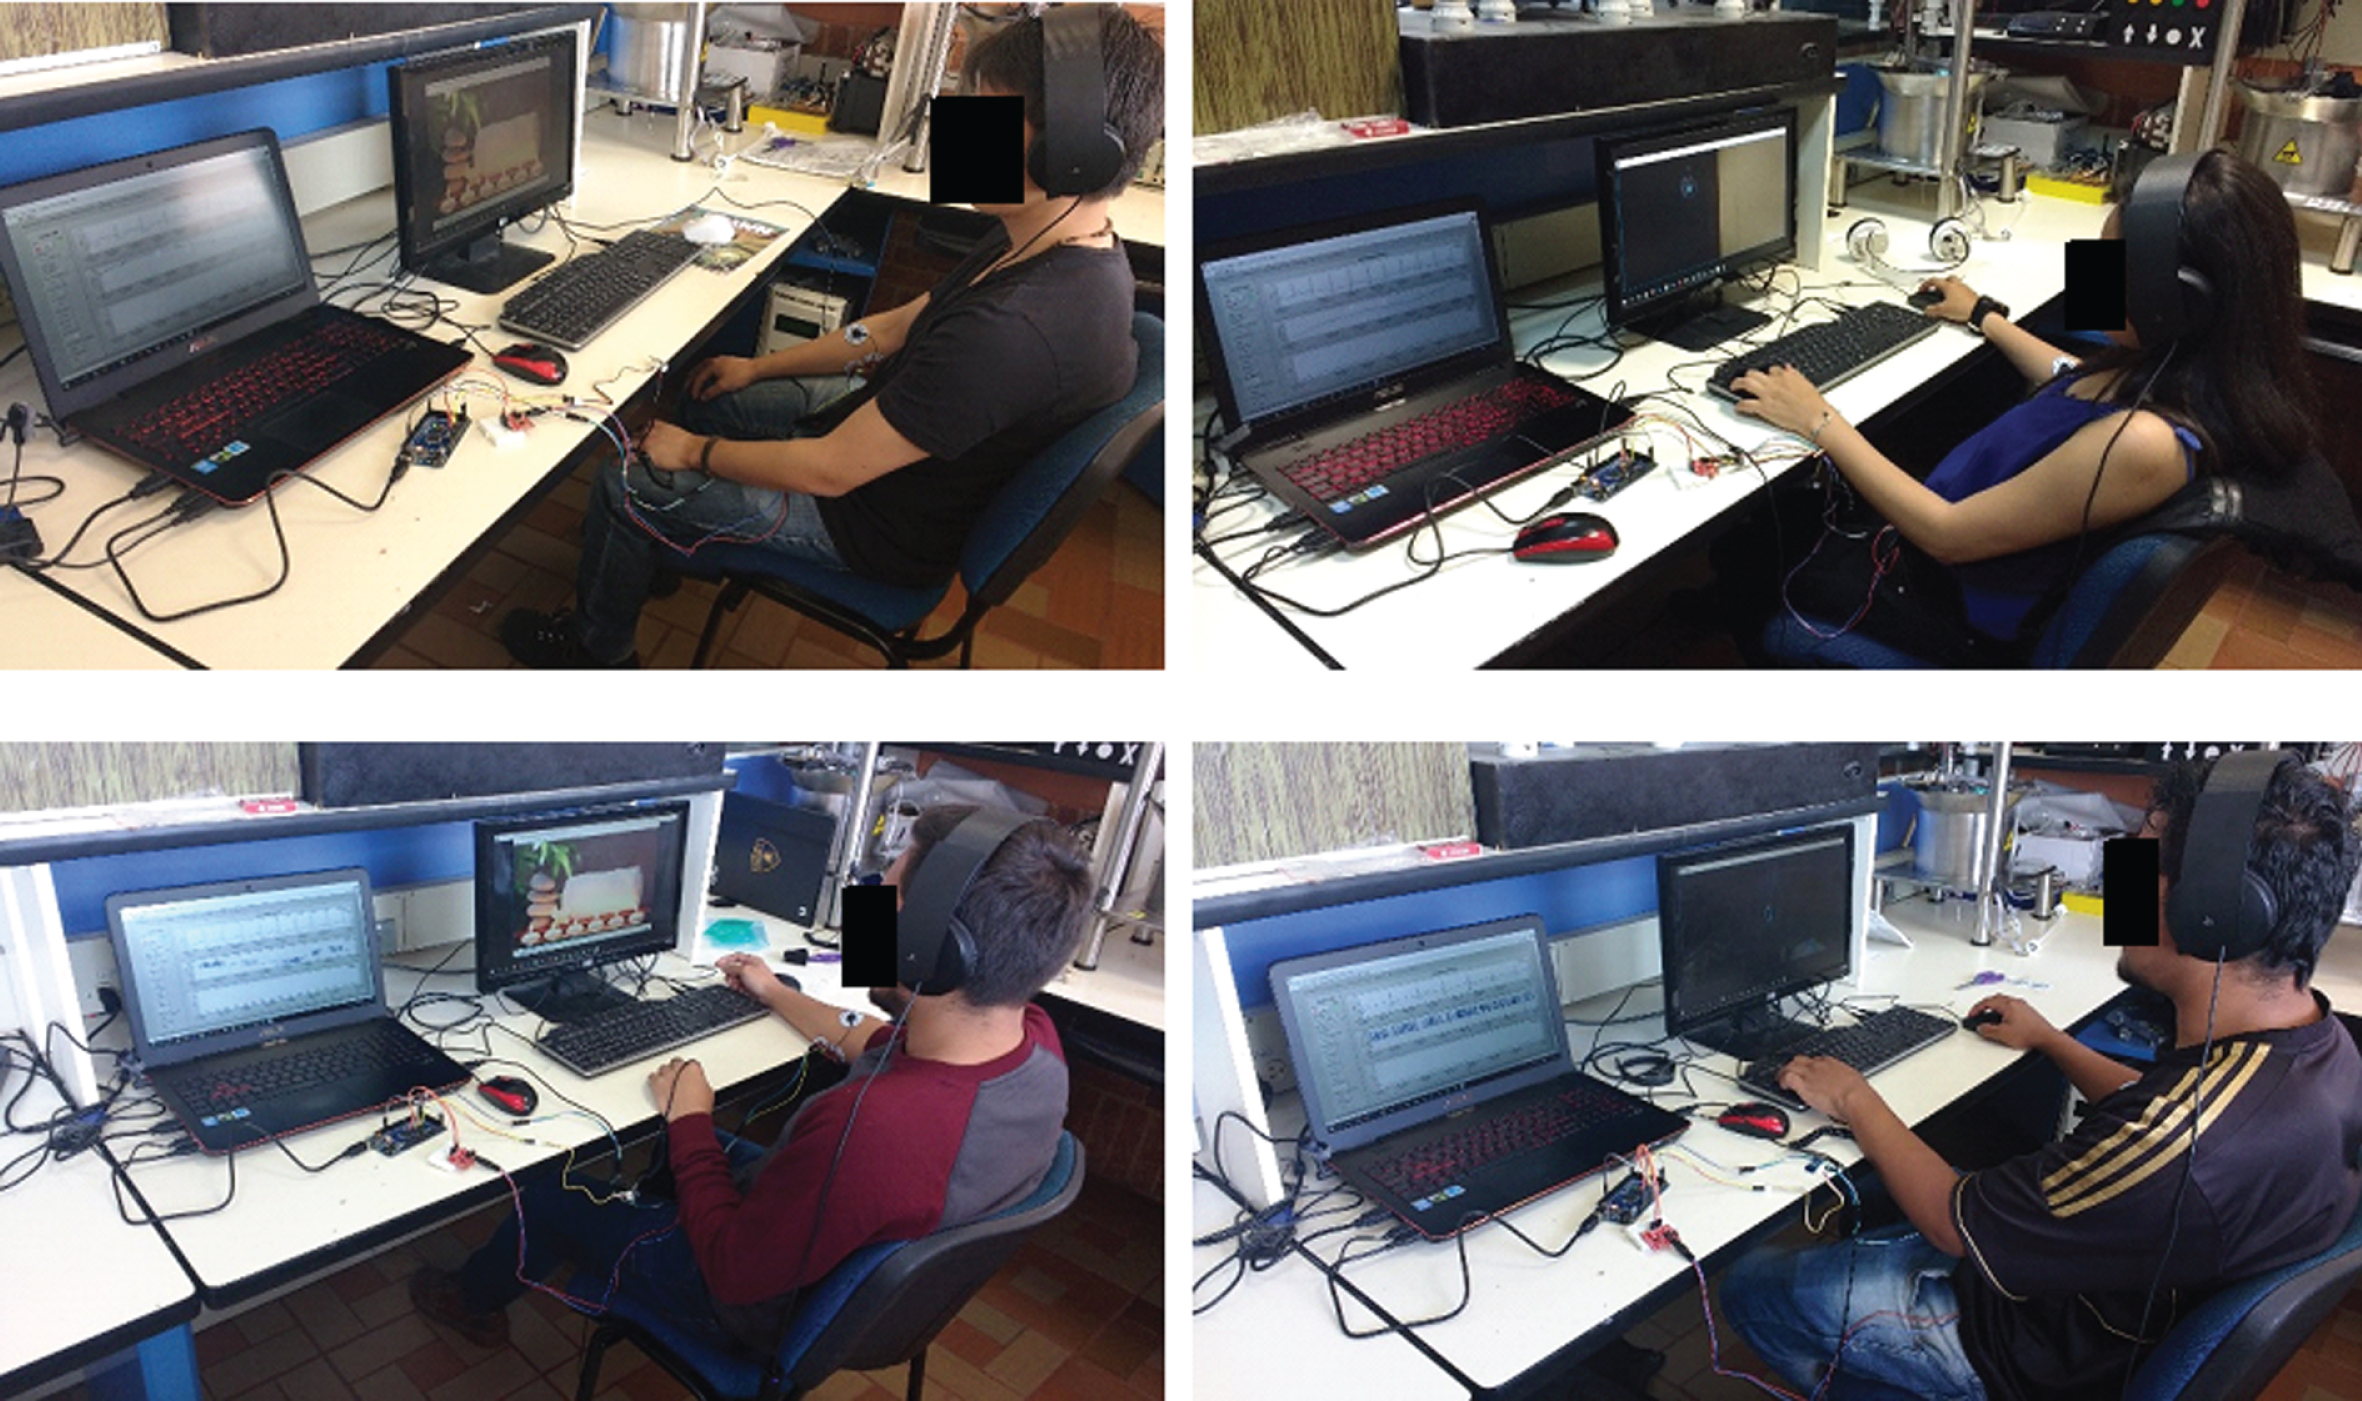
Table 1 shows a summary of the results of the two questionnaires (EPI and PANAS) applied to the 11 test participants, together with a comparison of them. In the case of subject 5, the registered GSR signal was not used as there was too much background noise and the respective metrics could not be recorded adequately.
Results of the EPI - PANAS questionnaires of the 11 subjects
Results of the EPI - PANAS questionnaires of the 11 subjects
In Fig. 8, it is possible to see the results of a subject’s test and these are reflected in the EPI-RUSSELL interface. The results are shown graphically, so as to have a clear idea of the behavior of the metrics and questionnaires for each of the subjects.

Visual comparison between the results of the signals of subject 1 with a sanguine personality.
Once the results were gathered for each of the 10 subjects, the values were entered into Table 2 in order to summarize the performance of the platform when identifying emotions and personality traits. To organize the information, the following values were taken into account: the PANAS questionnaire indicator, the indicators of the GSR, BPM, HRV and EMG metrics, the personality identified by each signal and, finally, the personality type resulting from the answers to the EPI.
Relationship between the results of the signals and the PANAS questionnaire with respect to the personality type resulting from the EPI questionnaire
In green, the values can be observed that coincide with the considered indicator of the Russel model: in this case, the activation axes (signals) and the valence axis (PANAS), and the value of the extraversion and neuroticism axes of the EPI model, respectively.
With regard to the PANAS questionnaire, an 80% success rate is seen between the valence axis of the Russel model and the axis of neuroticism of the EPI model. The two cases in which the values did not coincide refer to the subjects with choleric personalities.
With respect to the GSR signal indicator, there is a 70% accuracy between the activation axis of the Russel model and the extraversion axis of the EPI model.
Regarding the HRV signal indicator, there is a 60% success rate between the axis of activation of the Russel model and the axis of extraversion of the EPI model.
With respect to the indicators of the BPM and EMG signals, a correlation of only 30% is seen between the activation axis of the Russel model and the extraversion axis of the EPI model.
Finally, there is a column after each of the signal indicators which shows the personality type resulting from the model with respect to each of the signal metrics. As two of the results of the PANAS questionnaire are incorrect, this implies that the correct detection percentage of the model, with respect to the GSR and HRV signals, is 50 and 40 percent, respectively. More information in [20].
In the development of the research, once the test protocol had been applied to the 10 participants, the following conclusions were reached.
A system was designed for the recording, analysis and extraction of the metrics of the ECG, EMG and GSR signals associated with the activation of the sympathetic and parasympathetic nervous system that represent emotional activity during the interaction of an individual with the commercial video game PORTAL 2, without the use of artificial intelligence, as the first phase of the project.
The developed system does not depend on any particular emotional stimulus being applied to the individual; that is, the system would work with any type of audiovisual stimulus. The system is applicable to a wide variety of fields with the use of different stimuli in the form of multimedia files, such as audio, video, images, etc.
The system can work with different video game manipulation and viewing devices, since the positioning of the sensors and the recording of the signals are not affected when using keyboards, joysticks or control pads. In the study carried out, a keyboard, a mouse and an external screen were used for the manipulation and visualization of the game. These devices did not compromise the recording of the signals and gave the individual freedom of movement while playing the game.
Throughout the study and the systematic review of the literature, it was observed that the fields of emotion recognition and “personality computing” are relatively new. The investigations that are carried out begin with the registration and the correlation of the registered information in order to determine discrete emotions in an individual in a predetermined time window, leaving it open to the researchers to decide on the test protocols that must be used to provide conclusive data. From this information, a system was proposed for the identification of the emotional activation of an individual based on the statistical thresholds of the registered metrics. This allowed for the observation of how the signals of the individuals behaved during the testing period, achieving a measurement of the emotional state based on the three proposed signals.
Although the EMG and BPM signals are considered in the literature to be indicators of the behavior of the autonomic nervous system, they did not perform well when identifying the personality of the individual (30% correct), which implies a need to rethink, firstly, the use of the heart rate metric, and secondly, the location of the EMG sensor, so as to gather valid information about the manifestation of stress in the body of the individual who is being tested.
The next step of the research is to record a greater amount of data in order to achieve an effective correlation of the signals among individuals and design a classification model for each of the personalities using recognition techniques, such as metrics, classification algorithms and artificial intelligence. Likewise, the use of measurement tools for EEG signals is proposed in order to collect data on valence that does not depend on the application of questionnaires, such as PANAS.