
Abstract
Under the influence of the COVID-19 epidemic situation, many countries have taken many measures to control the flow of people. The inability of people to gather makes art color measurement a problem. Color matching and coordination and color space conversion have always been the research focus of art color measurement. This paper studies a method of fuzzy intelligent reasoning in art color measurement. Based on case-based reasoning and rule-based reasoning, this method is an important self-learning and self-maintenance method in the field of artificial intelligence and expert system. On the basis of expounding the basic characteristics of color and color space, this paper designs the process principle of case-based reasoning and the process of rule-based reasoning. In this paper, case and rule knowledge representation method, case retrieval technology and rule conflict resolution strategy are established. Based on the above strategy, the color case base is established. In addition, the rule table is established by combining color-brewer with rule reasoning and referring to color-brewer. The rule table has a certain reference value for the application of intelligent reasoning method in the field of art color measurement under the influence of COVID-19 epidemic.
Introduction
Currently, the novel corona virus pneumonia continues to affect many countries and regions around the world. Among them, the overall situation of prevention and control in Latin America is grim. Facing COVID-19 epidemic, many countries have recently strengthened epidemic prevention and control measures. The inability of people to gather makes art color measurement a problem.
In graphic design, the role of color cannot be ignored. When one open a graphic, the most striking thing is the color [1, 2]. As a very important visual variable, color, if used properly, can simplify the graphic symbols, make the theme elements clear, and improve the readability of graphics. According to people’s psychological feeling and general cognition of color, we can give the meaning of color hint to the figure, so as to increase the bearing capacity and expression capacity of the figure [3]. By using the relationship among hue, saturation, brightness and quantity change, the quantitative characteristics of temperature change, birth rate and mortality can be transferred [4] Contrast color and analogy color can be used to express the internal structural features of theme elements; color coordination can improve the use value, visual experience and expression effect of graphics. If you choose the wrong color, the whole graphic will be very prominent, such as too many colors, color and user data are not appropriate, which will cause the interference when the reader understands the graphic information. Although color variables have a great influence on the drawing of graphics, there are still many problems in the use of color, such as the psychological effect of color, symbolic meaning, sense of warmth and cold, sense of space, sense of distance and so on. Color matching and coordination and color space conversion have always been the research content of art color measurement [5, 6]. How to choose colors for different representation methods and how to choose color schemes for different data types or single variable multivariate data are the research focuses of the art color.
Color space and its mutual transformation
The so-called color space, that is, a point in the three-dimensional space as a color, to measure it, it is a method of color measurement. At present, there is not a color system that can describe all colors completely [7–11]. Due to the different functions and suitable fields of various color spaces, it is necessary to study the conversion between color spaces. In general, we transform a color space into a device independent color system, which is called the intermediary color space, and then transfer to the target color system.
Basic color space
The color space provided by GIS software mainly includes RGB, Hex, HSV, HSL, CMYK, LAB, HVC, etc. In these color spaces, RGB is an additive color system, mainly used for on-screen display, CMYK is a subtractive color system, mainly used for printing, HEX is a 16-character numerical color system, from 0 to 9, plus A to F, a total of 16 characters. HEX is a derivative of RGB color system and can be used to display maps in HTML web pages. In HEX, 0 means no color value, and Fmeans saturation. RGB, CMYK and HEX color systems in ColorBrewer are shown in Figs. 1, 2 and 3.

RGB color system.

CMYK color system.
HEX color system.
HSV(HSB) is very similar to RGB in setting three values for each color. Hue varies from 0 to 360, saturation from 0 to 1.0, and value from 0 to 1.0, usually S and V are expressed as percentages. HSV is a very convenient color system when it is necessary to keep hue unchanged and adjust saturation and lightness values. HSL color model is the same as HSV in hue component. When the saturation value and brightness value of color are important to you, both color models are convenient. In addition, HSL and HSV contain more human visible colors than RGB. Lab can describe all visible and invisible colors. This is based on a 3D model, and l represents brightness. Web color system, also known as s RGB color space, which is the standard RGB color space, is designed for web designers. The color gamut is smaller than RGB. The three color systems of adobe products are shown in Figs. 4, 5 and 6.
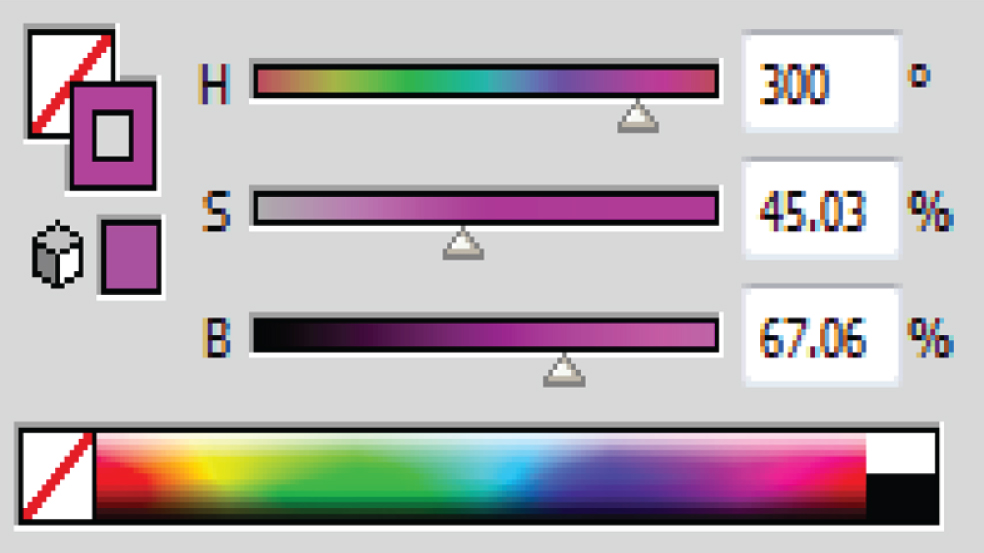
HSB color system diagram.

Web color system diagram.
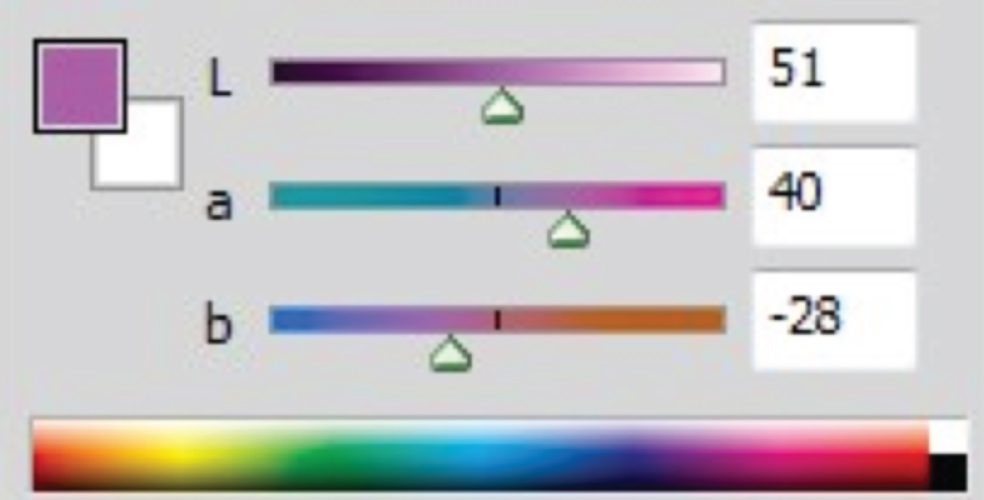
Lab color system diagram.
The classification of color space can be divided into device related color space, device independent color space, and TV system color space generated by the needs of radio and television. Among them, the color space which has nothing to do with the equipment is the uniform color space. When the two color spaces cannot be directly converted, the uniform space is often used as the transitional color space for conversion. The specific classification is shown in Table 1 below:
Color space classification
The problem of color space conversion is more complex, because the transformation between the two color systems involves many uncertain factors such as model algorithm and human visual perception. However, in order to meet different application needs, such as from display screen to digital printing to television system, people still need to study the transformation of color space.
Some color spaces can be directly converted, such as RGB ⟶ CIEXYZ, RGB ⟶ HSB, RGB ⟶ HSV, etc., but some color spaces cannot be directly converted, which requires the use of some color spaces unrelated to the device, such as CIEXYZ, lab, etc. for transition.
1) RGB to Lab
The relationship between RGB and tristimulus value of chromatography can be obtained from the conversion of chromaticity coordinates:
2) CMYK to Lab
Experts and scholars have a lot of model algorithms about CMYK to Lab. Liu Shiwei (2007) of Xi’an University of science and Technology (Xi’an University of science and Technology), based on the Japanese plane theory, verified the two color space conversion equations through experiments:
The values of L, A and B in the above-mentioned three formulas can be measured by spectrophotometer. The three equations have three unknowns. The values of C, M and Y can be obtained by solving the unary quadratic equation. The values of C + K = C,M + K = M,Y + K = Y can be substituted into the above-mentioned equation and the corresponding values of C, M and Y can be obtained by setting the value of K. Therefore, the conversion models of the two color spaces are obtained. After verification, the error between the calculated value and the measured value is small and the conversion accuracy is high.
Effective use of color scheme
The data to be matched can be divided into multivariate data and binary data from the qualitative point of view, and continuous data and divergent data from the quantitative point of view. If only one variable in the thematic map is color matched, it is called single variable color setting. If two variables in a thematic map are colored, it is called bivariate coloring. Color matching of three or more variables usually matches visual variables such as shape and texture. For single variable color setting, the above four data types correspond to four color setting schemes. For bivariate color setting, six color schemes are obtained by combining four data types.
Single variable color scheme
Two metadata color setting, namely gray scale scheme, generally represents only two possible data phenomena: Yes or no, right or wrong, yes or no, etc. variable change is represented by brightness contrast, usually represented by gray scale, black represents the lowest value, and white represents the highest value.
Multi data color setting, that is, rainbow scale scheme, fixed saturation and brightness, through color change to reflect the change of variable value. There are some defects in this representation method, for example, for those who are not familiar with the spectrum, it cannot give people an intuitive change in the order of quantity from large to small. In addition, because the yellow color in the visible spectrum is the brightest, using the rainbow colorimeter scheme will make people feel that there is an abnormal value or a maximum and minimum value in the middle of the variable, which leads to the wrong communication of map information.
For continuous data color setting, the thematic elements with sequence characteristics can be represented by the change of color saturation, so that the number of saturation gradations is the largest, and the colors between the two levels can be distinguished by the human eye; the sequence or grade characteristics of thematic elements can be represented by the gradual change of brightness by keeping the color phase unchanged; the interpretation can be realized by the change of light and shade of the achromatic series; and over keeping the saturation and brightness unchanged, we use different hues of the same color system to deduce.
Divergent data color setting, also known as the two endpoint colorimetric scale scheme, this scheme can be used to express the changes of high, low, and median thematic elements, such as from red to gray to blue. The middle value uses low saturation color. The part from the middle value to positive / high value or from the middle value to negative / low value can be treated as continuous data color scheme.
Bivariate color scheme
Bivariate color setting can be basically carried out according to the organic combination of single variables, such as in multivariate / binary metadata color setting, the multivariate data type corresponds to the change of color phase, and the binary metadata corresponds to the change of shade. Only divergent data / divergent data is used for color setting, and the color superimposed at last is not the simple superposition of two sets of single variable divergent data colors.
Change of color value when changing grading number
Ask questions
For the above-mentioned four single-variable coloring schemes and several double-variable coloring schemes, the case base basically has corresponding legends. In the process of implementing the thematic map intelligent coloring system, if we have obtained the case with the highest similarity to the case to be matched according to the similarity matching algorithm and applied it to the case to be matched, we will often make minor adjustments as required. This paper mainly studies the classification statistical map in the statistical thematic map. If you want to modify the classification number of data, how does the color of each level change after the increase or decrease of the classification number? Are the different data types and the changed algorithm models the same? How should the color after the re classification be assigned in the system? Figs. 7, 8, 9 and 10 show the visual impression when the number of data grades of different data types in colorbrewer changes.
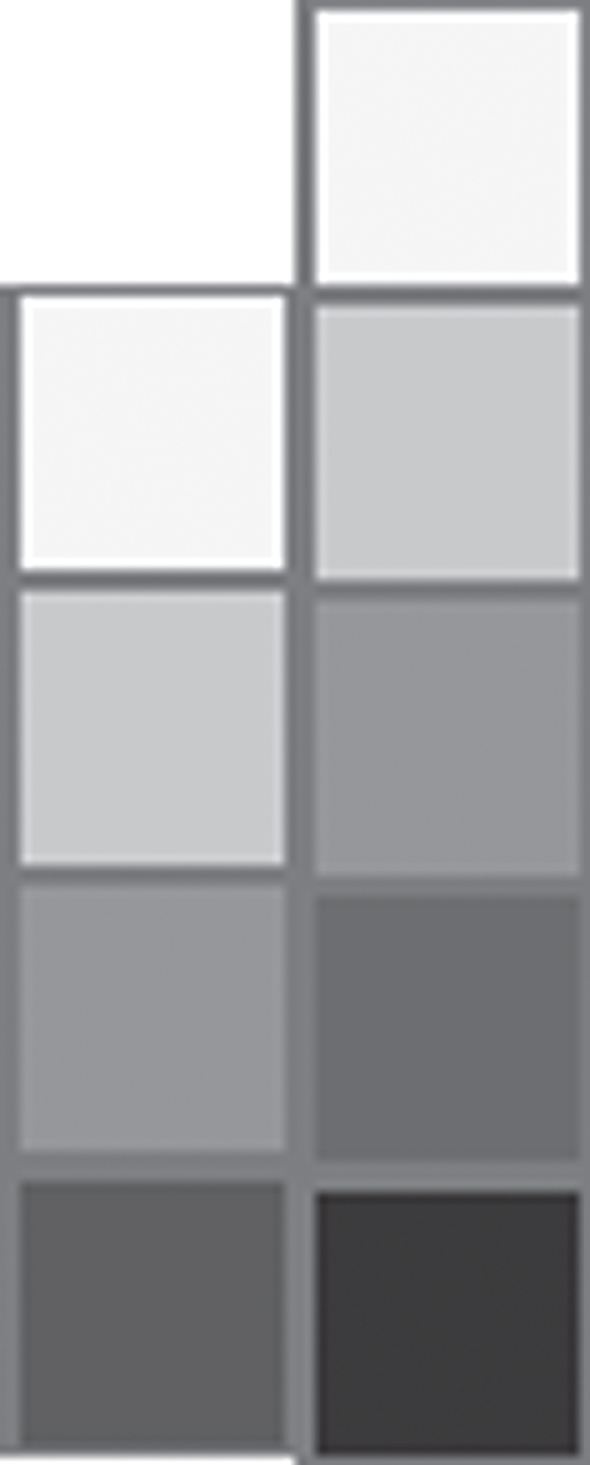
Metadata map.

Continuous data graph.

Divergent data graph.

Multivariate data graph.
Computer processing image data is mainly based on pixels, and the image is composed of colors. Therefore, to realize the operation of gradual change or equidistant change between colors, only the functional relationship between pixels needs to be established. Here we mainly discuss two-color gradient interpolation model, three color gradient interpolation model, and linear interpolation equidistant model.
The colors in web design are mainly expressed in RGB or hex mode. The forms in the standard include:
Colors = {color:#ff0000}
Colors = {color: #f00}
Colors = {color: rgb (255,0,0)}
Colors = {color: rgb (100%,0%,0%)}
Colors = {color: (0, 1, 0.5, ‘hsl’)}
Colors = {color: (0, 1, 1, ‘hsv’)}
Colors = {color: ("hsl(0,100%,50%)")}
Colors = {color: (53.24, 80.09, 67.20, ‘lab’)}
Colors = {color: (53.24, 104.55, 40, ‘lch’)}
It is mainly expressed in the first form, such as:
chroma.colors = colors =
Indigo: “#4b0082",
Gold: “#ffd700",
Hotpink: “#ff69b4",
Firebrick: “#b22222",
Indianred: “#cd5c5c",
Yellow: “#ffff00",
Mistyrose: “#ffe4e1",
Darkolivegreen: “#556b2f",
Olive: “#808000",
Darkseagreen: “#8fbc8f",
Pink: “#ffc0cb",
Tomato: “#ff6347",
Lightcoral: “#f08080",
Orangered: “#ff4500",
Navajowhite: “#ffdead",
Lime: “#00ff00",
Palegreen: “#98fb98"
For multi-color gradient or isometric interpolation, it is expressed in the form of array set.
1) Interpolation Algorithm of Two Color Gradual Change
Taking RGB color space as an example, first mark the points of the two colors to realize gradual change in the three-dimensional model, observe their changes, and connect the two points into a line segment. To realize two-color gradual change, the following functions representing red line segments in the color model should be calculated, in which the color values of the points at both ends of the line segment have been given. Because the two colors are gradual change, only a simple one-dimensional linear interpolation function is required. The RGB color space is shown in Fig. 11.
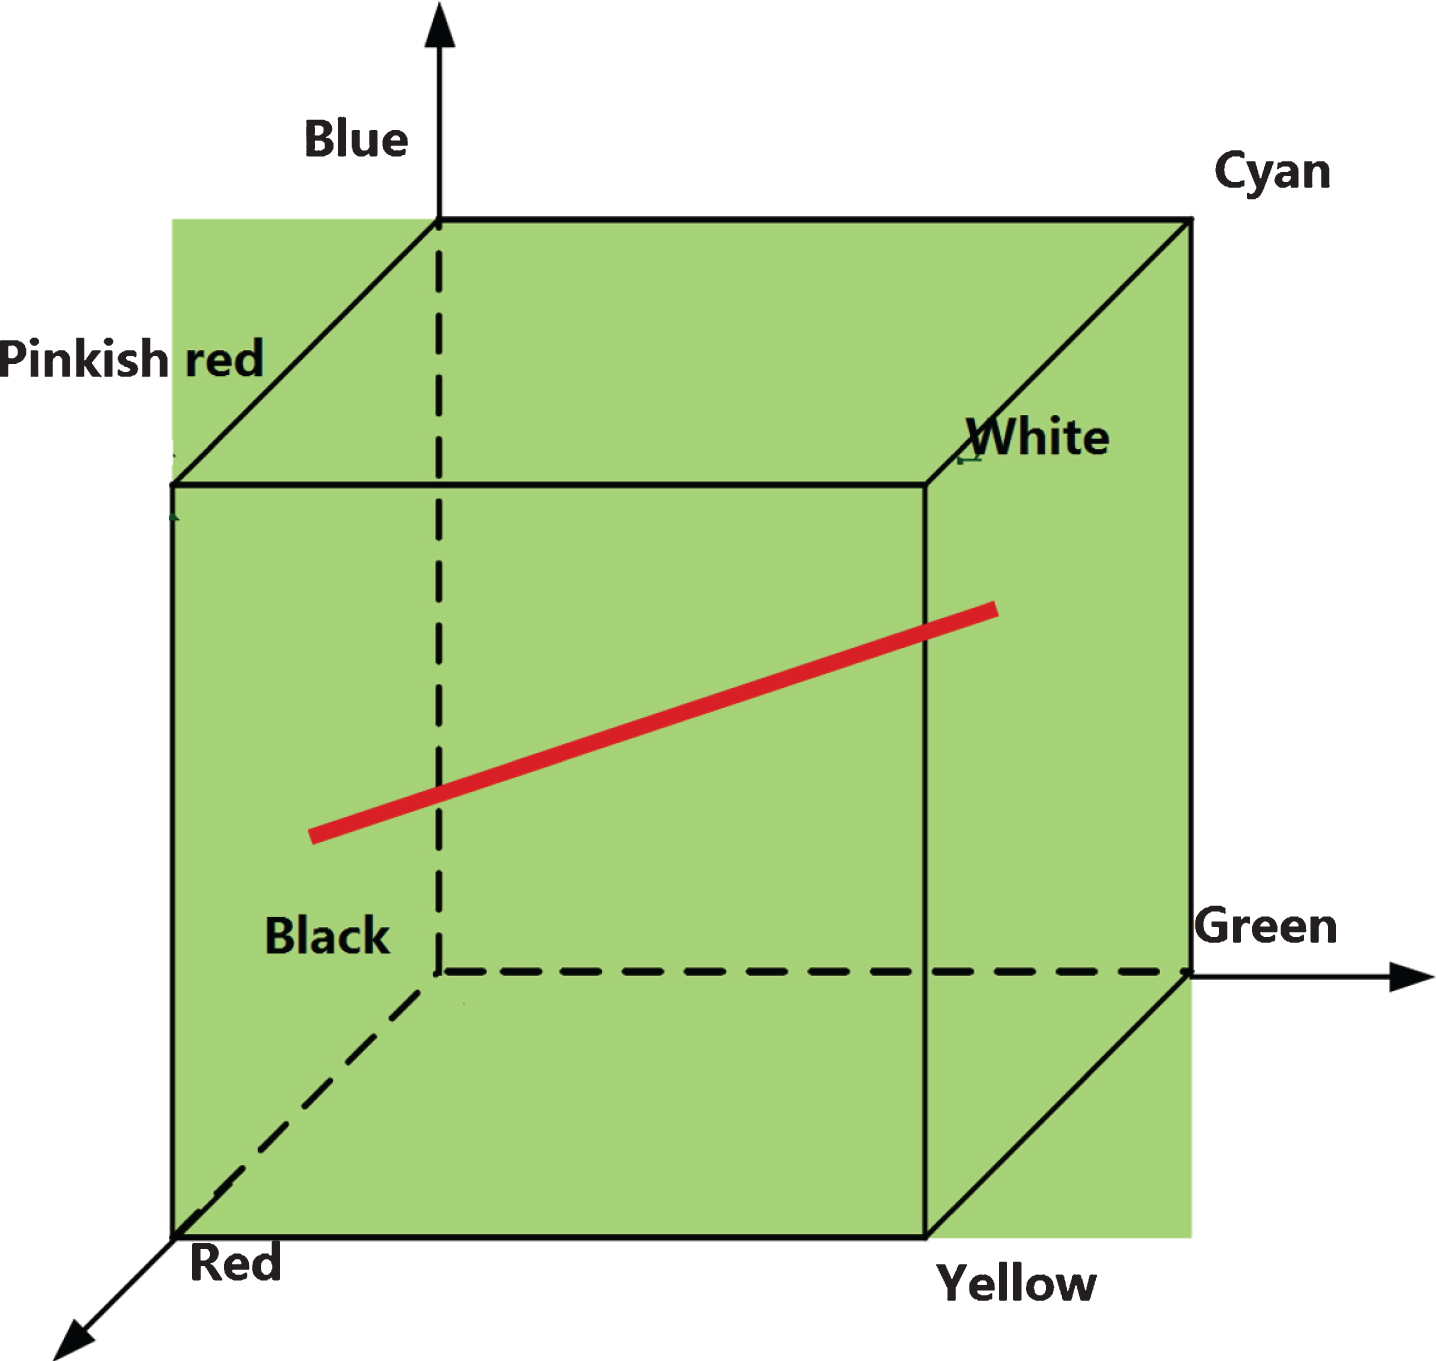
RGB color system.
Assuming that the image size is an M*N matrix, the general form of the unary linear interpolation function formula is as follows [12]:
Transformed:
N is the number of columns of pixels in the image, R0, G0, B0, R1, G1 and B1 are rgb color components of a given starting color and ending color respectively, and function values R, G and B are color values to be inserted. If the input values are Hex values, the color space conversion model must be used to convert them into various table color spaces. Here, they are converted into RGB spaces. Taking “#9acd32” (yellow green) and “#ff0000” (red) as examples, the color gradient effect can be realized by using codes as shown in Fig. 12.

Color gradient renderings.
Similarly, the same algorithm can be used to simulate corresponding models in other color spaces such as HSV, HSL, Lch, etc. Some effect diagrams are shown in Figs. 13 and 14.

Color gradient effect map in HSV space.

HSL space color gradient effect diagram.
2) Interpolation algorithm of three color gradient / multi-color gradient
Tricolor / polychrome gradient is a method to realize gradient by interpolating two or three color values. The computer implementation steps can be described as follows:
To obtain the color data, it is necessary to convert the input hexadecimal string array to numerical type for calculation. The obtained data is data, and the color value is represented by value array;
Obtain the gradient series;
Calculate the weight F of the insertion point between the two colors. For example, if the gradient level is 5, then the values of f are 0,0.2,0.4,0.6,0.8,1.0 successively;
Realize the gradient between multi colors.
The core code is as follows:
If (f< = p) {
Col = cols [i];
Break;
}
If (f> = p &&i===me._pos.length - 1) {
Col = cols[i];
Break;
}
If (f > p && f < me._pos [i + 1]) {
f = (f - p) / (me._pos [i + 1] - p);
Col = chroma.interpolate (cols [i], cols [i + 1], f, me._mode);
Break;
}
If the number of values of colors passed as parameters is c, then f at value is c / total number of values, p is the location of obtaining color data, col is the target color. The program supports continuous transformation between multiple colors.
After getting the target color, according to the interpolation algorithm, the gradient between colors can be achieved. Taking RGB color space as an example, the following is the core code of inserting color between any two colors, where xyz0 represents the current RGB color value and xyz1 represents the end color value.
If m==’rgb’
xyz0 = me._rgb
xyz1 = col._rgb
new Color(xyz0[0] + f*(xyz1[0]-xyz0[0]),xyz
0[1] + f*(xyz1[1]- xyz0[1]),xyz0[2] + f*(xyz1[2]-xyz
0[2]), m)
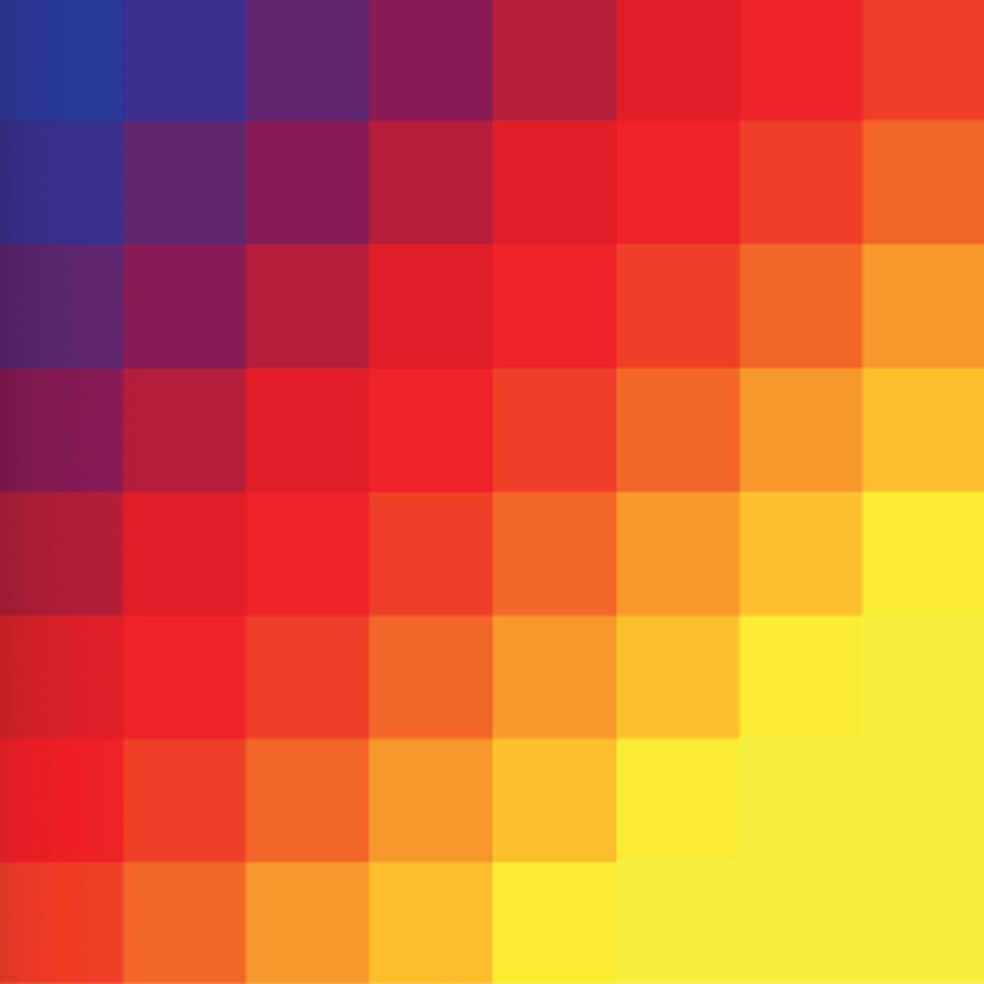
Three color values ’#A50026’,’#FFFFBF’ and ’#006837’ are interpolated in the Lab space, and the effect diagram is shown in Fig. 15, Figs. 16 and 17.

Three color gradient rendering of lab space.

HSV space three color gradient rendering.

RGB space three color gradient rendering.
The interpolation effect of the same color value in HSV color space and RGB color space is as follows:
3) Equidistant interpolation algorithm
Any given set of color values has the maximum and minimum values, so the first step in our calculation is to normalize the value range. The default is to normalize the range of a given color to [0,1], of course, you can also limit the range of a given color to a certain range, for example:
Scale = new chroma.ColorScale (colors: [’#F7E1C5’, ’#6A000B’])
scale.get Color (0.23)
The above code defaults the color range [’# [’#F7E1C5’, ’#6A000B’]’] to [0,1], and returns the color value at a ratio of 0.23. AndScale = new chroma.ColorScale (colors: [’#F7E1C5’, ’#6A000B’],
Limits: [0, 2000, 4000, 6000, 8000, 10000])
The continuous color scale is divided into five color sets with the same interval while the color range [’# [’#F7E1C5’, ’#6A000B’]’] is limited to the interval of [0,10000].
Taking color groups [’# a50026’,’ d73027’,’ f46d43’,’ f46d61’,’ fe08b’,’ ffffbf’,’ d9ef8b’,’ a6d96a’,’ 66bd63’,’ 1a9850’,’ 006837’] as examples, the above Hex form color values are converted into RGB color space by using color space conversion algorithm, normalized to [0,1] according to the maximum and minimum values, given a grading number of 9, and equidistant interpolation is performed. The effect diagram is shown in Fig. 18.

RGB space color isometric effect diagram.
On the basis of multi-color gradient algorithm, the range of color groups is limited. Given the number of gradations and the equal interval scale, the equidistant interpolation can be realized. Besides the linear interpolation of isometric method, log scale, quantile scale, k-means scale and continuous scale can also be realized according to the above algorithm. In logarithmic interpolation, the number of each interpolation point logarithm is equidistant; each class in the quantile system has the same size and the number of color values in each class is the same. K-means clustering method is to create some color value categories so that the sum of the square distances from each color value to the center of the respective category is minimized. Continuous interpolation is similar to equidistant interpolation. Different from equidistant interpolation, continuous interpolation can increase the number of classes to infinity, while equidistant interpolation divides color values into finite classes.
Color brewer 2.0 is an online example program developed by Cynthia A. brewer, a French geographer. It is mainly used to represent color recommendations for hierarchical statistical maps. The main interface of color brewer is shown in Fig. 19.
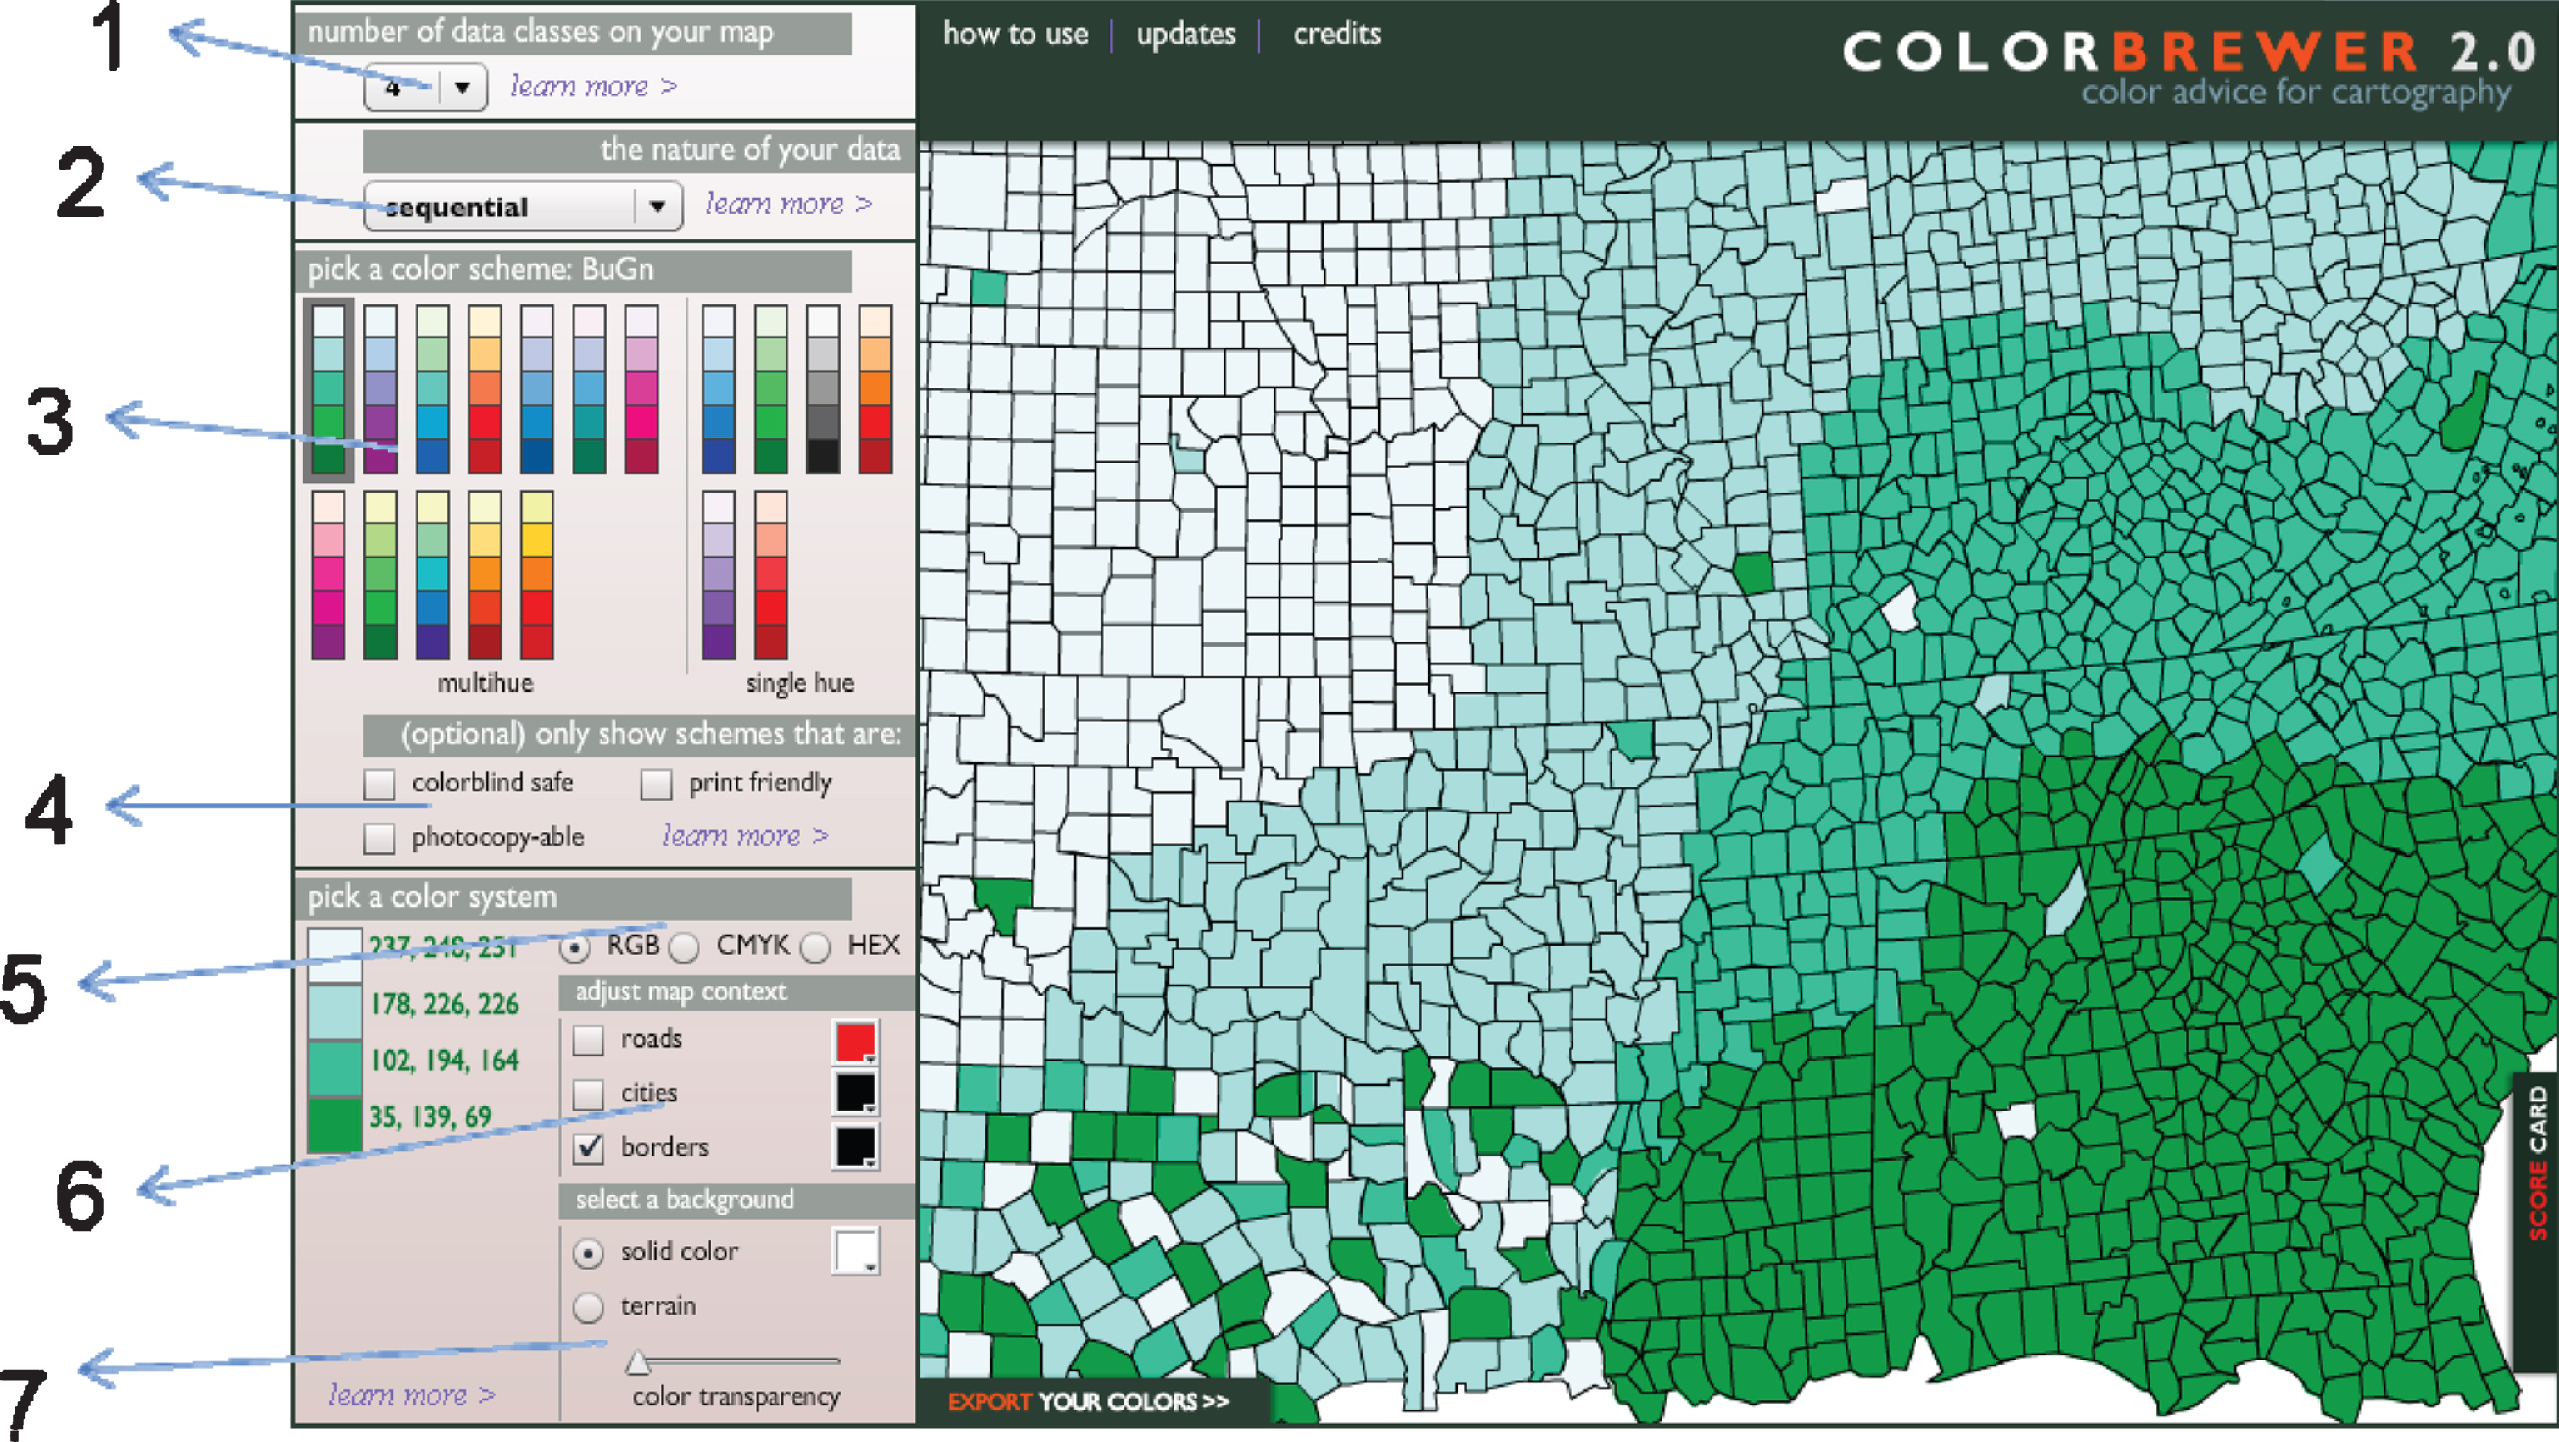
The main interface of colorbrewer.
In the coordinate area above, select the number of grades of thematic data from one drop-down list box, and distinguish different color grades according to the grades. The default value of color brewer is 3–9 grades. Because there are too many grades, it is not easy to distinguish the color differences between grades. Two data features can be selected. Because color brewer is mainly suitable for thematic maps represented by hierarchical statistics, while hierarchical statistics generally corresponds to an indicator, an indicator corresponds to a group of colors, and data features usually refer to a group of colors, so the selection of data features should be set here. Color brewer provides three options for data characteristics: continuous, multivariate and divergent. When the level of thematic data is fixed and temporal data features are selected, the color schemes recommended by the program are displayed in three places, including single color scheme and multiple color schemes. The purpose of the figure is shown in 4 places, and different colors are recommended according to different purposes. For example, colorblind safe means that the color setting will not trouble people with red and green color blindness. Area 5 represents different color system representation methods, and color brewer only provides RGB color system, CMYK color system and hex color system. 6 places can be used for layer display or not, or the color of annotation and road layer can be modified in the color panel. The problem of color matching is not considered here. 7 points indicate the transparency change of the background color. Slide right along the triangle, and the background color changes from light to dark.
After the introduction of the above example program, the situation in color brewer can be expressed in the form of rule reasoning. But color brewer is different from the general rule reasoning. Each rule reasoning conclusion corresponds to a set of colors. It is expressed in production knowledge representation, that is, IF....THEN.... For example:
IF map is represented by hierarchical statistical map AND data features are divergent
The THEN ribbon is light in the middle and dark at both ends.
The IF map is represented by hierarchical statistical graph method AND the hierarchical number is 3 AND the data features are divergent.
The THEN color series values are “0x D8B365, 0xF5F5F5, 0x5ab4ac” or “0xe9a3c9, 0x F7F7F7, 0x A1D76A"
OR “0x AF8DC3,0x F7F7F7,0x7FBF7B” OR “0x F1A340,0x F7F7F7,0x998EC3”
OR “0x EF8A62,0x F7F7F7,0x67A9CF” OR “0x FC8D59,0x FFFFBF,0x91BFDB”.
IF map representation method is hierarchical statistical chart method AND data feature is continuous
Then color band is gradient.
IF map is represented by hierarchical statistical map AND data features are continuous
THEN can choose either single variable or multi-variable color setting.
IF map is represented by hierarchical statistical map AND data features are multivariate
The THEN ribbon is a series of colors with completely different hues.
Under the influence of the COVID-19 epidemic situation, many countries have taken many measures to control the flow of people. The inability of people to gather makes art color measurement a problem. This paper describes the basic characteristics of color, including the three attributes of color, color system and the transformation between them. At the same time, the psychological feeling of color and the color habit of thematic map are designed. According to different data characteristics, different color schemes are studied, including single variable color scheme and multi variable color scheme. This paper puts forward how to re color the interior of color when the number of classification changes in the hierarchical statistical map to ensure that the human eye is visually equivalent. To solve this problem, the algorithm of equidistant interpolation is studied and implemented. In this paper, case and rule knowledge representation method, case retrieval technology and rule conflict resolution strategy are established. Based on the above strategy, the color case base is established. In addition, the rule table is established by combining color-brewer with rule reasoning and referring to color-brewer. The rule table has certain reference value for the application of intelligent reasoning method in the field of art color measurement under the influence of COVID-19 epidemic.