
Abstract
Facing COVID-19 epidemic, many countries have recently strengthened epidemic prevention and control measures. The reliability of safety management is of great significance to personnel management and control during the COVID-19 epidemic period. The focus of security management of early warning is to monitor and identify the moving target. The current optical flow method is vulnerable to the influence of light changes and background movement, and it is not very accurate for moving target detection in dynamic complex background. In this paper, aiming at the traditional Lucas Kanade optical flow method, the inter frame difference method, mean shift clustering algorithm and morphological processing are combined to optimize and improve on the original basis, so that the moving target detection effect in both simple and complex environments is significantly improved. At the same time, the improved algorithm also reduces the execution time to a certain extent, and has a certain resistance to noise interference such as light changes. This has a certain ability test value for personnel control during the epidemic.
Keywords
Introduction
In the face of the severe situation that the COVID-19 epidemic continues to spread around the world, European and American governments recently declared a state of emergency and called up troops to fight the epidemic. At the same time, European and American governments have introduced corresponding personnel flow control measures to deal with the infectivity of the COVID-19 epidemic situation. The reliability of safety management is of great significance to personnel management and control during the COVID-19 epidemic period.
Moving target detection is the basis of intelligent analysis technology in security system such as behavior recognition and target tracking in video system [1, 2]. By acquiring the relevant moving parameters of the target, analyzing and predicting the moving track of the moving target, and then processing the obtained data, different processing (detection, positioning, recognition, classification and tracking) of the moving target can be realized.
Moving target detection technology is widely used in the field of computer vision [3–5], geology [6], medicine [7] and other cross field research. This is not only conducive to the development of science and technology, but also to a large extent enriched the means of human life, which has become one of the important driving forces for the continuous progress of human society [8–10]. In the important fields of national and social public security, aerospace and many civil fields, moving target detection technology plays an important role. As an auxiliary technology, moving target detection technology can organize the images and videos that are not convenient for human to obtain information in order to meet the requirements of human, and more suitable for people’s perspective [11]. It uses a more clear, accurate and efficient way to present the image or video information in front of people. Therefore, how to improve the effect of moving target detection technology and make its development mature gradually has become the current research hot spot [12].
In this paper, the Lucas Kanade optical flow algorithm based on multi-layer information backtracking is improved, which combines Lucas Kanade optical flow method, inter frame subtraction, mean shift clustering, canny image boundary detection and morphological processing, and selects multiple sets of video frame sequences with different backgrounds. Finally, the improved algorithm is compared with other common background modeling algorithms.
Image preprocessing
In the whole process of data processing, the original data has a great impact on the whole process. If the data definition is high and stable, and the light is suitable, it is also suitable for the operation of subsequent programs. On the contrary, if the data is not clear due to the chaotic movement, light, various objects chaotic movement and so on. The data is not true and fuzzy, so it will cause difficulties for the subsequent program operation, and the final result will not be ideal. Among them, some unimportant information is wrongly retained in the final result due to data defects or insufficient running process. This unimportant information is generally called “noise". Enhance the useful real information, reduce the useless noise, can be simplified or filtered through the previous data. This is an indispensable part of the whole process, preprocessing usually occurs before other operations, often has the following process: grayscale ->geometric transformation ->image enhancement.
Grayscale
In the simple classification of pictures, there are gray pictures and color pictures. From the perspective of RGB, it’s just the difference of numerical value: when the red, green and blue are equal, what you see is the gray picture. When the three colors are different, what you see is the color picture. Because of this, ordinary pixels need three bytes, gray value only needs one byte, and 0– 255 is the corresponding gray range. Obviously, too much computation leads to a significant increase in time overhead, affecting processing speed.
Generally, the input raw data is color, so if the color picture can be converted into gray picture, it can reduce the running time and improve the running speed of the program. Therefore, reducing the amount of data to be processed and reducing the time cost are the necessary means to improve the processing speed of the whole moving target detection algorithm. The calculation methods of gray value are as follows: (1) maximum value method, as the name implies, is to select the maximum color value from the red, blue and green three colors as the unified value of the three colors, that is, gray value. The calculation method is as follows:
(2) Average method
The average method is to add up the color values of red, green and blue, and then find the average value. The average value is the unified value of three colors, i.e. gray value. The specific calculation method is as follows:
3) Weighted average method
Sometimes, the maximum method and the average method cannot get the best results. At this time, we need to calculate the gray value of the original data according to the specific data situation and environmental factors, as well as the requirements of the program operation for data conversion. Therefore, a more detailed and accurate weighted average method has emerged. The idea of weighted average method is to analyze the red, green and blue colors, and then add three different weights. The gray value is obtained by weighted average of three colors. The specific calculation method is as follows:
Geometric transformation is the geometric transformation of data, which means that the collected data can be transformed into various positions, sizes and shapes. These operations can be directly used in data, but it is necessary to choose which geometric transformation method to use according to the needs of program operation. Image geometric transformation can effectively reduce the system error caused by image acquisition system and the random error caused by perspective relationship, imaging angle, instrument position and lens itself. In addition, in general, the gray value insertion operation is also needed, because this transformation relationship is used for calculation. As the change of the actual environment cannot be predicted, there is a certain probability of the error of the control results after the conversion. For this reason, some optimization methods of interpolation class can be selected for later compensation. Therefore, image geometric transformation is not only a simple physical change, but also needs to be optimized and compensated according to demand analysis. Only in this way, can we complete the task of geometric transformation and provide good support for subsequent operations.
Image enhancement
Image enhancement is to enhance the useful information in the image to a certain extent through technical means. This process will lead to partial data distortion. Image enhancement is a simple optimization of data. It can enhance the useful part of data and weaken the useless part of data. Image enhancement is applied in many image processing processes, because in the process of image processing, there will be incomplete data or too much noise. Through image enhancement or partial weakening, the useful part of data can be highlighted more strongly and useless information can be reduced. In data feature extraction, image enhancement is a very important step, which is helpful to extract more effective information features. In this paper, spatial domain method and frequency domain method can be used to realize the function of image enhancement.
Mean shift clustering algorithm
Mean shift algorithm
Given n sample points xi, i = 1,2,...,n in d dimensional space Rd, the basic form of mean shift vector at point x is defined as:
In the above equation, Sh is a multidimensional sphere with a radius of h:
In the above equation, among these n data values xi, i = 1,2,...,n, there are k points in Sh. Data points in the Sh area are more likely to display in the direction of increasing probability density.
The data value of Sh, no matter whether it is different in other aspects (far or near to x), has the same effect on the final result Mh(x). However, estimating the statistical properties around x requires close data points to enhance the effect. Therefore, when using mean shift clustering algorithm as a whole, distance weighting can be taken into account.
In this way, the basic Mean Shift form can be extended to:
In equation (6):
G(x) is the unit kernel function; H = d*d; W(xi) is the weight assigned to the sampling point x.
When the common vector is mentioned outside the summation symbol, the following results are obtained:
Then, mean shift does the following: Calculating mh(x); Assign mh(x) to x; If mh (x) - x < ɛ, end the loop; otherwise, continue (1).
It can be known from Equation (3):
Image can be represented by p-dimension vector on two-dimensional grid, grid is pixel, and coordinate is spatial information. The representation methods of various graphs are as follows: the gray-scale graph is p = 1, the color graph is p = 3, and the multispectral graph is p > 3. By calculating the gray value and the image position information, we get the x value of (p + 2) dimension, x = (xs,xr), the kernel function K h r h s is noted as:
C is constant, hr and hs are smooth resolution.
To solve the problem of background movement, this algorithm uses mean shift clustering to remove the useless information vector from the data. Because the background moving is often caused by the camera moving, but there is always a limit to the camera moving speed. Therefore, this paper sets a threshold value to filter the input feature point sequence. When the optical flow vector size of a point is larger than the threshold value, this point is directly considered as a moving object and does not participate in the mean hit operation [13, 14]. In this way, the data input of mean shift algorithm is reduced, and only part of the feature points are calculated to speed up the running time. Take the optical flow vector value of this part of feature points as input, and rebuild a coordinate system. In this coordinate system, the mean shift clustering operation is carried out to classify the feature points and calculate all kinds of center points. After classification, find the center point contains the most number of points, and regard the coordinate of point a as the vector value of the background point. After elimination, the optical flow vector map is transformed into a binary map (the points with optical flow vector are set to 1, and the rest are set to 0), and many isolated points will be found. In this paper, these points are regarded as the background points which are not removed, and the small area figure can be removed again by the function of MATLAB.
In order to reduce the influence of light changes and moving background on optical flow method and speed up the moving target detection speed, this paper combines frame subtraction and Lucas Kanade optical flow method to detect. Schematic diagram of fusion algorithm is shown in Fig. 1.
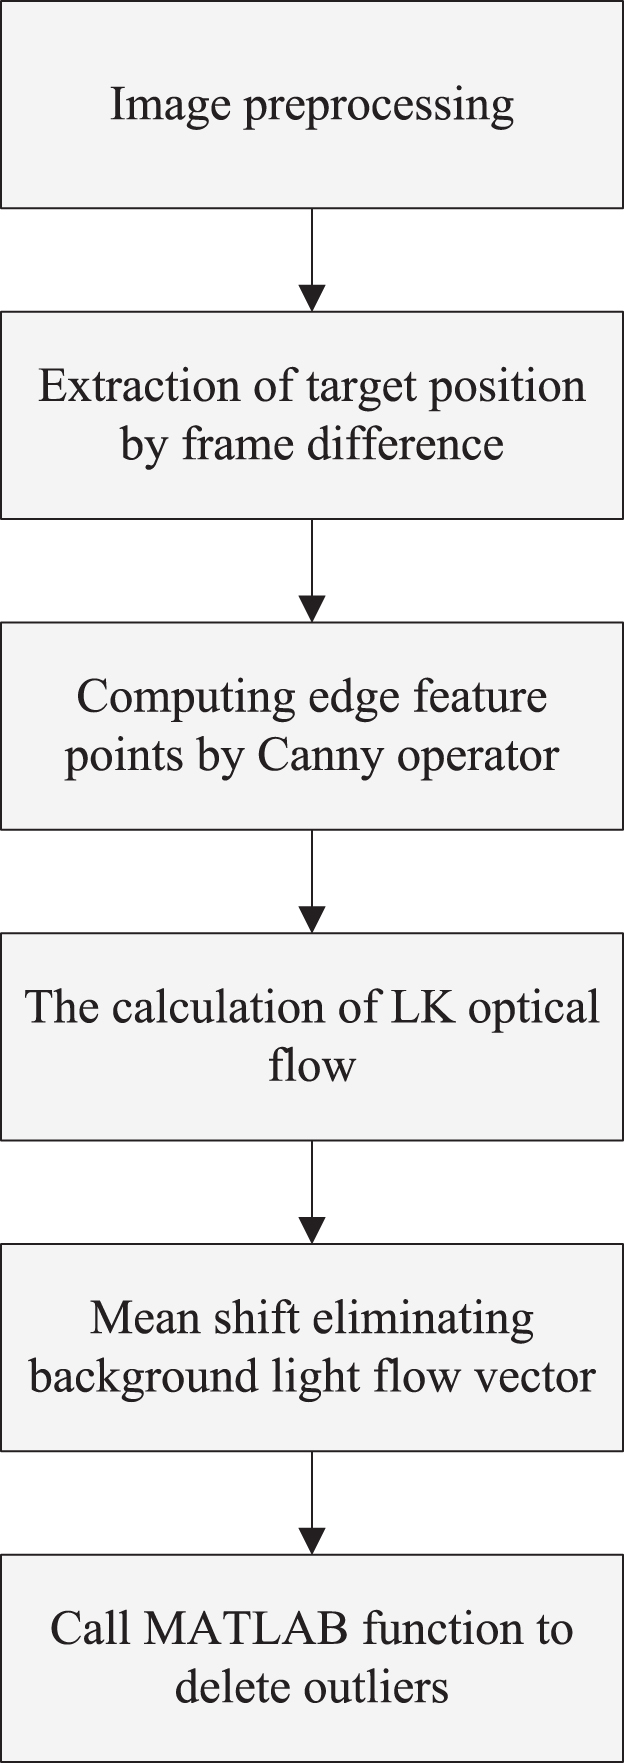
The fusion algorithm.
The detailed steps of the algorithm are as follows: Select the first and second frame of data map, and transform them respectively: from color map to gray-scale map, then add media filtering; Using inter frame difference method as subtraction to generate binary data graph, and using functions in MATLAB to remove useless small area graph in binary data graph; According to the processed binary image, the original image is cut to obtain two consecutive frames of moving object contour; Canny method is used to get all the boundary information of the previous frame; After using Lucas Kanade optical flow method to get the vector value including the boundary information, the final result is obtained by combining the vector values of all the boundary information, and then the optical flow vector graph is formed; Judge whether there is optical flow in the boundary information, and classify it to facilitate the next procedure; Using mean shift, the filtered feature vectors are divided into a similar group, and the information in the middle of each group of data information is extracted; Select the center point of the class with the most number of points as the background point, and remove the similar points from the vector map; The binary image is generated according to the updated vector image, and the small area image is removed again to get the final result.
This experiment is completed by Matlab platform. Firstly, the algorithm in this paper is used to deal with data targets in simple environment and complex environment. At the same time, the existing optimization algorithm based on Lucas Kanade optical flow method and the optimization algorithm based on background difference method are selected for comparison, and the feasibility of the algorithm in this paper is analyzed.
Moving target detection in simple environment
For a simple environment, this paper selects two groups of video sequences for comparison.
Sequence 1: residential monitoring video, background static, people walking forward at a constant speed.
Sequence 2: road monitoring video, the background is basically static, and road vehicles move rapidly.
The sequence 1 monitoring video is shown in Fig. 2 and the sequence 2 monitoring video is shown in Fig. 3. It can be seen from the two groups of images that the moving target detected by the optimization method in this paper is more accurate than the other three methods. Although the other three original algorithms can also do moving target detection, there are still many background noises not removed.
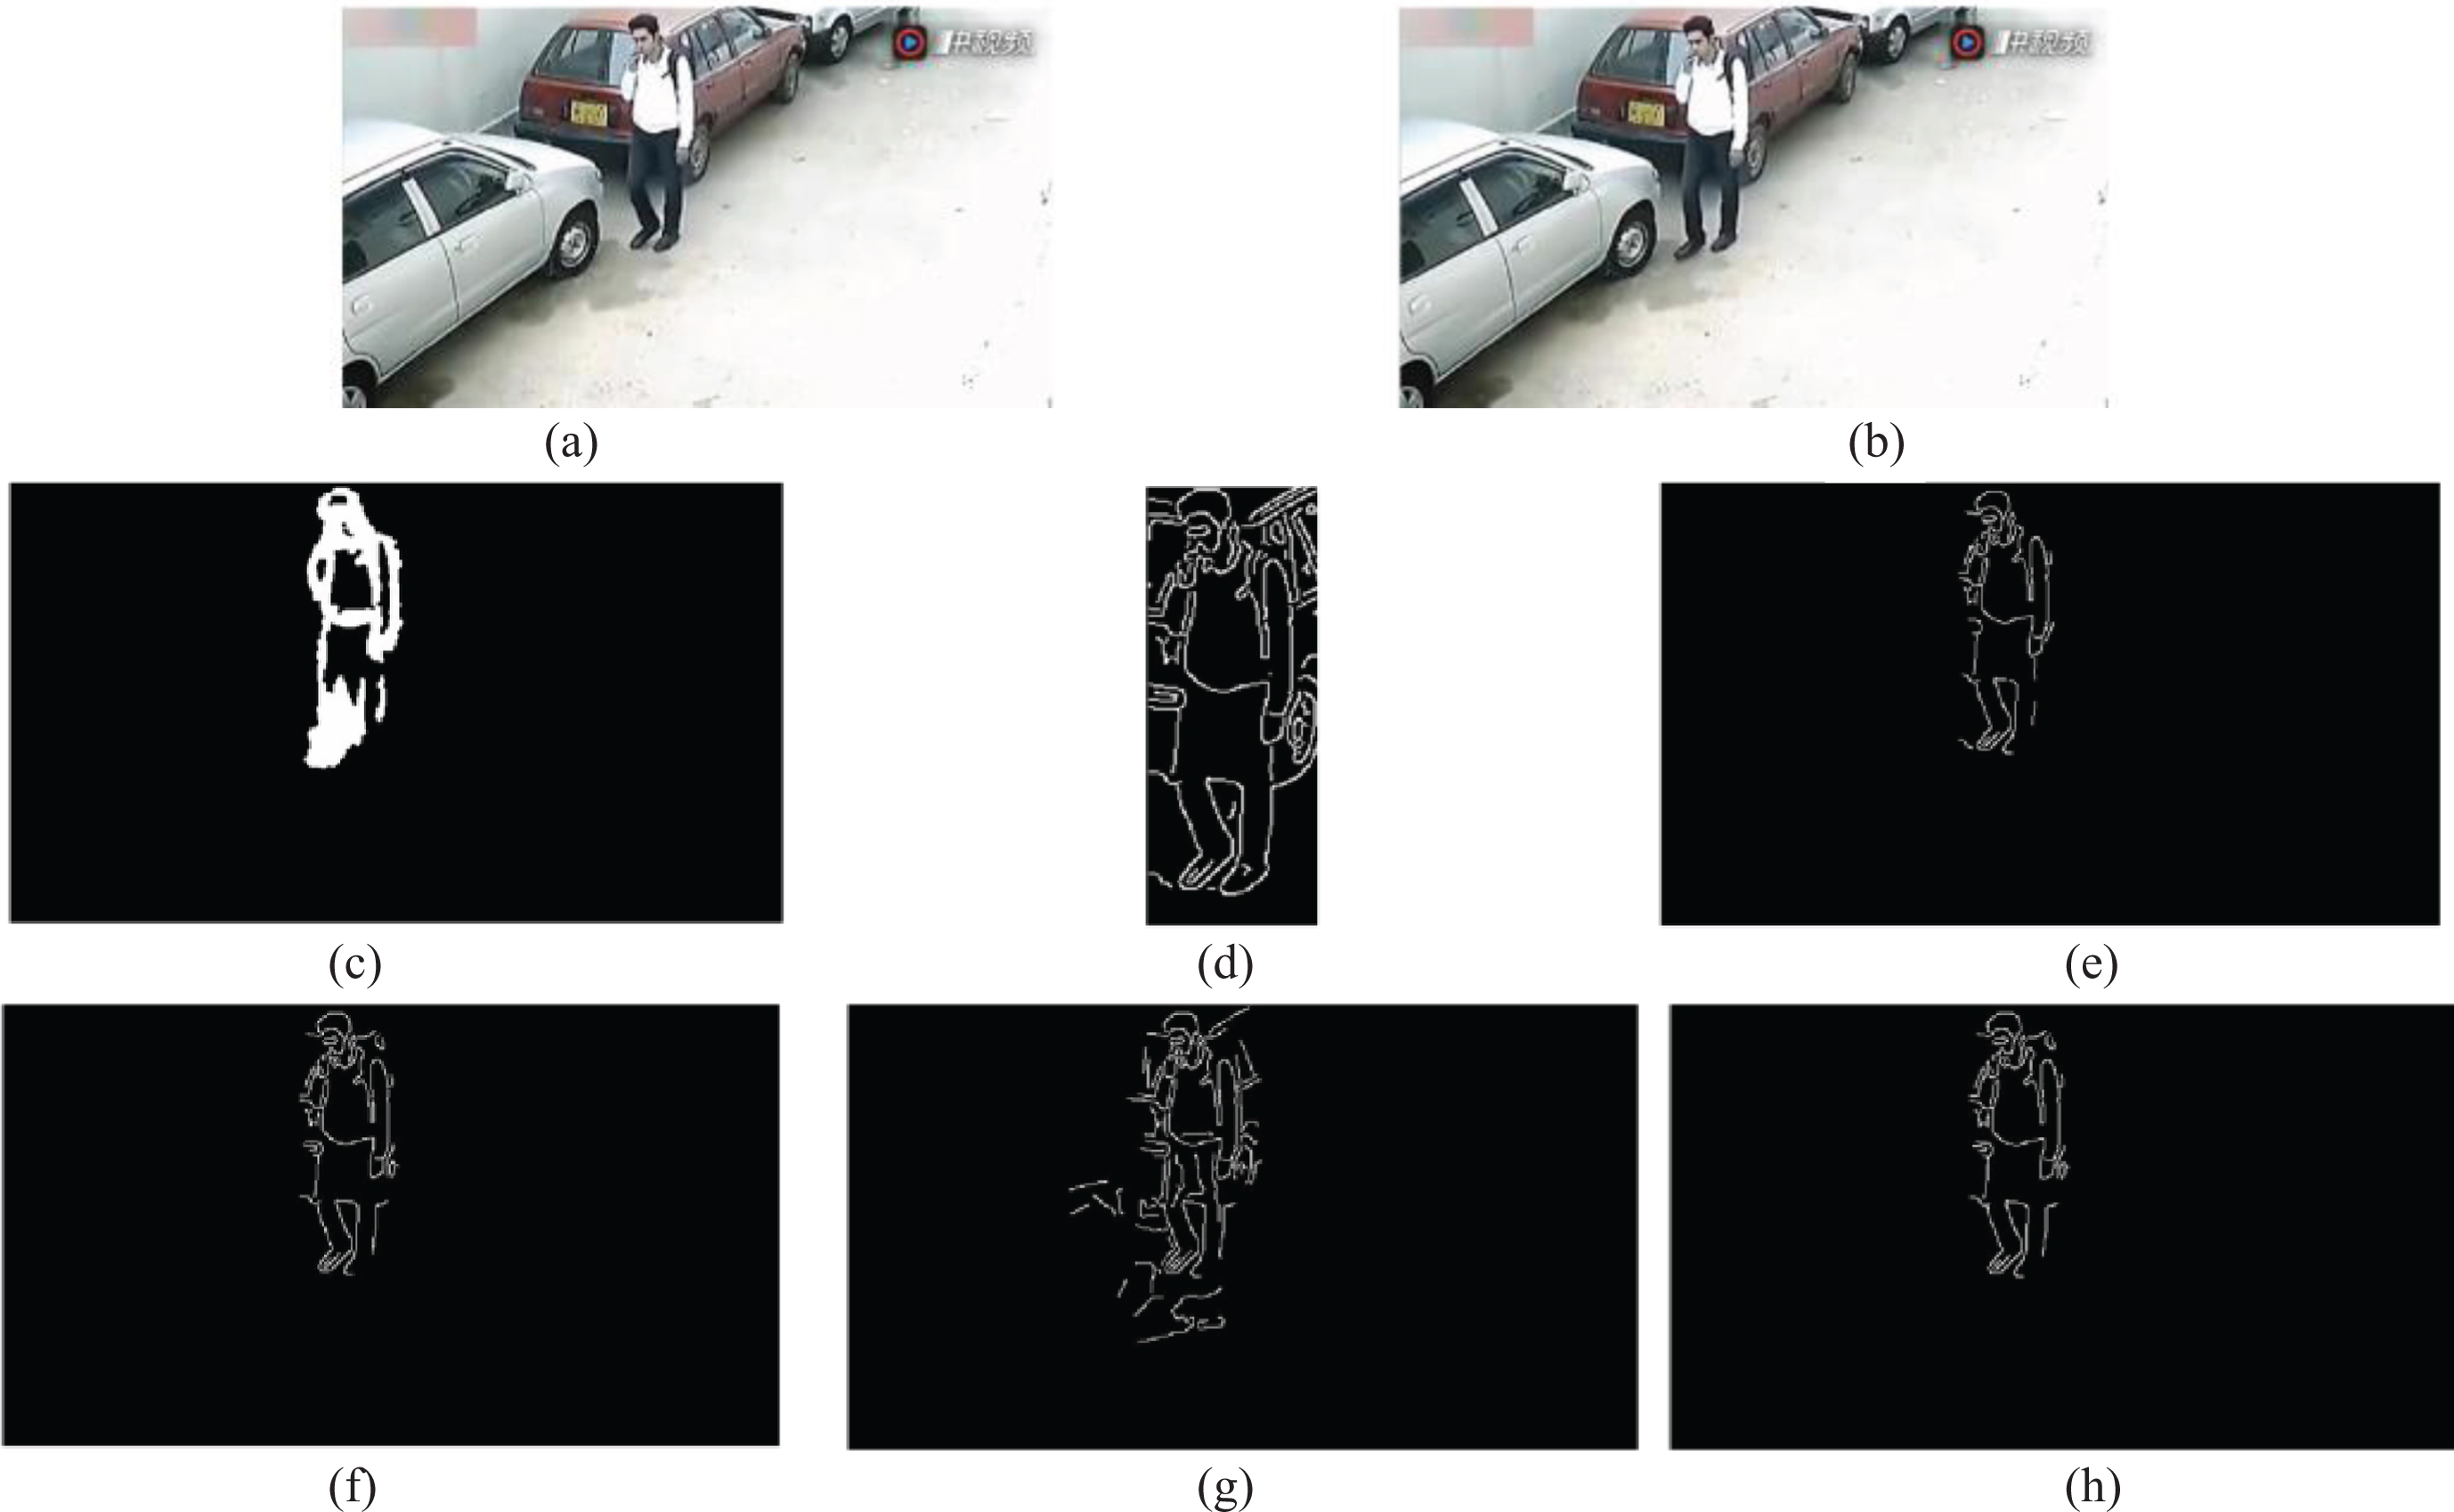
The sequence 1 monitoring video: (a)-original image 1; (b)- original image 2; (c)- image contour obtained by frame difference method; (d)- LK optical flow calculation of edge feature points after image cutting; (e)- The final result of eliminating background optical flow with mean shift algorithm; (f)- frame difference method combined with 1K optical flow method; (g)-Traditional LK optical flow method; (h)- LK optical flow method combined with mean shift algorithm.
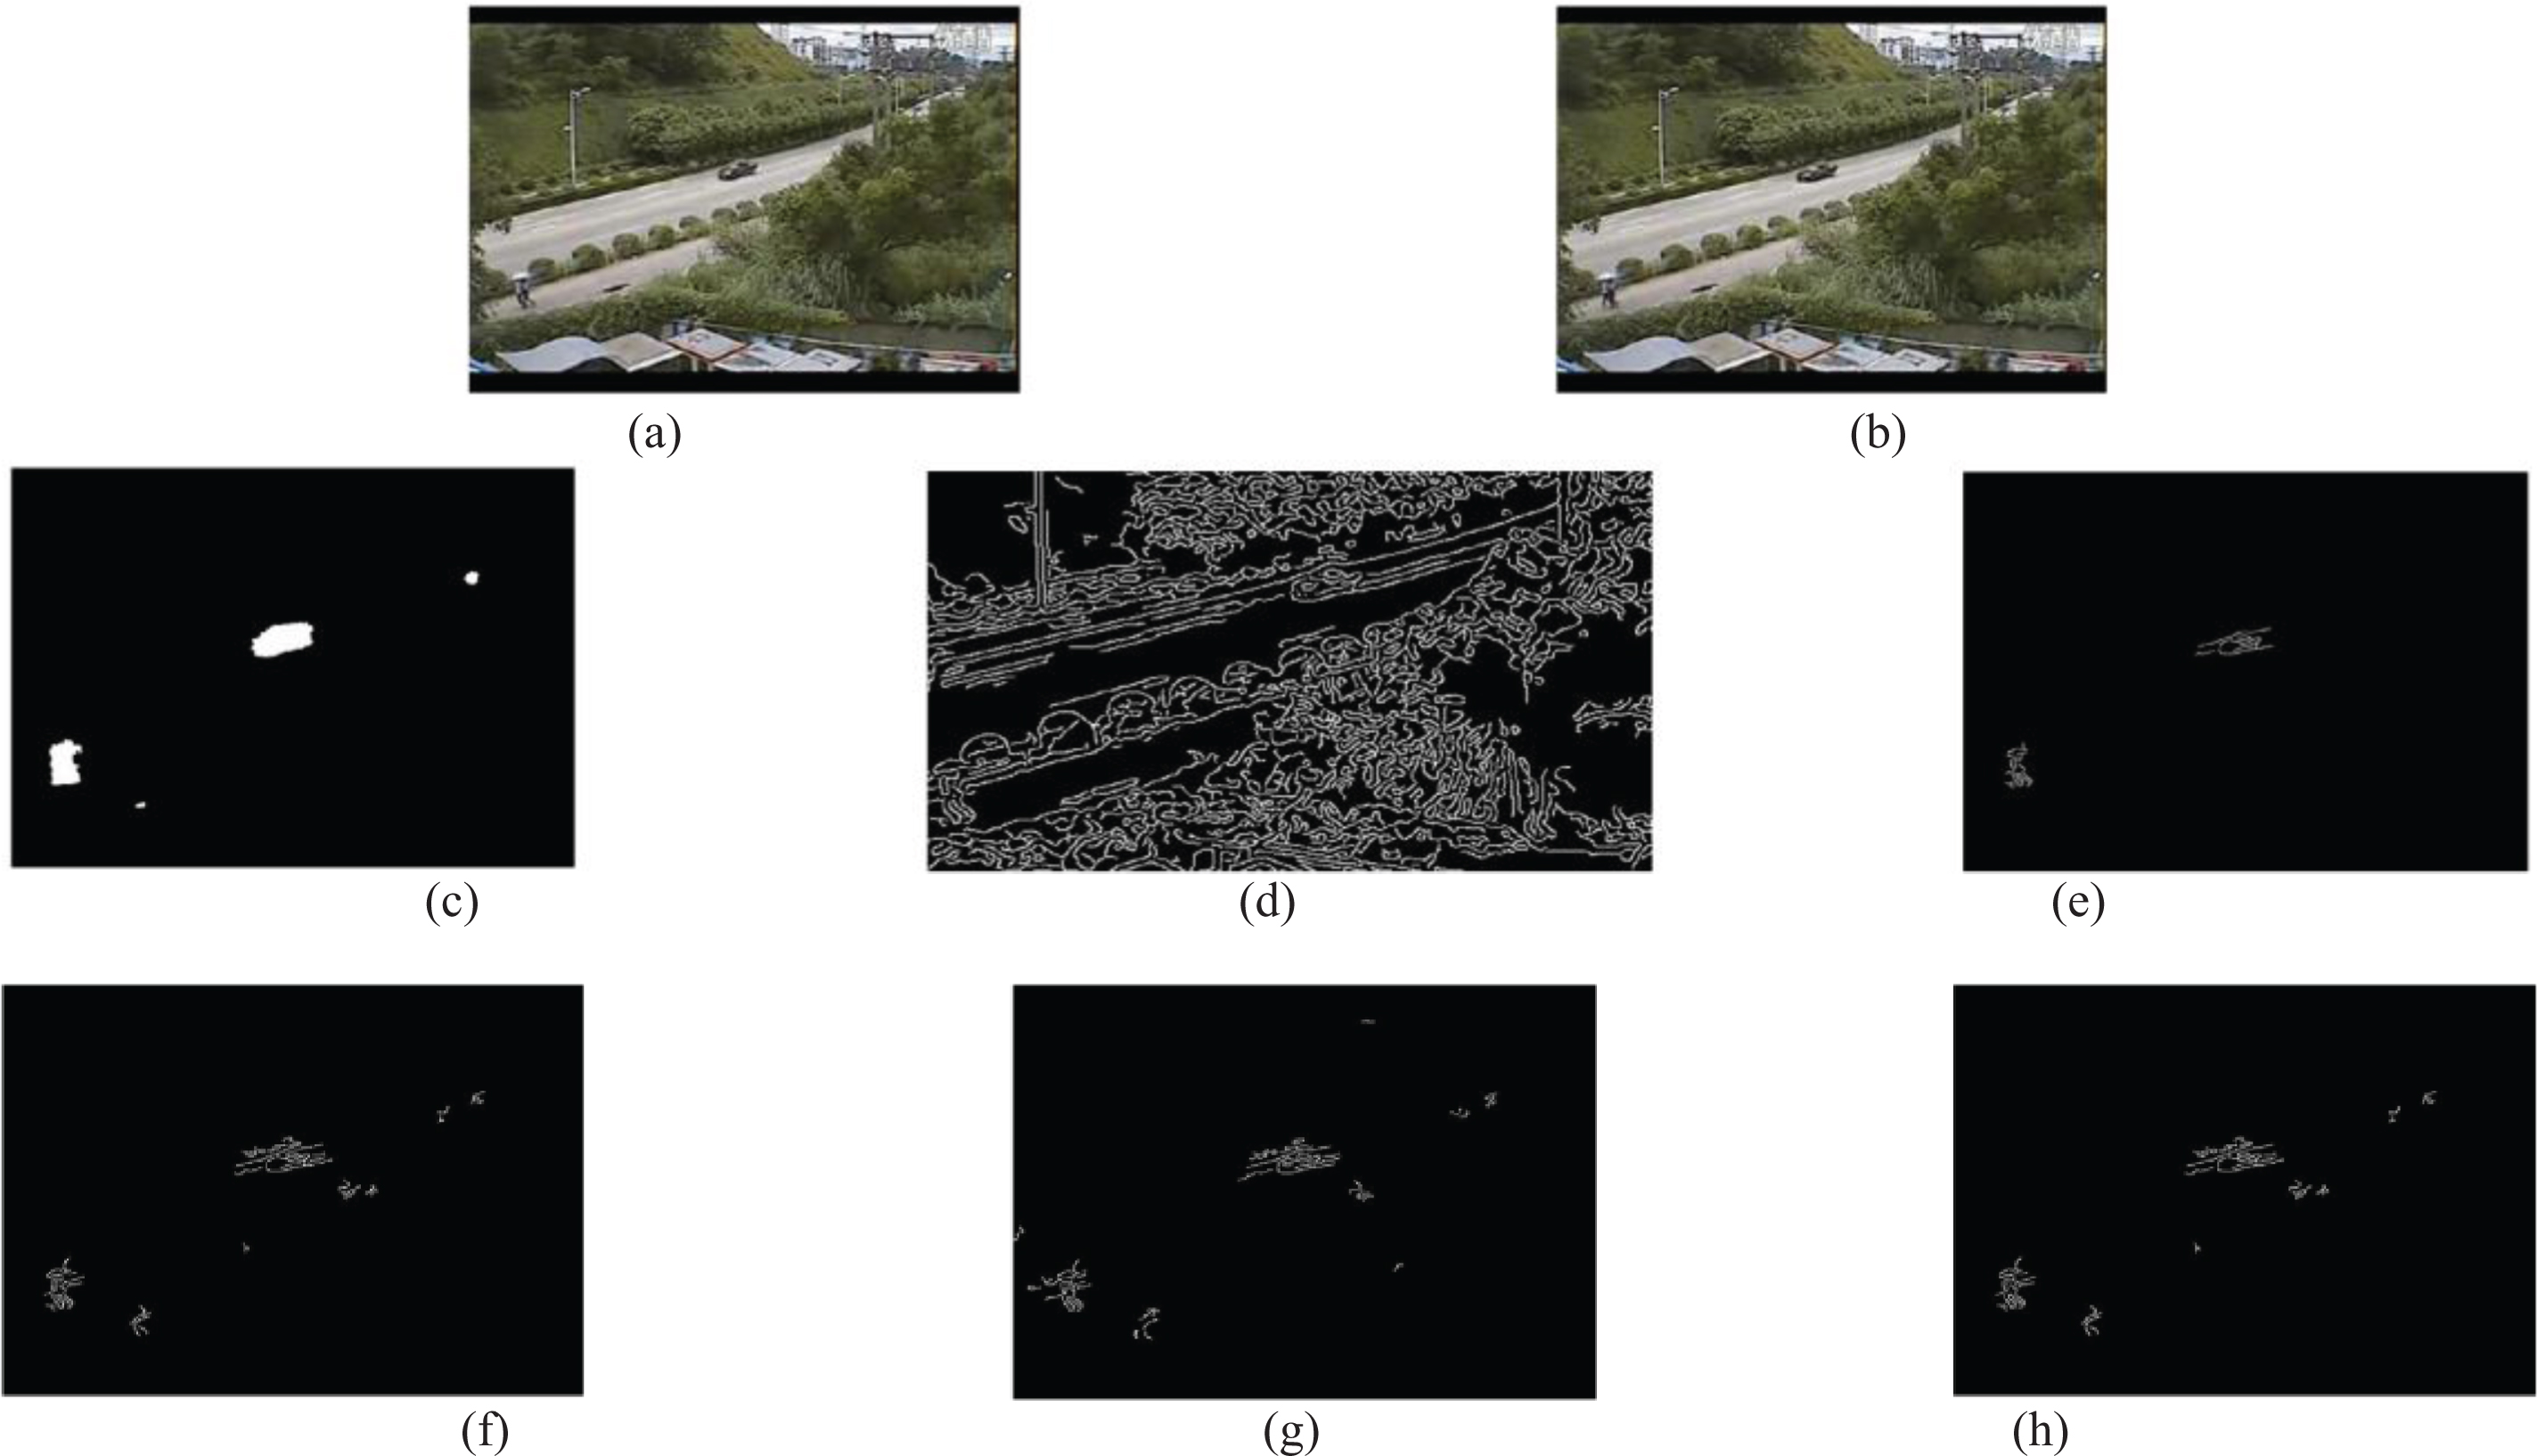
The sequence 2 monitoring video: (a)-original image 1; (b)- original image 2; (c)- image contour obtained by frame difference method; (d)- LK optical flow calculation of edge feature points after image cutting; (e)- The final result of eliminating background optical flow with mean shift algorithm; (f)- frame difference method combined with 1K optical flow method; (g)-Traditional LK optical flow method; (h)- LK optical flow method combined with mean shift algorithm.
In view of the mobile background, this paper selects two groups of different video frame sequences as the original data to experiment in MATLAB.
Sequence 3: monitoring room frequency of on-board recorder, slight shaking of video background, slow driving;
Sequence 4: outdoor exploration monitoring video, the video background is relatively shaking, people walk slowly. After comparison, compared with other improved algorithms, the improved algorithm in this paper can extract the moving target more accurately in the case of background moving. For inter frame difference method and Lucas Kanade optical flow method, it combines the algorithm with the traditional Lucas Kanade optical flow method. It can be seen from the figure that the running effect of the program is very poor. Compared with the algorithm in this paper, LK optical flow algorithm and mean shift algorithm have more defects that have not been removed. The sequence 3 monitoring video is shown in Fig. 4 and the sequence 4 monitoring video is shown in Fig. 5.
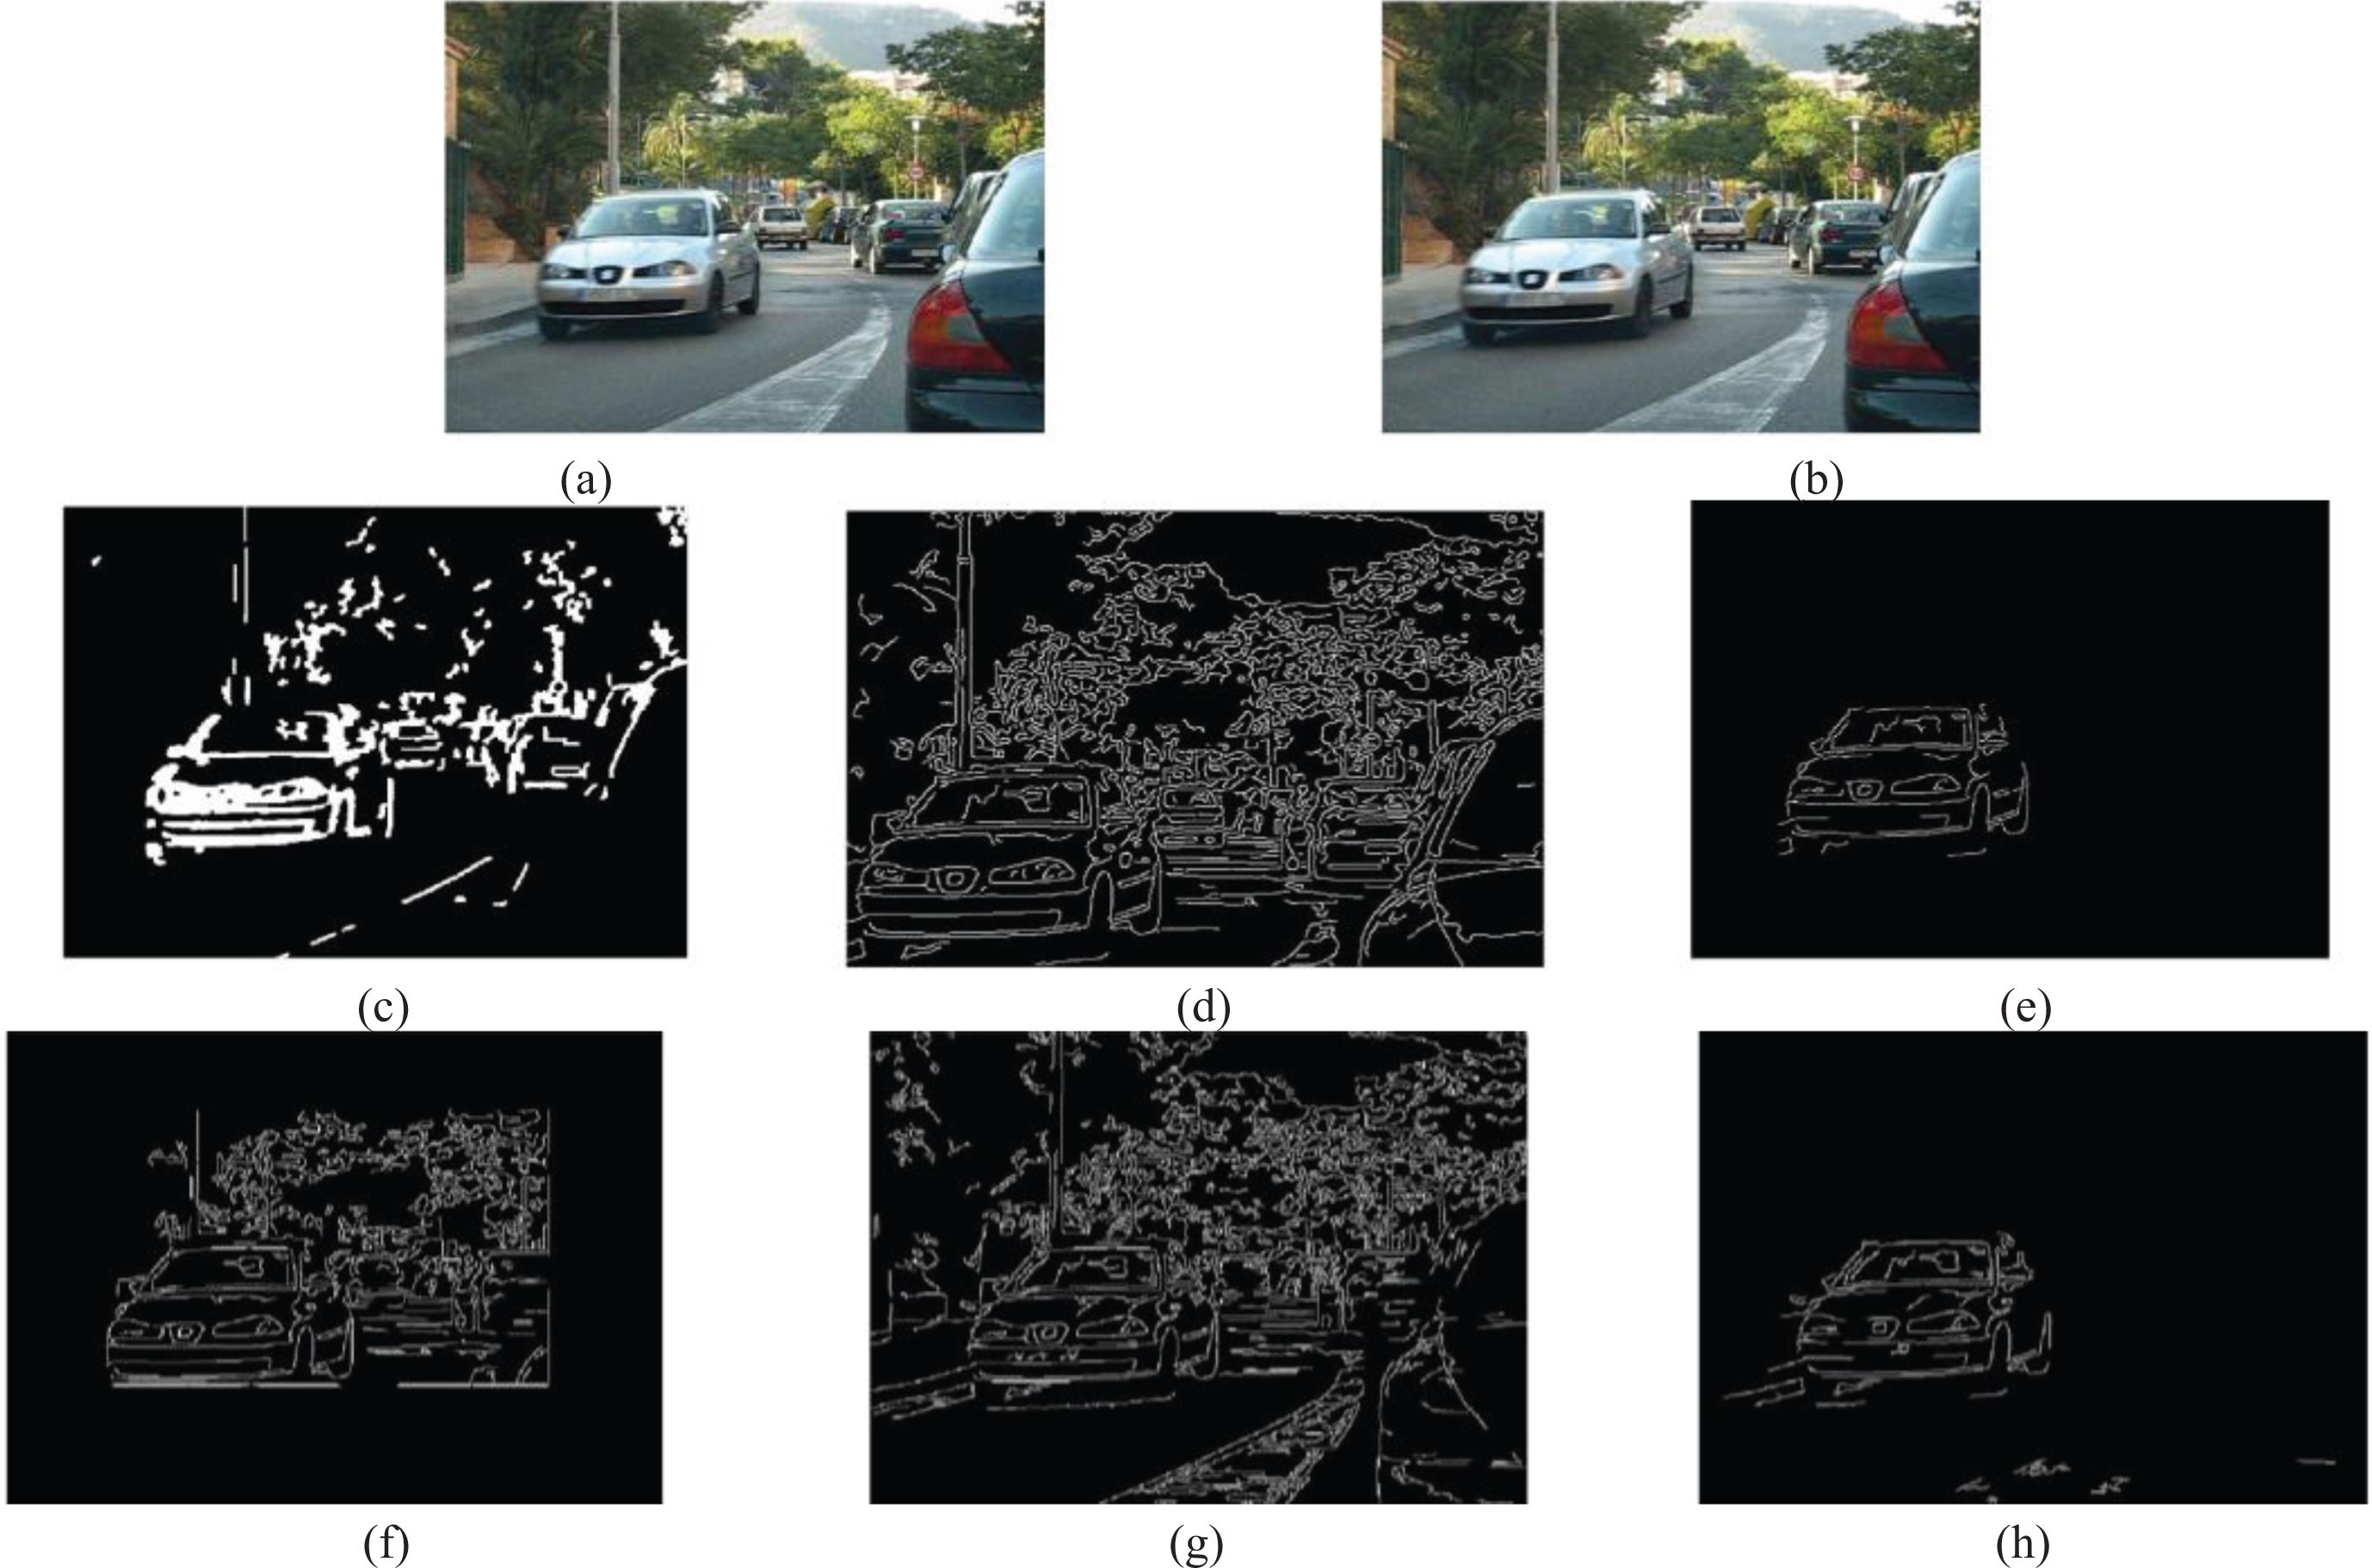
The sequence 3 monitoring video: (a)-original image 1; (b)- original image 2; (c)- image contour obtained by frame difference method; (d)- LK optical flow calculation of edge feature points after image cutting; (e)- The final result of eliminating background optical flow with mean shift algorithm; (f)- frame difference method combined with 1K optical flow method; (g)-Traditional LK optical flow method; (h)- LK optical flow method combined with mean shift algorithm.

The sequence 4 monitoring video: (a)-original image 1; (b)- original image 2; (c)- image contour obtained by frame difference method; (d)- LK optical flow calculation of edge feature points after image cutting; (e)- The final result of eliminating background optical flow with mean shift algorithm; (f)- frame difference method combined with 1K optical flow method; (g)-Traditional LK optical flow method; (h)- LK optical flow method combined with mean shift algorithm.
In terms of execution time, although the frame difference method combined with optical flow method has the shortest calculation time, the calculation effect is poor in the dynamic background. In most cases, the running time of the other two algorithms is higher than that of this algorithm, and the results are not very ideal. Speed comparison chart of four algorithms is shown in Fig. 6.
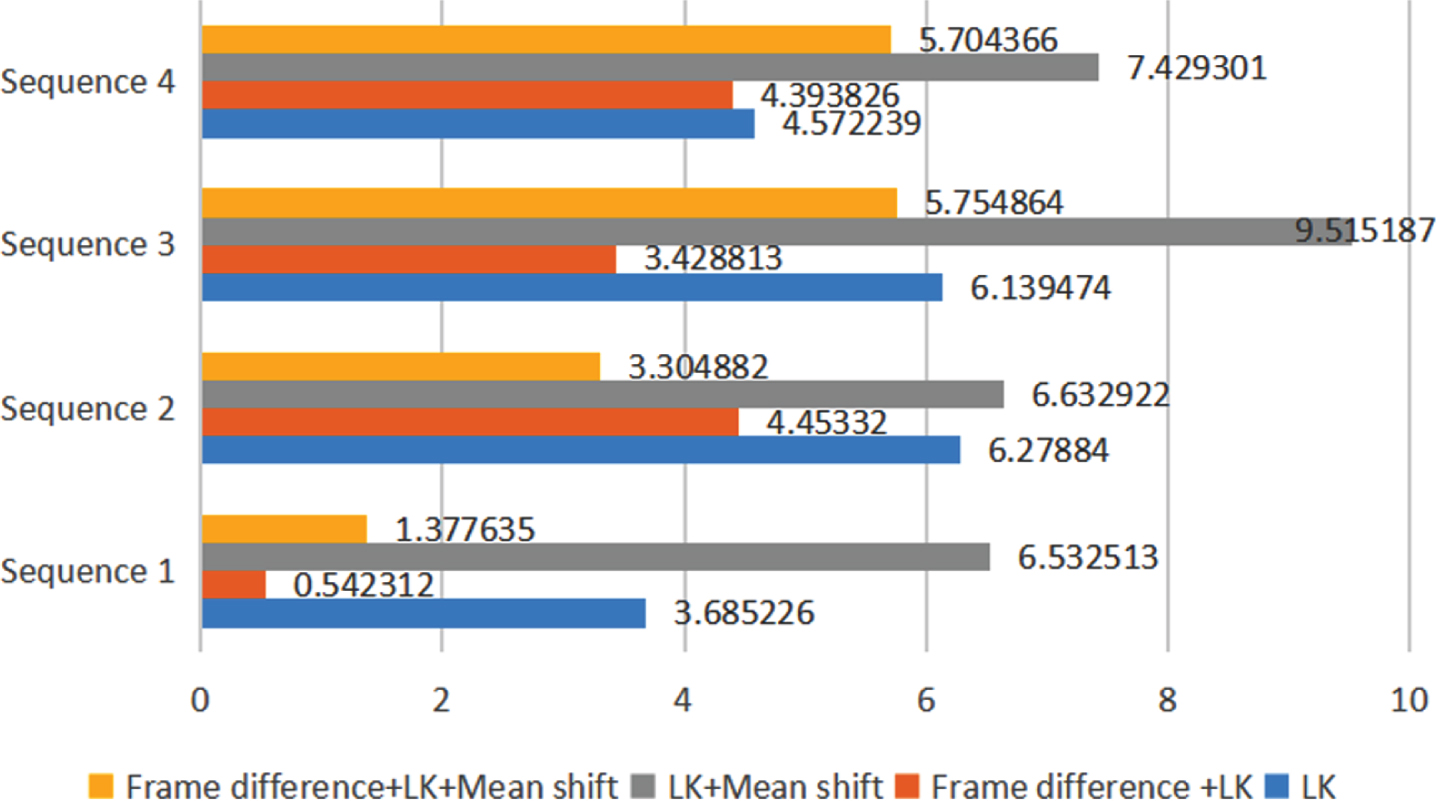
Speed comparison chart of four algorithms.
The reliability of safety management is of great significance to personnel management and control during the COVID-19 epidemic period. In order to improve the traditional mobile target detection algorithm, which has a large amount of computation and high time complexity, this paper proposes using inter frame subtraction to do pre-processing to narrow the image range to be processed, so as to reduce the amount of computation, improve the running speed and reduce the time consumption. Based on the analysis of experimental data, this paper compares five classical frame difference methods which are widely used, and finally selects the inter frame difference method which has the least time complexity and the fastest detection speed to deal with the detection data in the early stage, combined with MATLAB The image algorithm in can detect the small area noise in the image, and then cut the original image according to the processed binary image to obtain the moving target contour of two consecutive frames, which greatly reduces the calculation.
In order to further reduce the noise and improve the detection accuracy, this paper uses MATLAB algorithm function, media filtering, Canny operator and other operators in the main algorithm Lucas Kanade optical flow method to further optimize the algorithm results, reduce the background noise points and improve the detection accuracy.
In this paper, the mean shift clustering algorithm in machine learning is used to classify the filtered feature vectors into similar ones. Calculate all kinds of center points, and then select the class center point with the most number of points. It is regarded as background points, similar points are removed from the vector map, and the sequence of image feature points is effectively filtered and filtered to reduce the calculation amount and running time of the algorithm. It has a certain reference value to improve the reliability of personnel management and control under the influence of COVID-19 epidemic situation