



Abstract
In order to meet the rapid growth of educational data, to automate the processing of educational data business, improve operational efficiency and scientific decision-making, a statistical analysis platform for educational data is designed, and Hadoop-based education is designed from the conceptual model, logical model, and physical model. Data warehouse; designed and researched the storage of educational multidimensional data model; and then compared and tested the query efficiency and storage space of HBase and Hive in the Hadoop ecosystem based on educational big data, and used HBase+Hive integrated architecture to complete the education data The statistical analysis tasks and the function of the educational data statistical analysis platform are transplanted to the educational big data platform based on Hadoop; the performance test of the conversion efficiency of educational big data in the ETL link is performed, which illustrates the effectiveness of the educational big data platform based on Hadoop. An object-oriented analysis and design method used to analyze and design the business requirements of teaching resource sharing services. From the perspective of managers and teachers, use case diagrams and use case description tables to define system business requirements. The role of teachers is further refined as the theme of teaching and research. Participants, participants in the subject teaching and research, initiators of simulation teaching research and development, participants, famous teachers, high-quality course judges and experts. The recording, accumulation, statistics and analysis of students’ learning behaviors will provide more valuable applications for school education.
Introduction
With the in-depth development and wide application of information and network technologies, the pace of informatization in all walks of life has accelerated. The construction of education informatization is no exception [1, 2]. The traditional manual statistics, handwritten reporting, and manual analysis modes will not be able to meet the development needs of the education information age. In order to further standardize the management of education data and improve the quality of education, a city’s education bureau proposed the construction of a statistical analysis platform for education data, which aims to integrate network information The design and planning of platform services, using computer technology to centrally manage educational data such as student resources, teacher resources, and school resources in a city, and at the same time design scientific and reasonable education data analysis and business processes to provide data decisions for each department of the Education Bureau Support and improve the scientific nature of the plans and programs of relevant departments of the Education Bureau, and further improve the work efficiency and service quality of the Education Bureau [3, 4]. Cloud Computing (Cloud Computing), which has developed rapidly in the past two years, has put forward the concept that “hardware and software are resources and packaged as services, and users can access and use them on demand through the network”. This technology is to achieve high-quality teaching resources [5]. Co-construction and sharing have become a reality. Therefore, various types of cloud-based teaching resource public service platforms have sprung up, providing a convenient and effective supplement for our teaching.
Educational big data is a large amount of data generated in course of teaching practice, which contains high application value. In recent years, the analysis and mining of educational data using big data technology has become a research hotspot. In 2014, Michalik [6] introduced the definition of big data in the education system. In 2015, Hu [7–9] and others proposed the use of distributed storage and processing of educational big data to build a smart campus information platform based on big data technology. In the same year, Robin [10, 11] and others developed a real-time and scalable higher education ranking system with the support of big data technology. In 2016, Zheng Qinghua [12] and others made analysis and research on key technologies based on the collation and collection of higher education data, how to conduct data mining through big data related technologies, and further improve the training of talents in higher education. Zhang G [13, 14] and others proposed an online education big data analysis platform, which aims to improve the quality of education by using big data technology to analyze a large amount of data generated during the online education process. Yunus [15, 16] and others used machine learning and big data methods in online education systems to provide targeted learning assistance to students based on their characteristics. In 2017, Li [17, 18] and others used Spark to collect, analyze, and store school data. Established a higher education monitoring platform to better understand the development status of higher education and provide a basis for educational decision-making. Ruonan X [19] and others based on the characteristics of cloud computing and big data, discussed the problems faced by online education interaction, built an online education interaction platform, and efficiently realized the online interaction between teachers and learners. In 2018, Zhang W [20–22] and others expounded the process of how to transform raw data into useful information in educational data mining, and studied the key technologies of educational data mining. In 2019, Shen Guiqing [23] and others analyzed and mined student data on the Hadoop platform and predicted student performance.
Educational big data is the development of traditional education data and the product of information technology innovation and education informatization. With the rapid development of communication technology and mobile devices, educational data is being generated at an unprecedented speed [2], and the data forms are diversified, including not only basic education data, but also educational data in the form of sound, text, pictures, and video.. These educational data greatly exceed the ability of commonly used software and tools to process analysis and management [3], but the huge social, economic, and scientific value is hidden in the educational data. How to quickly and accurately extract the required information from massive educational data becomes Major issues that need to be addressed. Therefore, a platform that can store and manage educational big data in time is needed.
Based on the above research, it is learned that the analysis and mining of educational big data are mainly to provide support for educational decision makers to make decision plans, to provide guidance for teachers to improve teaching activities, and to help students make reasonable plans. Therefore, the analysis and mining of educational big data is of great significance. However, at present, there are relatively few application systems that use big data technology to store and manage student resources, teacher resources, and school resource data and perform further statistical analysis. This paper integrates and analyzes related technologies of the Hadoop ecosystem and builds Hadoop’s educational big data platform migrates educational big data to the Hadoop platform for unified storage management and statistical and multidimensional analysis, providing more efficient services for educational decision makers.
Educational resources big data platform construction
Platform framework and related technologies
The teaching platform is a new type of teaching mode constructed by the application of modern information technology means such as computer technology, multimedia technology, network communication technology, digital technology, and virtual reality technology. It has a variety of functions by integrating modern education concepts, teaching content and modern information technology. Open teaching and learning interaction system, the basic technical architecture is shown in Fig. 1.
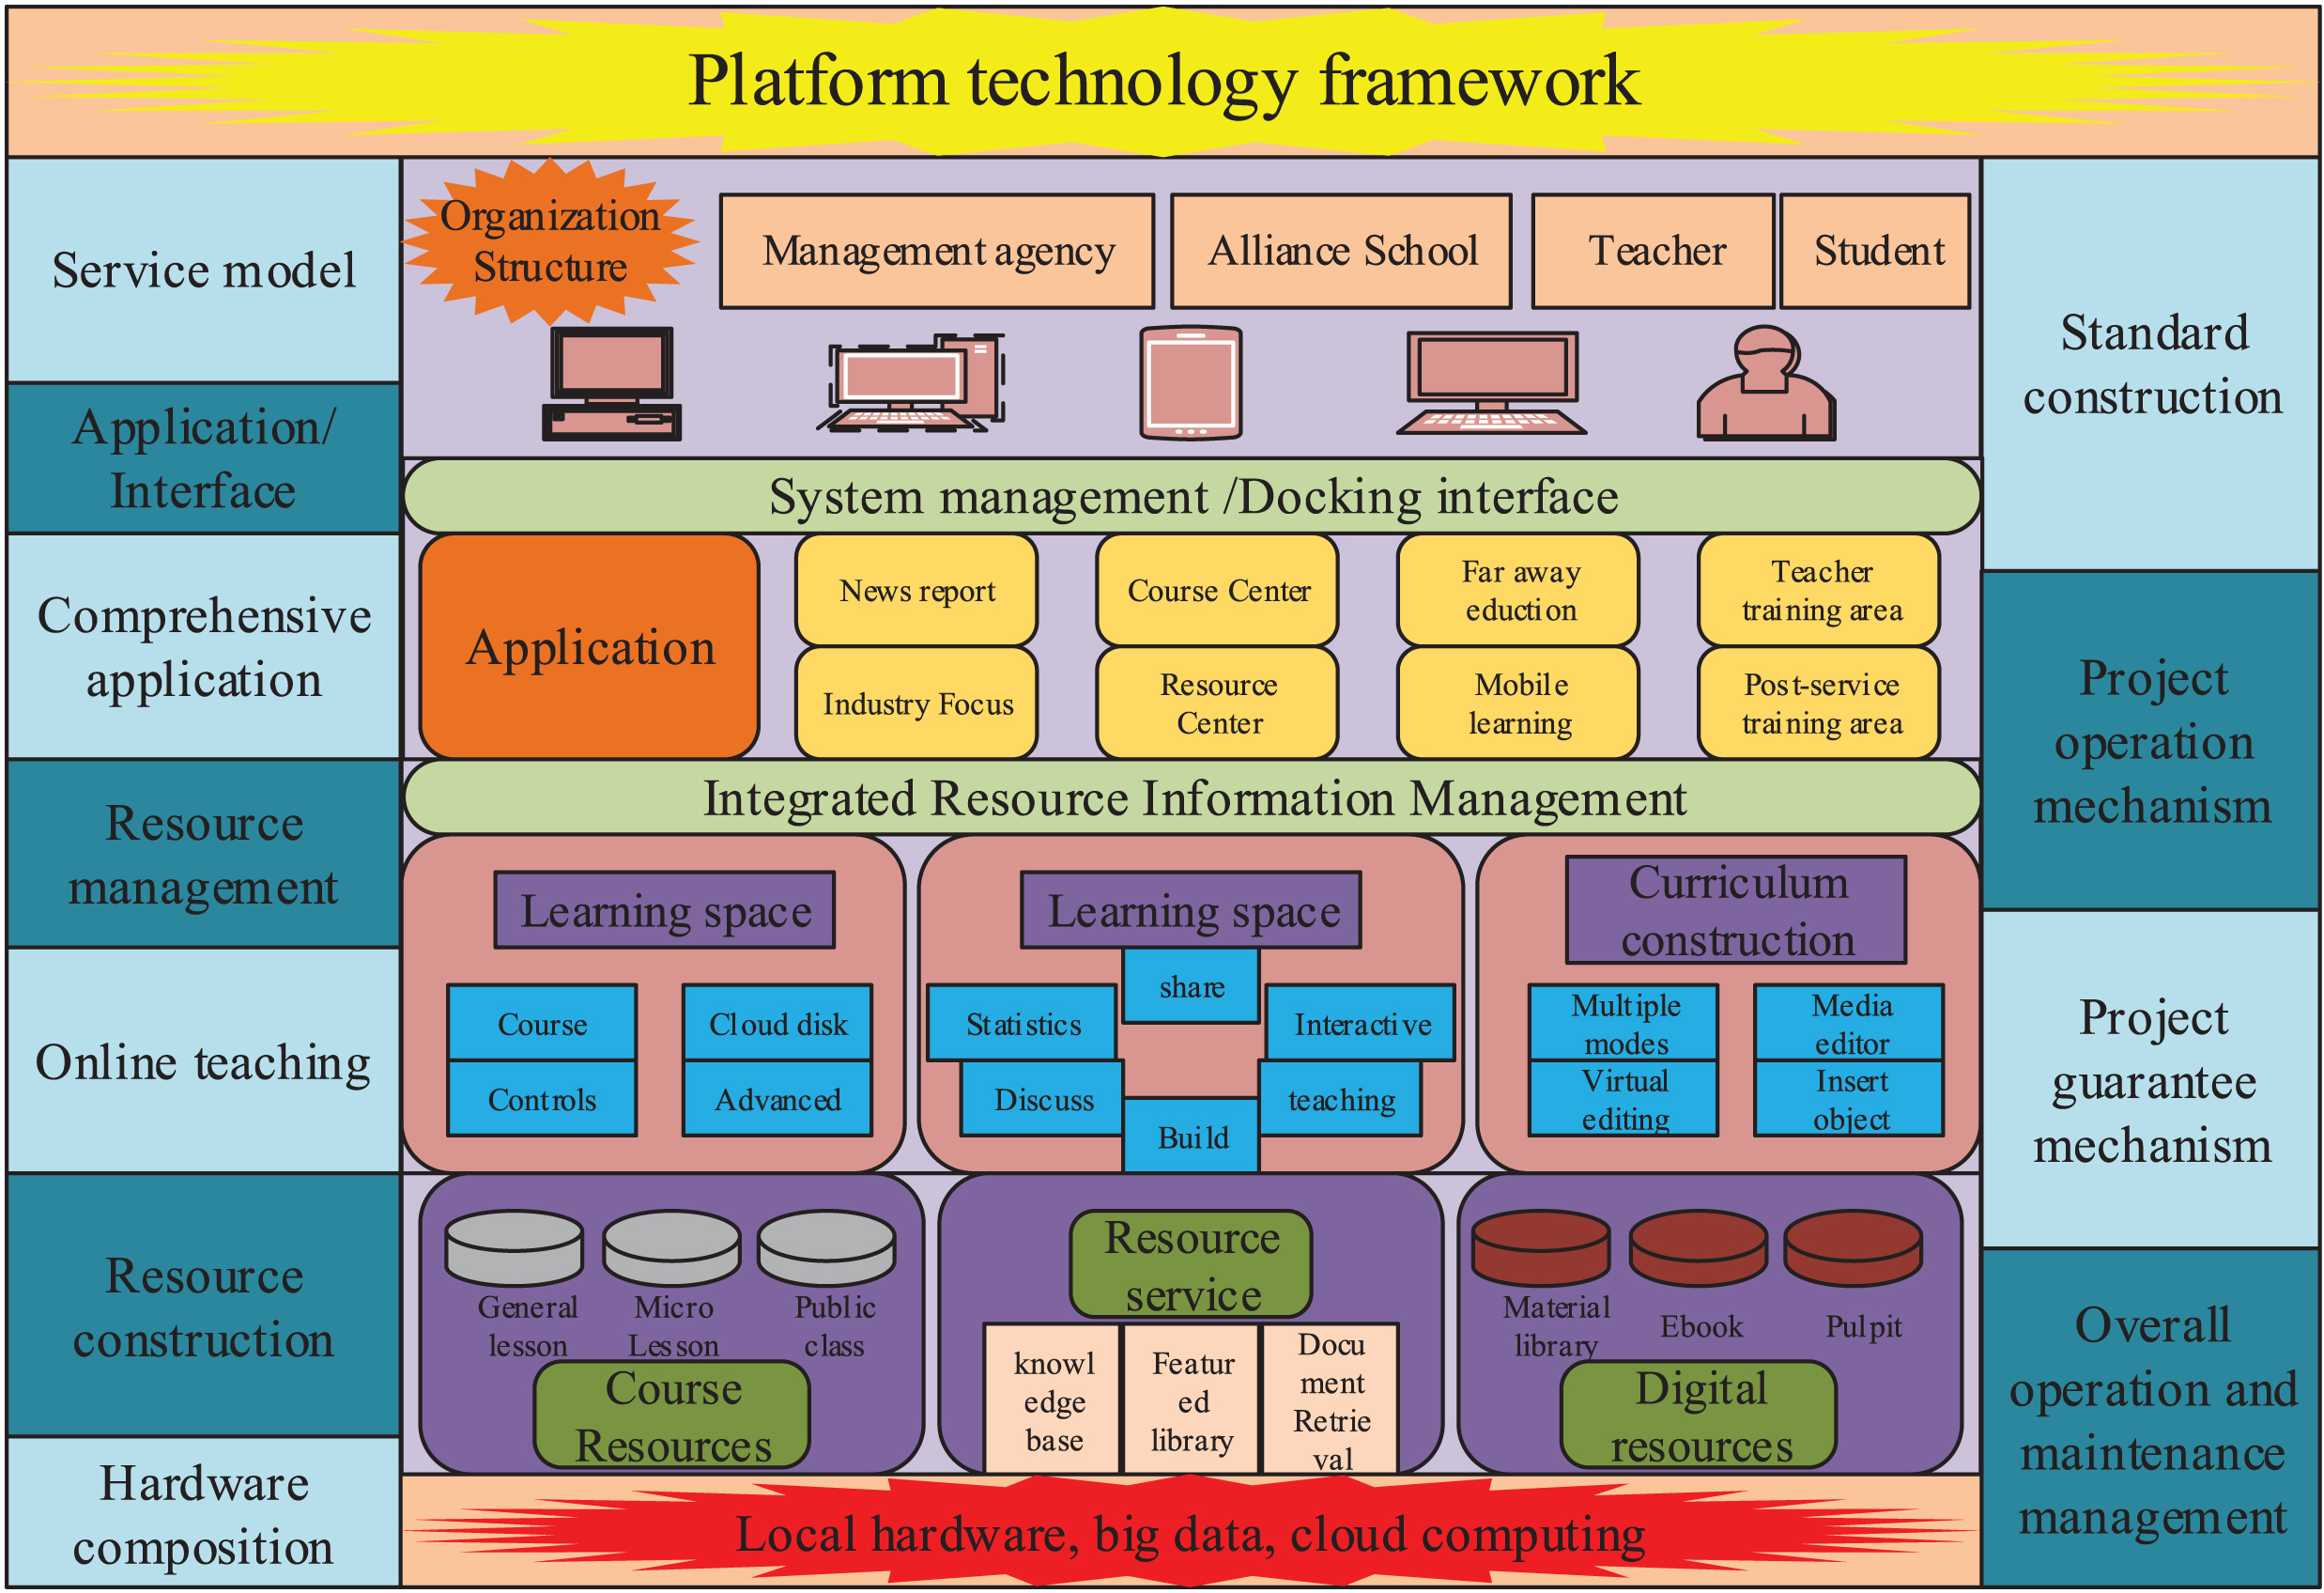
Platform technology framework.
HBase is based on Goole’s Big Table database and adds a distributed, fault-tolerant, and scalable database [12]. Each HBase table is stored as a multidimensional sparse map, containing rows and columns, each cell has a timestamp [14], HBase has its own Java client API, and the tables in it can be used as input sources through Table Input or Table Output Format and MapReduce job output targets. HBase uses HDFS as the underlying file system. It is designed to be fully distributed and highly available, but has different storage characteristics than Hive, enabling row updates and column indexes. HBase can perform real-time reading, writing, and random access to very large data tables. Built-in scalability, when the system is put into operation, it can be expanded by adding servers to the cluster. Any scan results of HBase tables are MapReduce jobs. Parallel scans based on MapReduce job results can reduce query response time and improve overall throughput. The HBase architecture is shown in Fig. 2.

HBase architecture diagram.
HBase is similar to HDFS and MapReduce, but also adopts a master-slave architecture. HMaster is responsible for assigning regions to HRegionServers and recovering from HRegionServer failures. HBase uses another subproject, Zookeeper, in Hadoop to manage the HBase cluster. The functions of each component in HBase are as follows.
(1) Client
The Client checks the HBase Master to determine which server it should request for read / write operations.
(2) HMater
HMater monitors the health of each HRegionServer [20], and if it detects that a HRegionServer has failed, it will reassign the regions. In addition, it performs management tasks such as resizing regions, copying data between different HRegionServers, and so on.
(3) HRegionServer
HRegion Server is a physical server that stores and provides data and is responsible for managing client read and write requests. Serve client requests by obtaining or updating data stored in the Hadoop Distributed File System (HDFS).
(4) HRegion
HRegion is a logical scheduling unit managed by HRegionServer. Each HRegionServer has multiple HRegions (regions) under its control. HRegion consists of MemStore and StoreFile. A column cluster usually has one HStore, and multiple HStores form one HRegion. During the writing process, data is first written to Mem Store. When the number of StoreFiles reaches a certain threshold, it will trigger a merge operation to merge multiple StoreFiles into one StoreFile. Version merge and data deletion are completed during the merge process, which results in operations on data increments, which ensures high data write efficiency.
Apache Hive is a data warehouse infrastructure tool for working with structured data in Hadoop. It is similar in many ways to traditional relational databases. It can map structured data files to database tables and provides a convenient SQL query language for extraction, transformation, and loading (ETL). Hive converts query statements written by HiveQL into one or several Hadoop MapReduce jobs, and then submits these jobs to the underlying Hadoop cluster to run.
Sqoop is developed for data migration between relational databases and Hadoop platforms. It is similar to other ETL tools for importing and exporting data from relational databases to Hadoop platforms, enabling users to migrate large amounts of data to the cloud Environment and access via cloud technology.
LSTM improves the middle part of the recurrent neural network and uses the forget gate, memory gate, and output gate to control the interaction of information. Selectively delete long-term information stored in memory according to the current information in the forgetting gate, use Sigmoid () to control the output value between 0 and 1, and delete unimportant information by setting it to 0. In the memory gate, the information stored in the long-term memory S is selectively added according to the current information, and the output gate is the final output based on the information stored in the updated long-term memory S.
The calculation formula of the forget gate is shown in formula (1) and formula (2).
In formula (1) and formula (2), yrf is the output forget value of the forget gate, wf is the weight value of the forget gate,bf is the offset value of the forget gate, t–1 is the short-term memory hiding layer, and xt is the current moment The input value of S’t-1 is the long-term memory hidden layer after the forgetting gate update, and St–1 is the hidden layer of long-term memory.
The calculation formula of the memory gate is shown in formula (3), formula (4), and formula (5).
In formula (3), formula (4), and formula (5), yrs is the memory value output by the memory gate, w i is the memory right of the memory gate, b i is the memory bias value of the memory gate, and yrm is the memory information value of the memory gate, wc Is the weight of the memory gate, bc is the bias value of the memory gate, and St is the value of the hidden layer of the long-term memory after the final update.
The calculation formula of the output gate is shown in formula (6) and formula (7).
In formula (6) and formula (7), yr is the output feature value, wo is the output gate weight value, and bo is the output gate offset value, yt is the predicted output value, and t is the value of the short-term memory hidden layer.
The educational data statistical analysis platform uses the.NET Framework (.NET Framework) for construction. The database is SQL Server 2008. The development platform mainly uses C# language. The front-end uses Html pages and CSS styles, combined with JavaScript. According to business needs and design requirements, at the same time, based on the actual needs of the platform, the more general integrated development environment Microsoft Visual Studio 2010 was selected for development. The software and hardware environment of the platform is shown in Table 1.
Platform software and hardware environment
Platform software and hardware environment
Provide unified certification, realize single sign-on, provide information integration and teaching course display; coordinate course construction, manage digital resource integration and sharing, electronic teaching and reference, resource evaluation and recommendation; provide course videos, teaching calendars, discussion questions and answers, assignment submission and review, Digital resource query, APP management; full-process online teaching, teaching organization management, online video services, data mining, learning behavior monitoring, data statistics and analysis; teacher space construction, course push, academic socialization.
Educational source data is divided into structured education data and unstructured education data. Structured education data mainly includes basic education data and education business system data; unstructured education data mainly includes education yearbook data and education picture data. According to the classification of educational data sources, corresponding storage methods are established. Structured education data mainly includes basic education data and education business system data. This type of education data is stored in a database table in a SQL Server 2008 database. The basic education data includes the student resource data base table, the teacher resource data base table, and the school resource data base table. The education business system data mainly includes the education business system data tables. In particular, in order to optimize the efficiency of statistical analysis, the frequently used statistical data is also stored in the database as a statistical table. Table 2 lists the regional student statistics.
Statistics of regional students
Statistics of regional students
The yearbook management mainly uses customized query methods for the collected yearbook information and private information, so that educational decision makers can easily and quickly understand the comprehensive, authentic and systematic education statistics in a certain year, so as to understand the current state of education and research in a city Education development trends. Yearbook management includes yearbook inquiry and private inquiry. Realize the catalog query, online preview, quick retrieval and download of the yearbook information and private information.
Entering the yearbook query interface for the first time will display the yearbook information for the most recent year, including the yearbook name and the yearbook directory. Click on the yearbook pdf to view it. At the same time, you can preview and download the excel file of the yearbook directory on the homepage, and you can also search for the yearbook information of a certain year according to the user’s needs. In the yearbook management, some online previews of pdf, word, excel and other files are involved. For pdf files, this article uses the H5 + pdf.js plugin. The purpose is to create a universal, standards-based web platform for users that can parse and render PDF files. Its advantage is that the PC and mobile do not need to spend too much effort to adjust, without any local technical support. For online preview of word and excel files, you need to read the file first and then convert it to html to implement, which delays the response time of the client. As shown in Fig. 3, it is a flow chart of querying the yearbook.
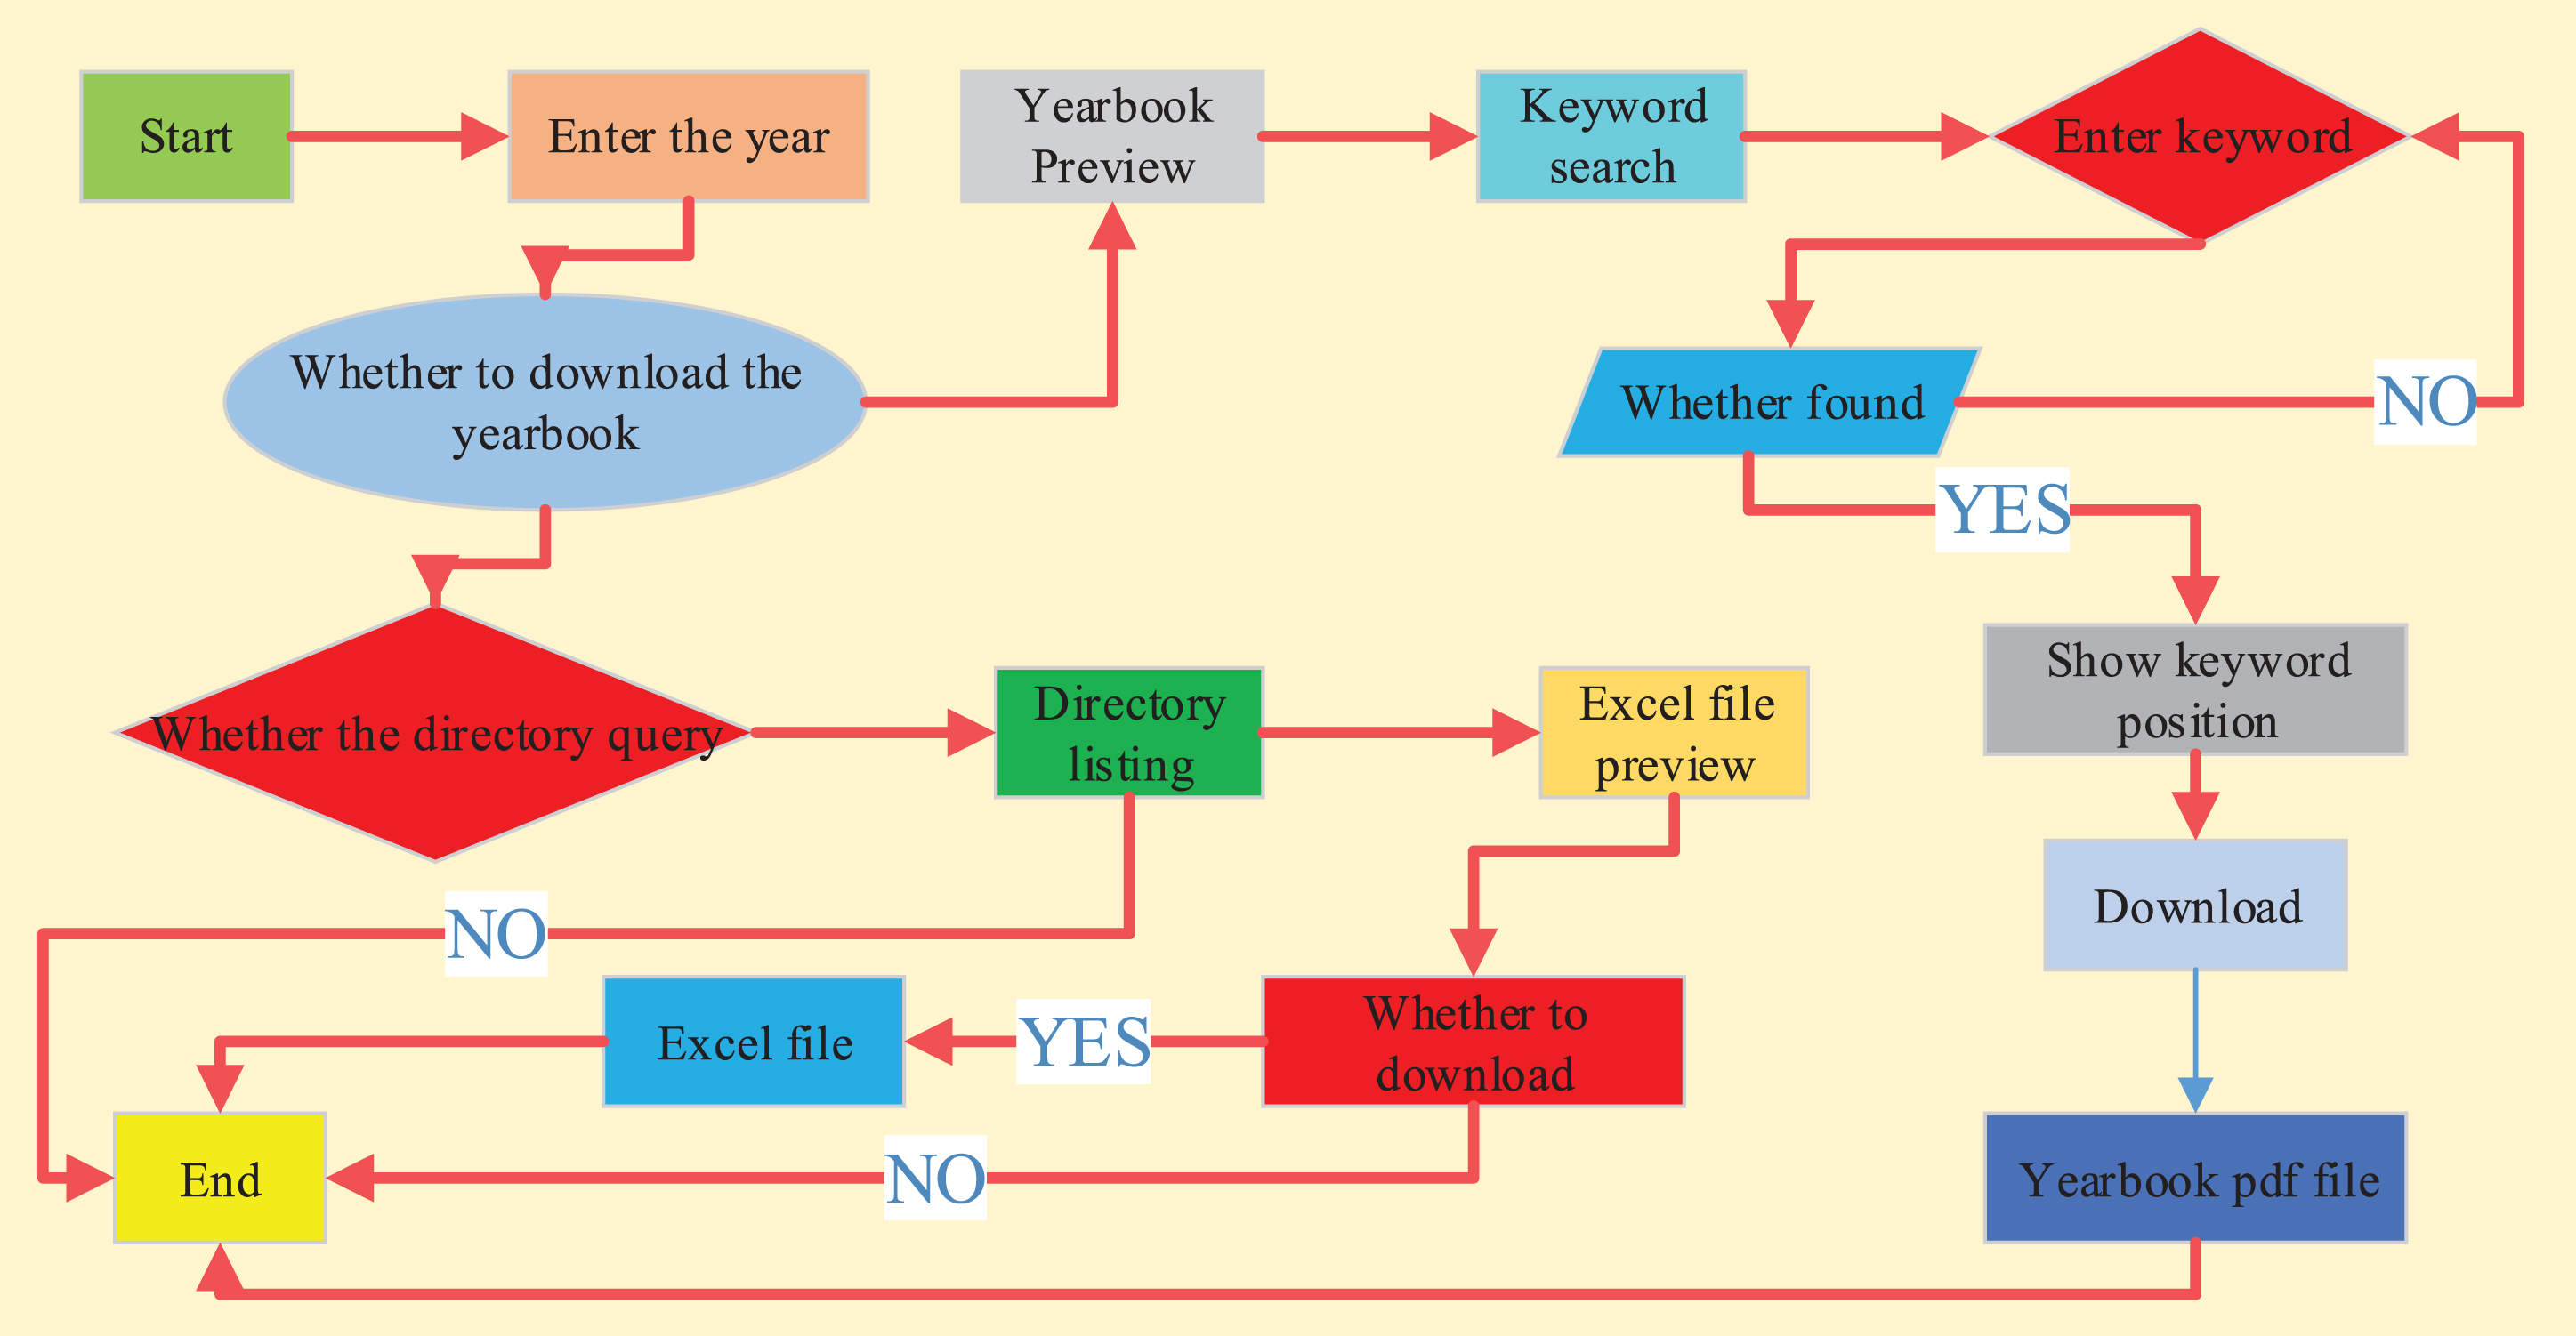
Yearbook query flowchart.
The education GIS map is divided into two parts: an open platform and background management. The background management module is to manage and maintain the school status (on / off) and school details. The open platform displays schools (institutions) in a certain city on the Baidu map according to the area, so that users can observe the distribution of all schools in the area. At the same time, the school information list is displayed in the sidebar, which is convenient for users in real time. Check it out. Users can also conduct fuzzy searches for schools based on region, semester, school running nature, and school name, and locate the queried school on the map in detail.
Student migration uses maps to show the number of students who moved from other provinces to a city in primary and secondary education, vocational education and special education in the past year, so that education decision makers can more intuitively understand the migration of a province outside a city. Student situation.
Data analysis is a statistical analysis of school resource data, teacher resource data, and student resource data from the dimensions of regions and schools. It provides statistical data for various work summaries and provides a basis for formulating related policies.
In the education data prediction function, it is necessary to predict the possible development trends of the student data and teacher data in order to better support the relevant decisions of the education management department.
Analysis of platform terminal proportion
We can make use of the statistics, analysis, and monitoring of all teaching activities on the teaching platform to further facilitate school management of teaching activities. It can also negotiate with suppliers, provide customized development, realize the listing and charting of all statistical data, and support the export of original data, which is convenient for schools to do personalized statistical analysis. Listed below is the application of background statistical analysis of the unit.
According to the big data of the teaching background in the fall of 2019, the terminal usage of students is shown in Fig. 4 below: The use of the “Learning Link” app accounts for more than 80%, and mobile learning has become the main way for students to learn general courses.

Proportion of terminals when students are studying general education.
From the above figure, we can clearly analyze that the use of mobile phones for learning has become mainstream, and the demand for wireless network or mobile phone traffic is increasingly urgent. Therefore, in the network infrastructure construction in the coming year, we have increased the investment in wireless network construction resources to build a wireless network that is more suitable for students’ autonomous learning.
Taking the autumn semester of 2019 as an example, 2612 students in our college took 13 general courses. From the statistics, the five courses with the largest number of courses are: Dance Appreciation (400 people), Eloquence and Social Etiquette “(400 people),” Peak of Chinese Classical Fiction: Appreciation of the Four Great Masterpieces “(400 people),” Appreciation of Fine Arts “(384 people),” Love Techniques of College Students “(359 people). The specific course selection is shown in Fig. 5.
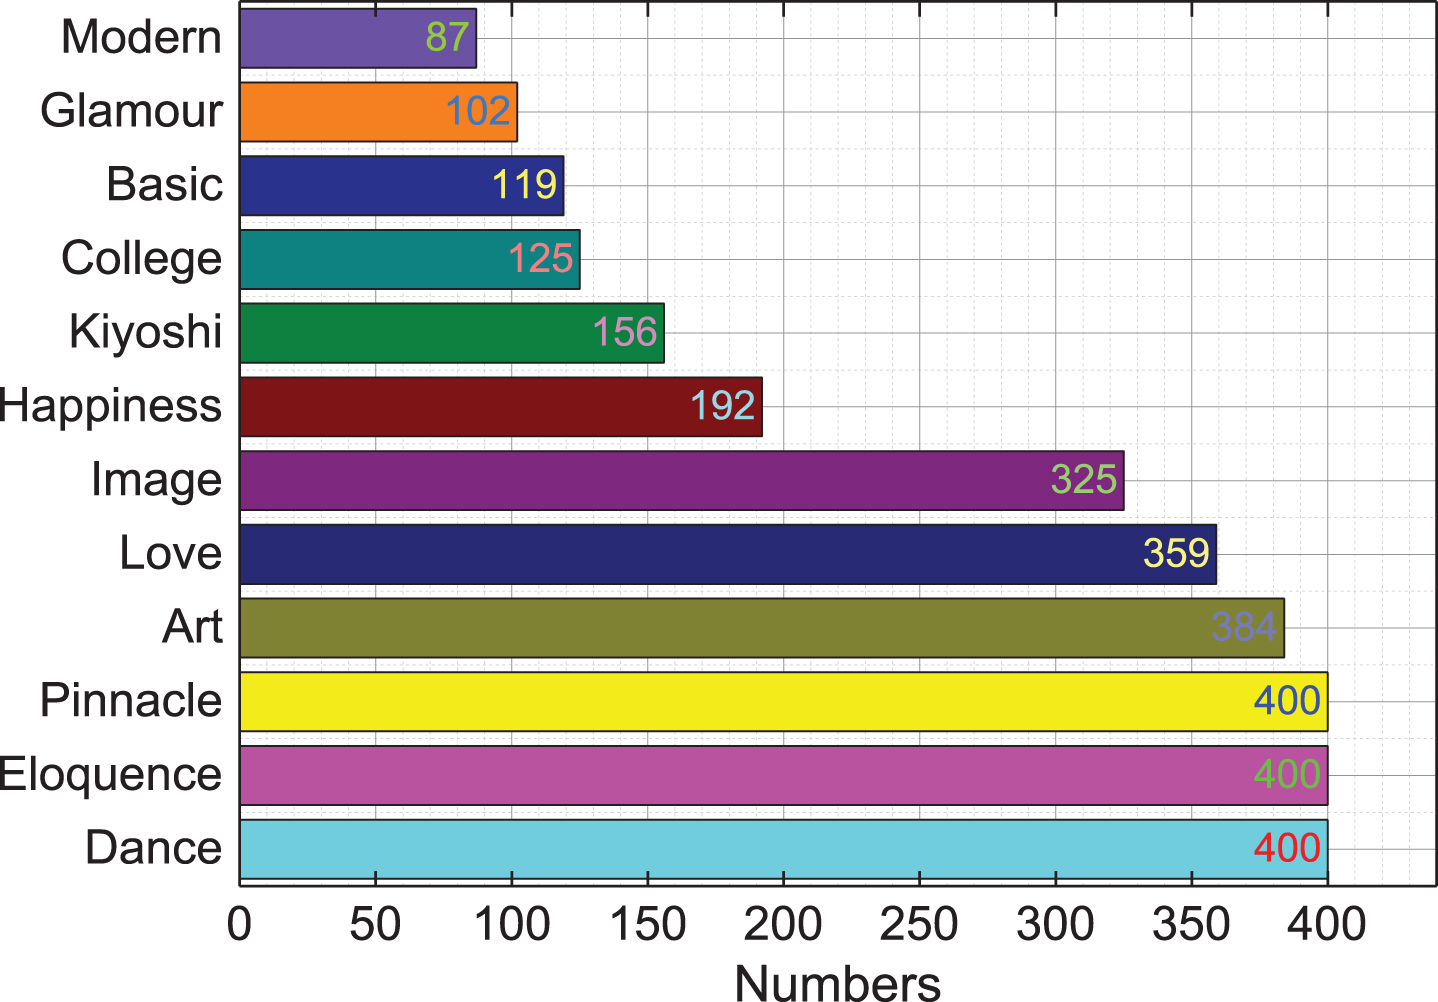
Statistics of the number of students enrolled in each course.
Analyze the weekly visits of students as shown in Fig. 6. Students ‘study time has a wavy increase and decrease, and they are more inclined to complete online learning on Tuesday, Wednesday, and Thursday. This situation reflects that the enthusiasm for students’ learning is concentrated in the week. However, there is a clear lack of motivation on the weekends, and Monday is an adjustment period. Therefore, we can refer to this data when scheduling classes, make scientific planning, and reasonably distribute them to make the arrangement of the courses more in line with the rules of student learning.
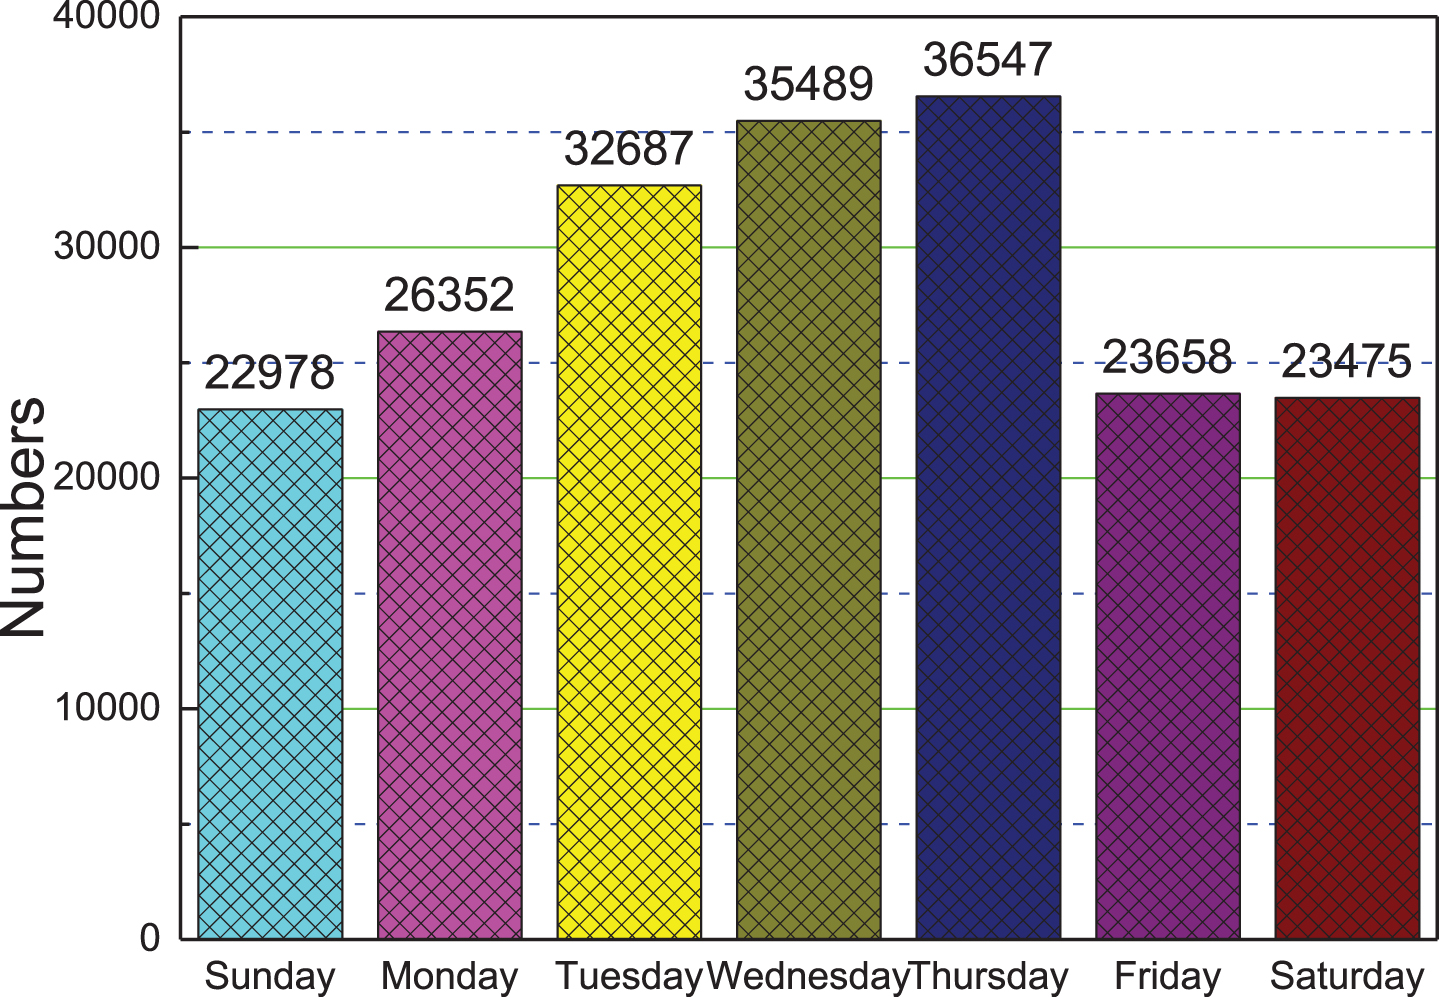
The number of students’ learning visits (by week).
Secondly, the statistics of student visit periods are shown in Fig. 7. It can be clearly seen that the student study time has a step-up trend, and the main periods are concentrated between 12 o’clock and 20 o’clock. This is contrary to our experience that students learning energy is best in the morning. Therefore, teachers can be advised to increase after-school tasks to allow students to learn independently. At the same time, more self-study classrooms were opened to provide ample learning space.

Students’ learning visits (by time period).
Data prediction is mainly to realize the prediction of the number of students and teachers. This paper uses curve fitting, RNN and LSTM neural networks to build prediction models. In this experiment, the number of students in a city from 1987–1993, 2001–2007, and 2013–2019 was used for modelling. The student data is shown in Fig. 8.

Student data for some years.
Use the data from 1987–2019 as a training dataset to build a model, and use the model to predict the number of people from 2015–2019. The final prediction result is shown in Fig. 9. The forecast error in 2015 is 6.33%, and the forecast differs from the actual number by 34,055. The forecast error in 2015 is 11.94%, and the forecast differs from the actual number by 67,631. The forecast error for 2019 is 20.49%, and the forecast differs from the actual number by 122,520. So the average error of this prediction model is 12.92%.
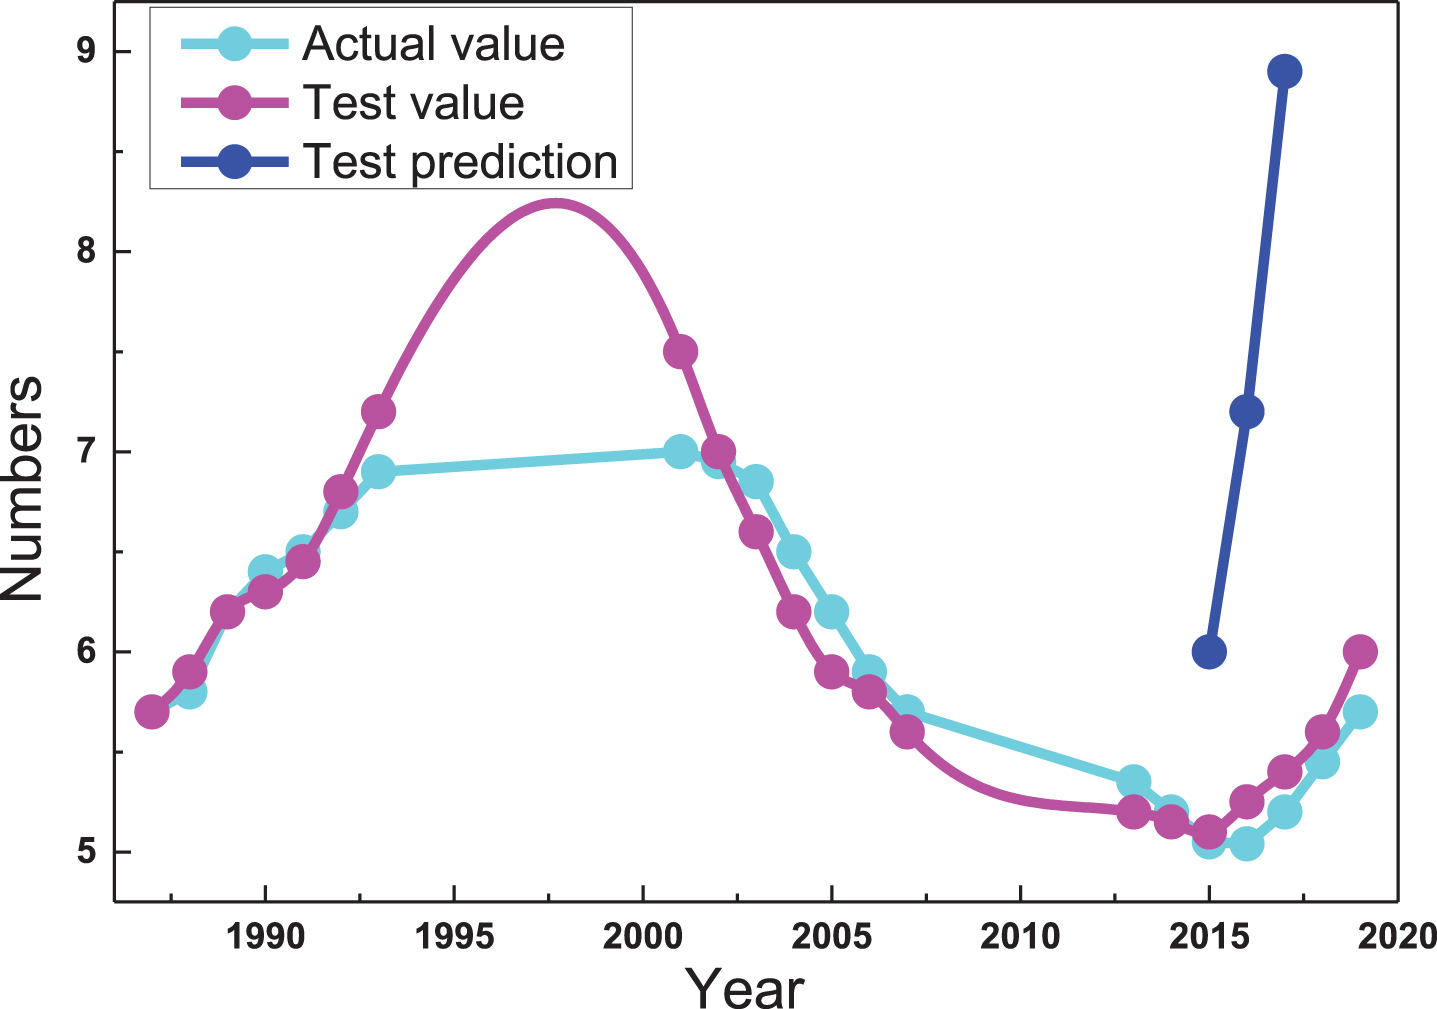
Actual and predicted number of students based on curve fitting model.
Use the data from 1987–2019 as the training data set to build the model, and use the RNN and LSTM model prediction results to analyze the number of people in 2015–2019. The results are shown in Fig. 10. Using the analysis of the prediction results of the RNN model, the prediction error in 2015 was 2.79%, and the difference between the prediction and the actual number was 15,019. The forecast error in 2016 was 3.42%, and the forecast differed from the actual number by 19,339. The forecast error for 2019 is 0.24%, and the forecast differs from the actual number by 14, 15 people. Therefore, the average error of this prediction model is 2.15%. The curve of the actual value and predicted value of the number of people is shown in Fig. 10, where blue is the actual value curve, red is the final model predicted value curve of the training data, and green is the test predicted value curve. This part of the data is not trained. Analysis of the prediction results using the LSTM model showed that the prediction error in 2015 was 6.19%, and the difference between the prediction and the actual number was 33,297. The forecast error in 2016 was 3.69%, and the forecast differed from the actual number by 20,890. The forecast error in 2017 was 0.95%, and the forecast differed from the actual number by 5,660.
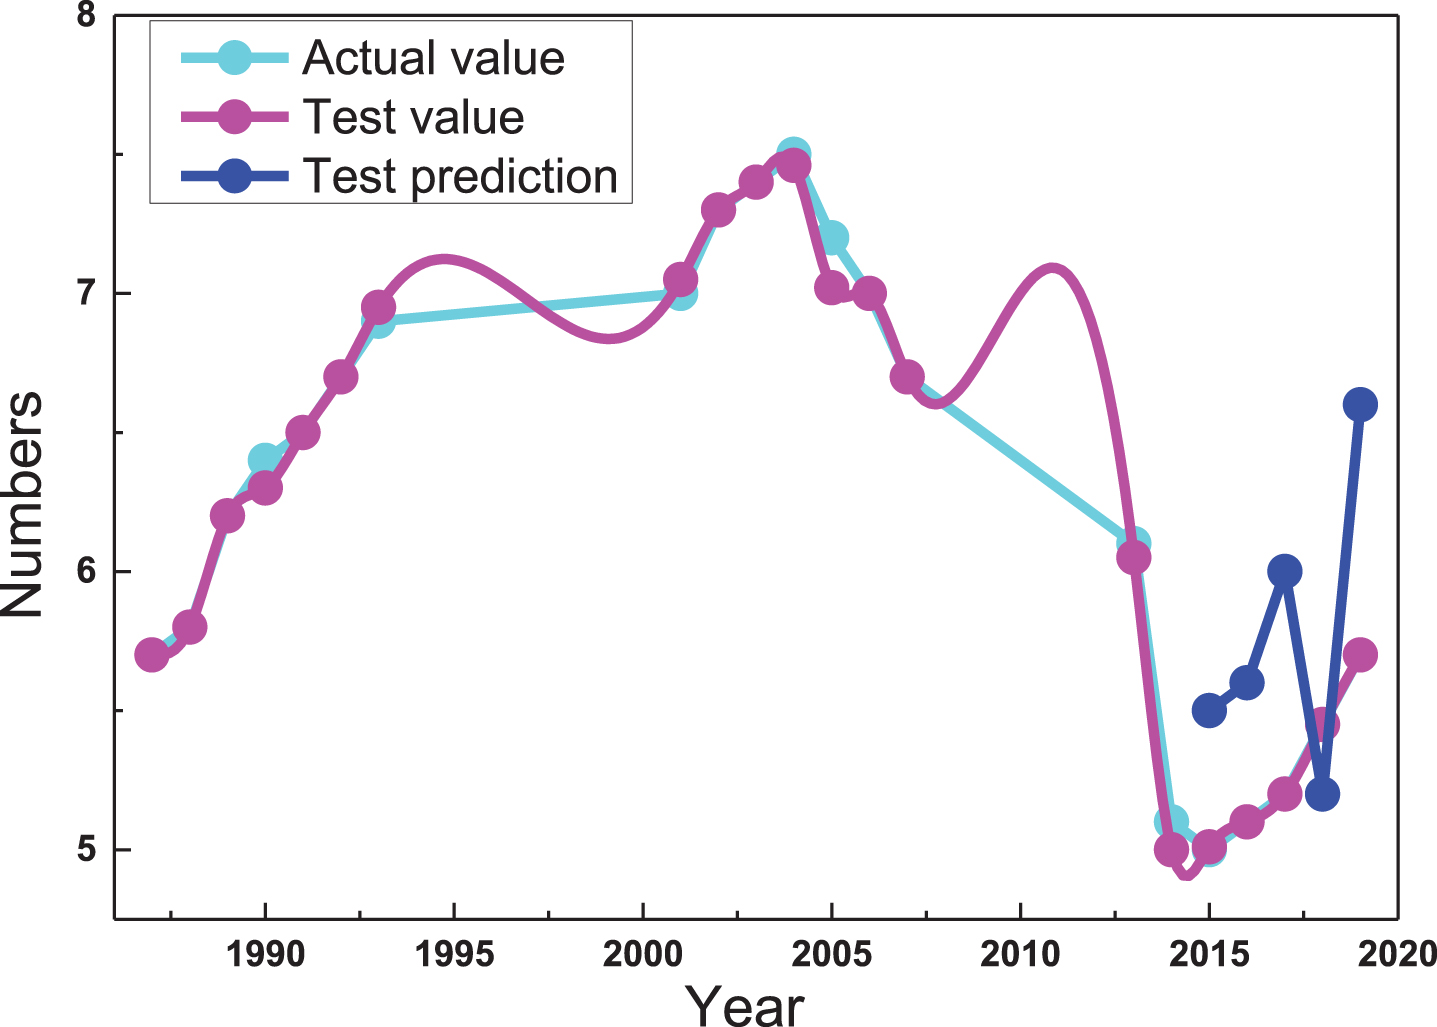
Actual and predicted student numbers based on RNN and LSTM prediction models.
The application of the network teaching resource platform is an effective attempt and a supplement to traditional teaching in domestic vocational colleges and even undergraduate colleges. According to the construction methods, there are mainly three types: one is the school’s own construction; the second is the education administrative department and other leaders to build an education platform based on cloud architecture; the third is the teaching resource platform developed by commercial companies. Regardless of the type of construction method, it will ultimately serve education and teaching. It is active in changing traditional teaching methods, introducing modern information technology and means, breaking down barriers between schools and schools, and realizing the construction and sharing of high-quality teaching resources. Push role. The statistical analysis of background data based on this platform is far more important than our current use of platform functions. Because the accumulation, statistics, analysis and mining of education data, especially student learning behavior data, will provide decision-making references for our future education and teaching, provide a basis for judging the adjustment of teachers’ teaching behavior, and provide effective suggestions for curriculum establishment and teaching methods. Therefore, we can fully expect that in the future use process, the network teaching resource platform will play a statistical accumulation of data and mining and analysis capabilities, to provide users with more service functions. On this basis, using cloud technology theory and block chain technology to build a city-level, provincial-level, and even a national-level big data platform, statistical analysis of the data will provide more scientific and efficient Reference.
Based on the needs of a city’s education bureau, this paper first designs and implements a statistical analysis platform for education data, which meets the needs of the education bureau and puts it into use. Set up a platform development environment to realize the migration of educational big data, and use Java language to call Hive to achieve statistical analysis of educational data, and compare the ETL efficiency with the educational data statistical analysis platform, which proves that the Hadoop-based educational big data platform handles education The performance of big data is better, it has high scalability and also supports unstructured educational data storage. Then, in order to cope with the storage and statistical analysis performance degradation caused by the rapid growth of educational data, a Hadoop-based educational big data platform was researched and designed, and the functions of the educational data statistical analysis platform were transplanted and extended to the Hadoop-based educational big data platform. According to the requirements, functional modules for yearbook management, educational GIS maps, student migration, data analysis, and data prediction were designed in detail to meet user needs and put them into use. In the education data prediction function, don’t design an education data prediction model based on RNN and LSTM to predict the future development trend of the number of students and teachers in the education data. When the amount of education data is relatively small, the effect of using the RNN model is more effective. The multi-dimensional data model is used to research and design the educational data warehouse based on Hadoop, and the educational data is migrated to the Hadoop platform for unified storage and management to meet the educational decision makers’ analysis from multiple perspectives and dimensions.