
Abstract
The actuator is an important component of missiles and other aircraft to maintain the flight attitude. A method to calculate the power of the electric servo motor was proposed according to the load characteristics’ of both the servo motor and actuator. An optimization method for the transmission reduction ratio was obtained by considering the load torque equation. Dynamics simulations of the actuator were conducted under a variety of conditions. The simulation results show that the clearance and the friction between the ball screw and the fork, which consist of the transmission mechanism, induce the torque fluctuations, as a source of noise in the motor load. According to the optimization design of the Electric, the Actuator prototype has passed the test, the performance meets the design requirements.
Introduction
The electric actuator is a position closed-loop control system, which consists of a motor, reducer, angular displacement sensor, servo controller, and other parts [1]. After receiving the steering command sent by the missile borne computer, the electric actuator obtains the control deviation compared with the current position angle of the rudder blade. After a certain control algorithm calculation, the motor control signal is obtained, which makes the motor rotate according to the speed of the control signal. After the reducer, the rudder blade rotates to reach the predetermined position. Figure 1 is the schematic diagram of the position, speed, and current three closed-loop control system of the electric actuator [2–6].
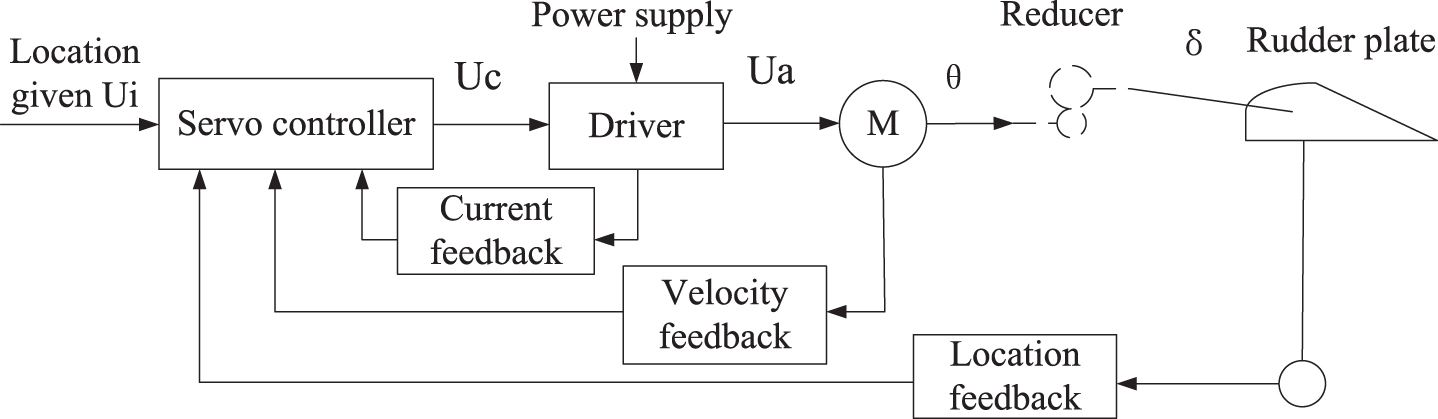
Control block diagram of the electric actuator.
This paper discusses the principle of determining the power of the DC servo motor and the optimization of the reduction ratio by taking the design index of an actuator as an example. Then, the dynamic simulation of the steering gear transmission mechanism is carried out to explore the influence of friction and clearance on the system [7].
The main indexes of the rudder involved in this paper are 1) maximum angular velocity of the rudder surface: ≥100 ° / S; 2) maximum output torque: ≥15; 3) system frequency characteristics: under 15 elastic loads, when inputting±2 ° sinusoidal signal, the output amplitude attenuation is less than - 3 dB or the phase shift is less than 90 °, the bandwidth is not less than 13 Hz.
The selection of the motor and the design of the transmission system is of great significance to the electric actuator. The designer needs to reasonably coordinate the relationship between the two so that the motor and the transmission system can meet the requirements. The rudder is installed in the missile cabin, so the space is very small.
The layout of the motor and reducer largely depends on the size and shape of the reserved space. According to the reserved space in the bomb chamber, it is proposed to adopt a two-stage deceleration structure, including a one-stage cylindrical spur gear drive and one-stage ball screw deceleration (equivalent to the fork slider mechanism) [8]. As shown in Fig. 2, the mechanical structure is shown.
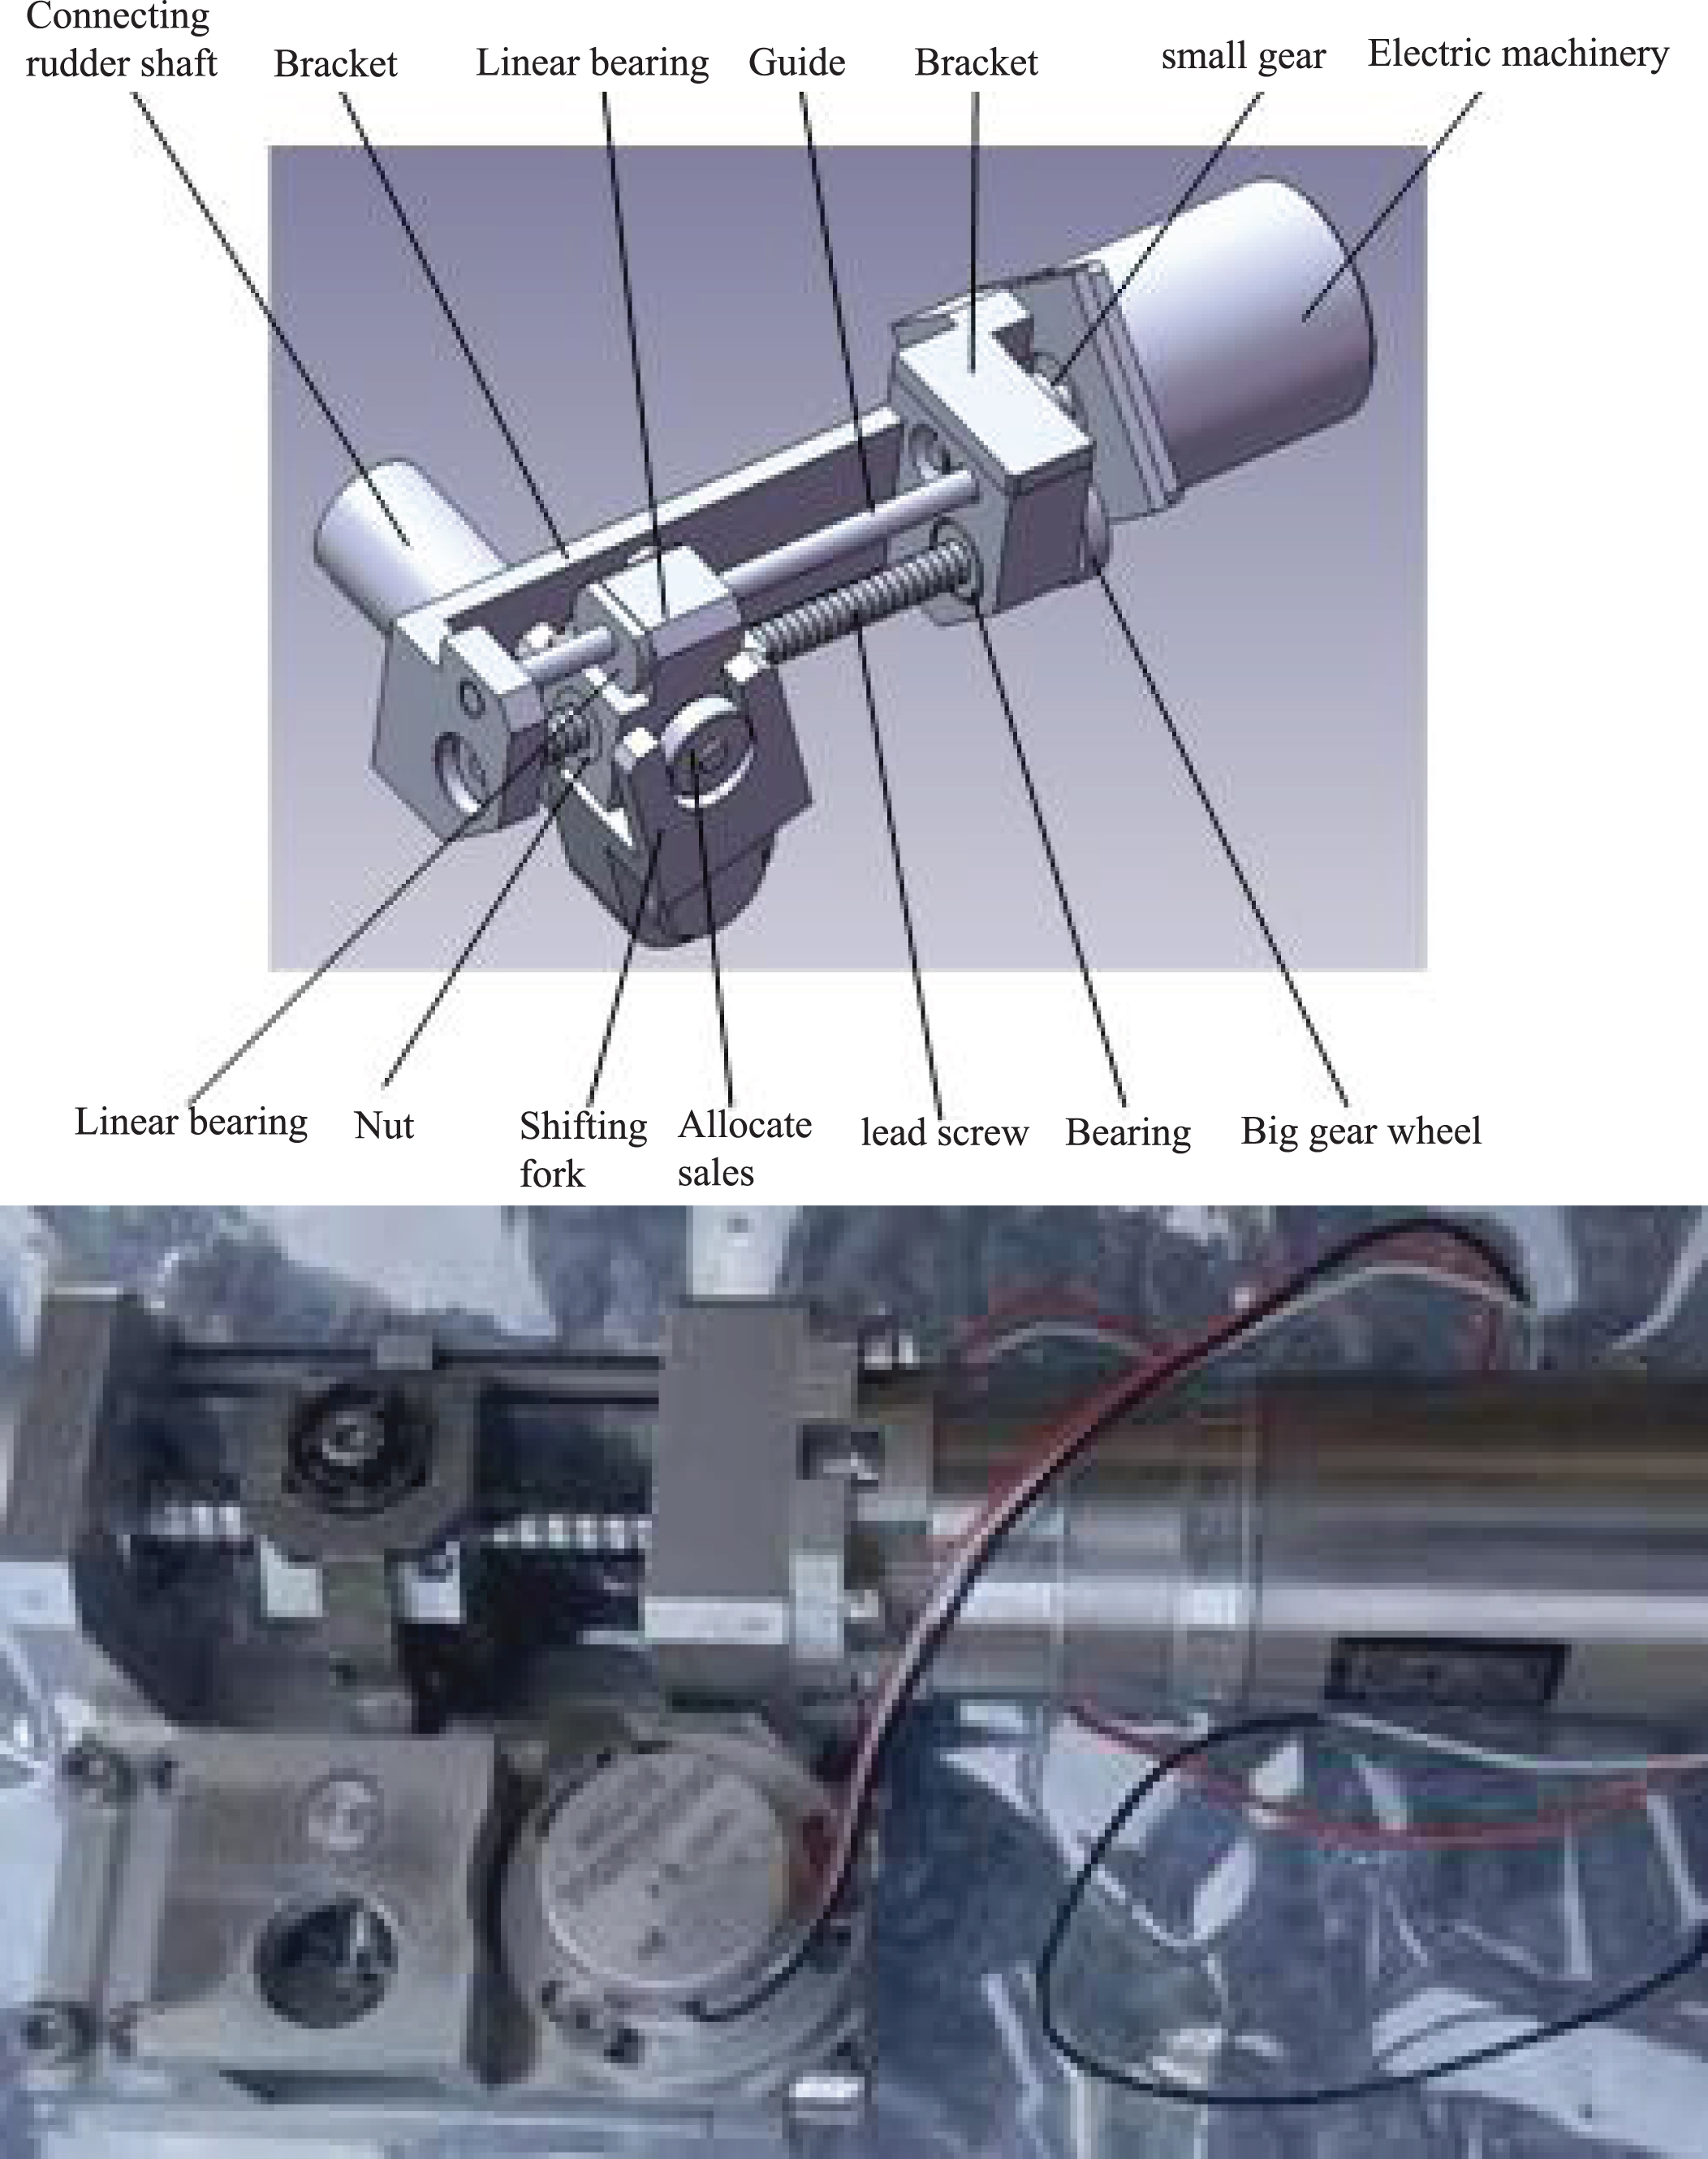
Ballscrew mechanical structure diagram and the real figure.
The load moment of the electric actuator consists of three parts: inertia moment, friction moment, and hinge moment [9, 10].
1) Inertia moment: during the working process, the rudder plate of the electric actuator and all moving parts of the transmission chain will generate inertia force or inertia moment. For the convenience of analysis, these inertia forces or moments are converted to the motor shaft, and the equivalent inertia moment after conversion is TJ. The moment of inertia of the motor rotor and gear is J1, the moment of inertia of the rudder blade along the rudder shaft is J2, and the moment of inertia converted from the ball screw to the motor shaft is J3. Then there are
Where, θ (t) is the angle of the motor rotor, and
2) Friction torque: the friction torque produced by each moving pair in the transmission process of electric actuator mainly includes Coulomb friction torque and viscous friction torque. Among them, the Coulomb friction moment depends on the friction coefficient of the contact surface and the normal load, which can be regarded as a constant within the allowable range [11]; while the magnitude of the viscous friction moment is related to the viscosity coefficient and the moving speed of the object, which is a function of the moving speed. The total friction torque converted to the motor shaft is Tf, Tf1 is the Coulomb friction torque of the motor; Tf2 is the Coulomb friction torque at the seal ring of the rudder blade; i is the deceleration ratio; the viscous resistance of the motor and the seal ring can be ignored. There is a friction moment
3) Hinge moment: in the process of missile flight, hinge moment includes atmospheric resistance, aerodynamic moment, etc., which is related to flight speed, rudder area, rudder shape, angle of attack, rudder deflection angle, etc. It has a linear relationship with the rudder deflection angle and can be regarded as an elastic load. The hinge moment converted to the motor shaft is Th.
Where his the hinge coefficient, and h = Thmax/λmax, where Thmax is the maximum moment required by the steering gear index, and λmax is the maximum steering angle required by the steering gear index.
To sum up, the total load moment Tm converted to the motor shaft is
Take formula (1), (2) and (3) into formula (4) to get
In the course of missile flight, the steering command is an arbitrary waveform. Because the rudder moves near the zero position, the most typical sine wave is used as the excitation to calculate the load characteristics of the motor. Make the excitation signal
Where, δ = λmax, δ (t) are rudder deflection angle and ω
c
are angle frequency required by the frequency bandwidth index of the electric actuator. Because of the following relationship between motor rotor angle and rudder deflection angle in electric actuator
From Equation (7) to the load moment Equation (5), it can be obtained after simplification
And because of
Make
From the above formula, it can be seen that the load characteristic curve of the electric actuator is an ellipse, as shown in Fig. 3. The vertical coordinate is the torque and the horizontal coordinate is the speed. According to the general law of the elliptic equation, we know that the long axis length and the short axis length are

Load characteristic curve.
According to the knowledge of BLDCM
Where n is the speed of the motor, U D is the DC equivalent voltage applied to the brushless motor, I am the equivalent current passing through the motor, R a is the equivalent resistance of the winding, K e is the back EMF coefficient of the motor, and Φ m is the air gap flux.
The motor torque equation is
Where, T es is the output torque, K m is the torque coefficient of the brushless motor, and I am the equivalent current passing through the motor.
According to the basic theory of the circuit, we can know the rated power P = UI. generally, the rated power P of the motor is constant.
From (11) and (12), we can get
After equivalent simplification
Make
It can be seen from the above formula that the speed-torque curve of the motor is in the first quadrant, when the speed of the motor increases, the torque decreases, and when the speed is low, the motor has better overload capacity.
According to formula (11) and formula (15), there are three geometric relationships between the load characteristic curve of the electric actuator and the speed-torque curve under the rated power of the motor, namely, phase separation, phase-cut, and phase-cut. As shown in Fig. 4, curve 1 and ellipse are separated, indicating that the surplus power of the motor is large; curve 2 and ellipse are tangent, indicating that the power matching is good, and there is no place with insufficient power Square and can withstand certain overload in a large range; curve 3 and ellipse are cut, indicating that the motor power is insufficient in the shadow of the figure [12]. It can be seen from this that when two lines are tangent, the power gets the optimal match, but this match is a theoretical state. In practice, when the rated power curve of general motor is not far away from the load characteristic curve of the steering gear, and the area between the two lines is small, that is to say, when the redundant power ratio is small, it is considered as the optimal match.

Load characteristic curves of both actuator and motor.
According to the load moment Equation (5) of the electric actuator, make
The maximum load torque of the electric actuator is
From Equation (17), it can be seen that the maximum load moment of the electric actuator can be regarded as a function of the system frequency ω
c
and the deceleration ratio i. It can be obtained.
Equation (18) can be obtained by deriving ω
c
It can be seen that Tmmax increases monotonically on [0, ∞). When |T
hJeq
| = 0, Tmmax = T
feq
, Tmmax gets the minimum value,
The results show that the maximum load moment Tmmax of the electric actuator decreases monotonically at 0 < ω
c
< ω0 and increases monotonically at ω0< ω
c
. When
Assuming that the deceleration ratio is known, the maximum load moment ThJeq of the electric actuator is a function of the cut-off angle frequency ω c . The pre-designed motor and reducer parameters are brought into the above formula, and the main parameters are: experimental rudder deflection δ = 2°; hinge moment coefficient h = 0.75N · m/°; moment of inertia J1 = 51.2g · cm2, J2 = 10 × 104g · cm2, J3 = 2.5g · cm2; efficiency η = 75%; friction torque T feq = 50mN · m; the deceleration ratio is i = 150,i = 200,i = 250 respectively. The relation curve between the maximum moment response of the electric actuator and the cut-off angle frequency of the system can be obtained as shown in Fig. 5.
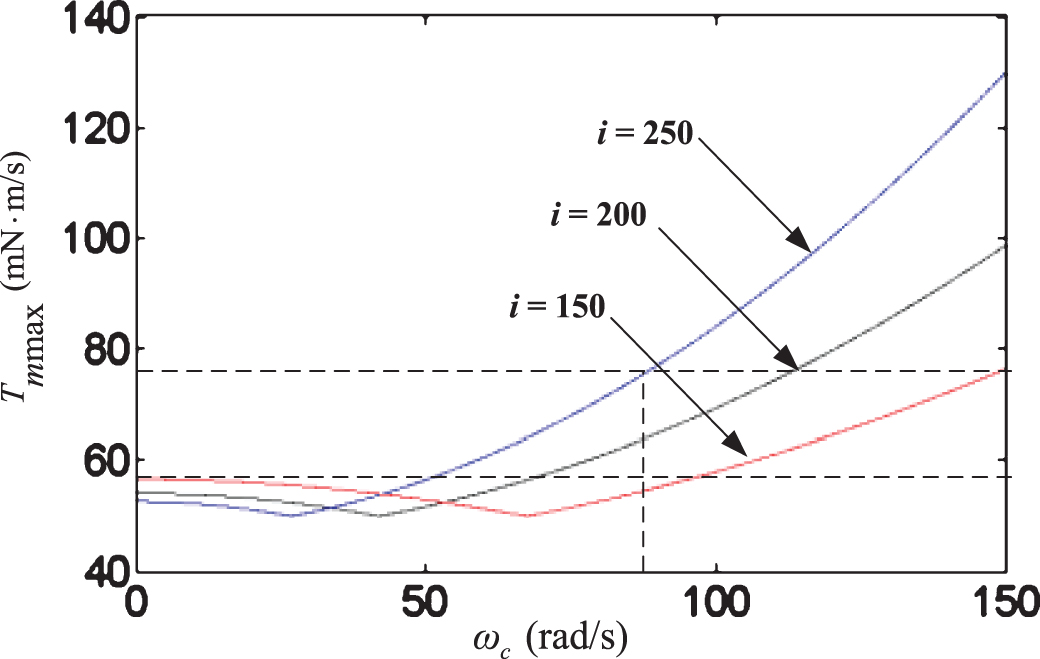
Tax vs. cut-off frequency.
It can be seen from Fig. 5 that the cut-off frequency decreases with the increase of deceleration ratio. When the maximum response frequency of the designed system is less than the cut-off frequency calculated by simulation, the designed motor cannot meet the design requirements, so the maximum response frequency of the designed motor should be greater than the calculated cut-off frequency. It can be seen from the figure that when the deceleration ratio i = 150, the calculated cutoff frequency I s 70 rad / s, when the deceleration ratio I = 200, the calculated cutoff frequency is about 60 rad / s, and when the deceleration ratio = 250, the calculated cutoff frequency is 45 rad / s. Only when the maximum response frequency of the designed actuator is greater than 70 rad / s can the design be reasonable. The design requires that the bandwidth of the electric actuator is 13 Hz, i.e. 81.6 rad / s, which meets the design requirements.
To more intuitively see the relationship between the load torque and response frequency of the steering gear, the load characteristic curve of the steering gear and the speed torque curve of the motor are plotted as follows. When the cut-off angle frequency is changed, the load characteristic curve of the electric actuator is a cluster of ellipses. Figure 6 shows the load characteristic curve of the actuator when the cut-off angle frequency ω c changes from 10 Hz to 20 Hz, and other parameters remain unchanged. The bold ellipse curve 2 is the load characteristic curve of the actuator when ω c = 13Hz is used, and curve 1 is the speed torque curve under the rated power of the selected electric actuator. It can be seen from the figure that the speed torque curve of the motor is close to the tangent of the load characteristic curve of the steering gear at ω c = 13Hz, which shows that the power meets the requirements, the selected motor is enough to meet the performance requirements of the electric steering gear, and it can bear a large overload capacity within a certain range.
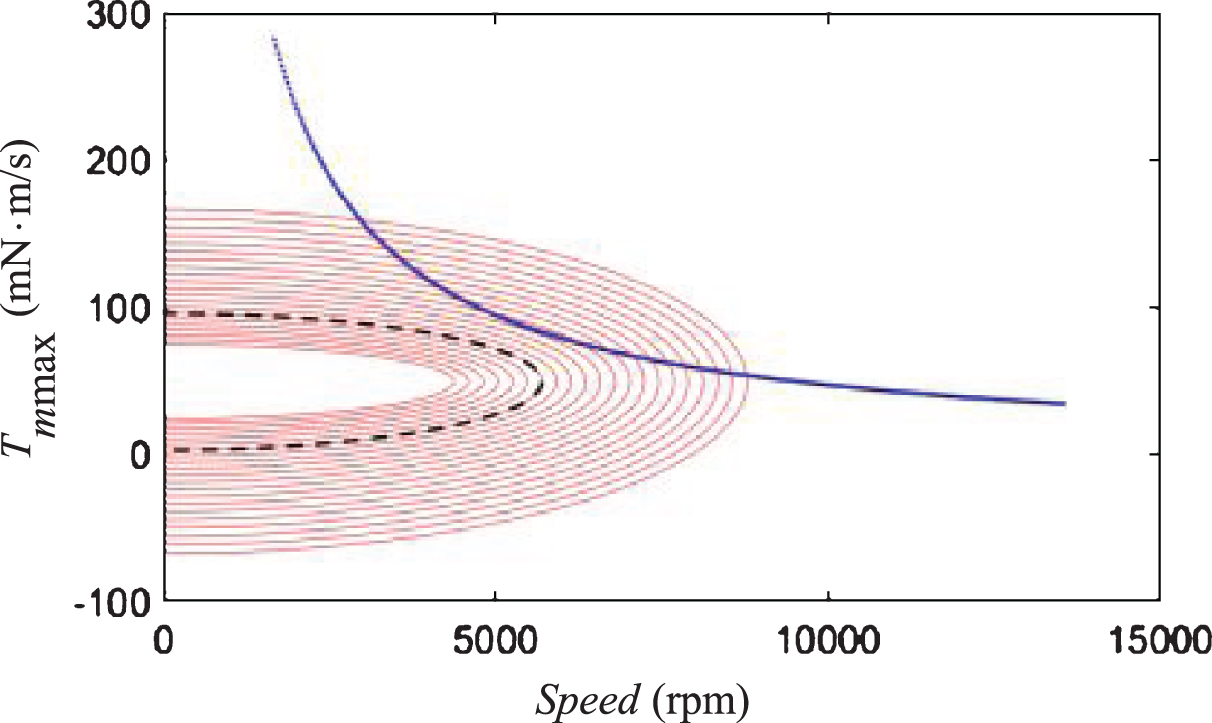
Load characteristic curves of both actuator and motor.
It can be seen from the above section that the maximum load moment Tmmaxof the electric actuator is a function of the deceleration ratio I when the cut-off angle frequency ω
c
is fixed. Its expression is as follows
Equation (20) can be obtained by deriving the deceleration ratio i
According to formula (21), when the deceleration ratio i is less than the deceleration ratio i0, the maximum load moment Tmmax monotonically decreases; when the deceleration ratio i is greater than the deceleration ratio i0, the maximum load moment Tmmax monotonically increases
Wheni = i0, the output torque of the actuator is the same. The torque provided by the BLDCM is the minimum, and i0 is the optimal deceleration ratio.
As shown in Fig. 7, when ω c is 20π, 26π and 36p respectively, the curve of the maximum load moment Tmmaxof the electric steering gear changing with the deceleration ratio i. Among them, the main parameters are rudder deflection angle δ = 1°; moment coefficient of the hinge of the electric actuator h = 0.75N · m/°; a moment of inertia J1 = 51.2g · cm2, J2 = 10 × 104g · cm2, J3 = 2.5g · cm2; efficiency η = 75%; the deceleration ratio I varies from 10 to 280. It can be seen from the figure that when the deceleration ratio is 210, the maximum load moment reaches the minimum value, which is called the optimal deceleration ratio. The design of the reducer is limited by many conditions, such as the size of space, standardized structural parameters, etc., so it is more suitable when the deceleration ratio is selected near the optimal deceleration ratio.
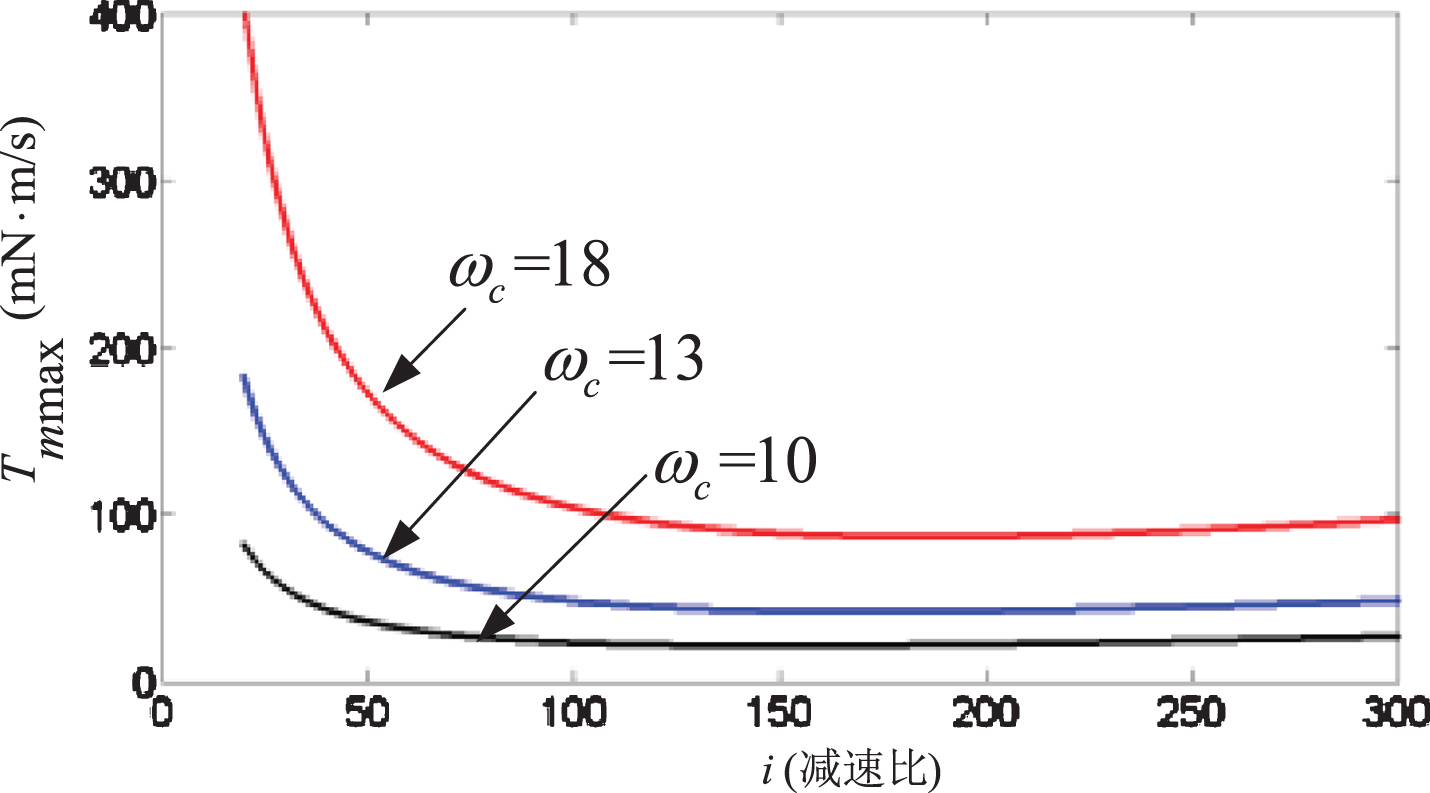
Tax vs. reduction ratio.
The curves of the maximum load moment Tmmax and deceleration ratio I of the electric actuator are drawn. According to the analysis and calculation, the deceleration ratio is 220.15, among which the first reduction ratio is about 2.34 and the second reduction ratio is about 94.4. As shown in Fig. 8, the elliptic curve cluster is the load characteristic curve of the electric actuator when the deceleration ratio I changes from 100 to 300. Among them, elliptic curve 2 is the load characteristic curve of the electric actuator when the deceleration ratio i = 220, and curve 1 is the speed torque curve of the constant power of the BLDCM. The two curves are separated. It is said that there is a power surplus and it can bear certain overload.

Load characteristic curves of both actuator and motor.
Reference also uses a similar method to calculate the harmonic toothed wheel electric actuator. Because reference takes nonlinear compensation as the research focus and focuses on many small factors, the calculation process is more complex; and only a group of cut-off frequency and reduction ratio of motor load characteristics are discussed, lack of contrast [13]. There are obvious differences between ball screw reducer and harmonic gear reducer. In this paper, the load characteristics of the ball screw electric actuator are deduced and calculated, and the parts that can be treated approximately in engineering practice are ignored, and the expected simulation results are obtained.
The static strength of the actuator structure is guaranteed by the static analysis. Due to the short flight time of the missile, the static analysis can also ensure the safety of the components under the dynamic load. The significance of dynamic simulation of the steering gear is to explore the influence of friction, clearance, impact, and elastic deformation on transmission accuracy. Using dynamic simulation software ADAMS to complete the above work [14–18].
Dynamic simulation and analysis of transmission mechanism
Figure 9 is a schematic diagram of the steering gear transmission system. In the process of modeling, the ball screw model is simplified as a screw drive pair, and the gear pair is regarded as an ideal model. The entity model for simulation is shown in Fig. 10. Input angle signal f (t) = 32.95sin (2πt) to the ball screw. Considering the following four different situations, the simulation analysis is carried out respectively. Considering the friction between moving pairs Considering the clearance and friction between fork and nut In the case of considering the middle clearance of the moving pair, the load torque satisfying the function relation f (t) = 1000sin (2πt) is applied at the output end of the actuator.

Schematic diagram of the transmission mechanism.

Model of the transmission mechanism in ADAMS.
Through the simulation of the actuator drive mechanism, we can see that: The existence of the clearance of the transmission mechanism will cause the speed discontinuity of the deflection angle of the fork, and the fork will vibrate, which will affect the stability of the actuator; The existence of friction makes the torque of lead screw fluctuate, which becomes one of the sources of load noise of motor [19]; When dead load and variable load are applied to the rudder shaft, the deflection angle speed and deflection angle of the fork do not change much, but the deflection angle curve of the fork under constant load is smoother than that under variable load; When the angle acceleration curve of the fork reaches the maximum value at the initial time under the dead load, it is very small compared with it at other times. When the variable load with the same frequency as the speed of the lead screw is applied, the angle acceleration curve of the fork is relatively stable in the whole calculation cycle, and the value difference is not big. The simulation results are of great significance to the optimization of the mechanical parameters in the design of the ball screw electric actuator [20].
Figures 11 and 12 show the angular velocity curve and angular acceleration curve of the yoke deflection respectively. There is no obvious difference between the angular velocity curve of the fork and that of the fork with only constant torque; in Fig. 30, the angular acceleration curve of the fork is larger than that of the fork with an only constant load.
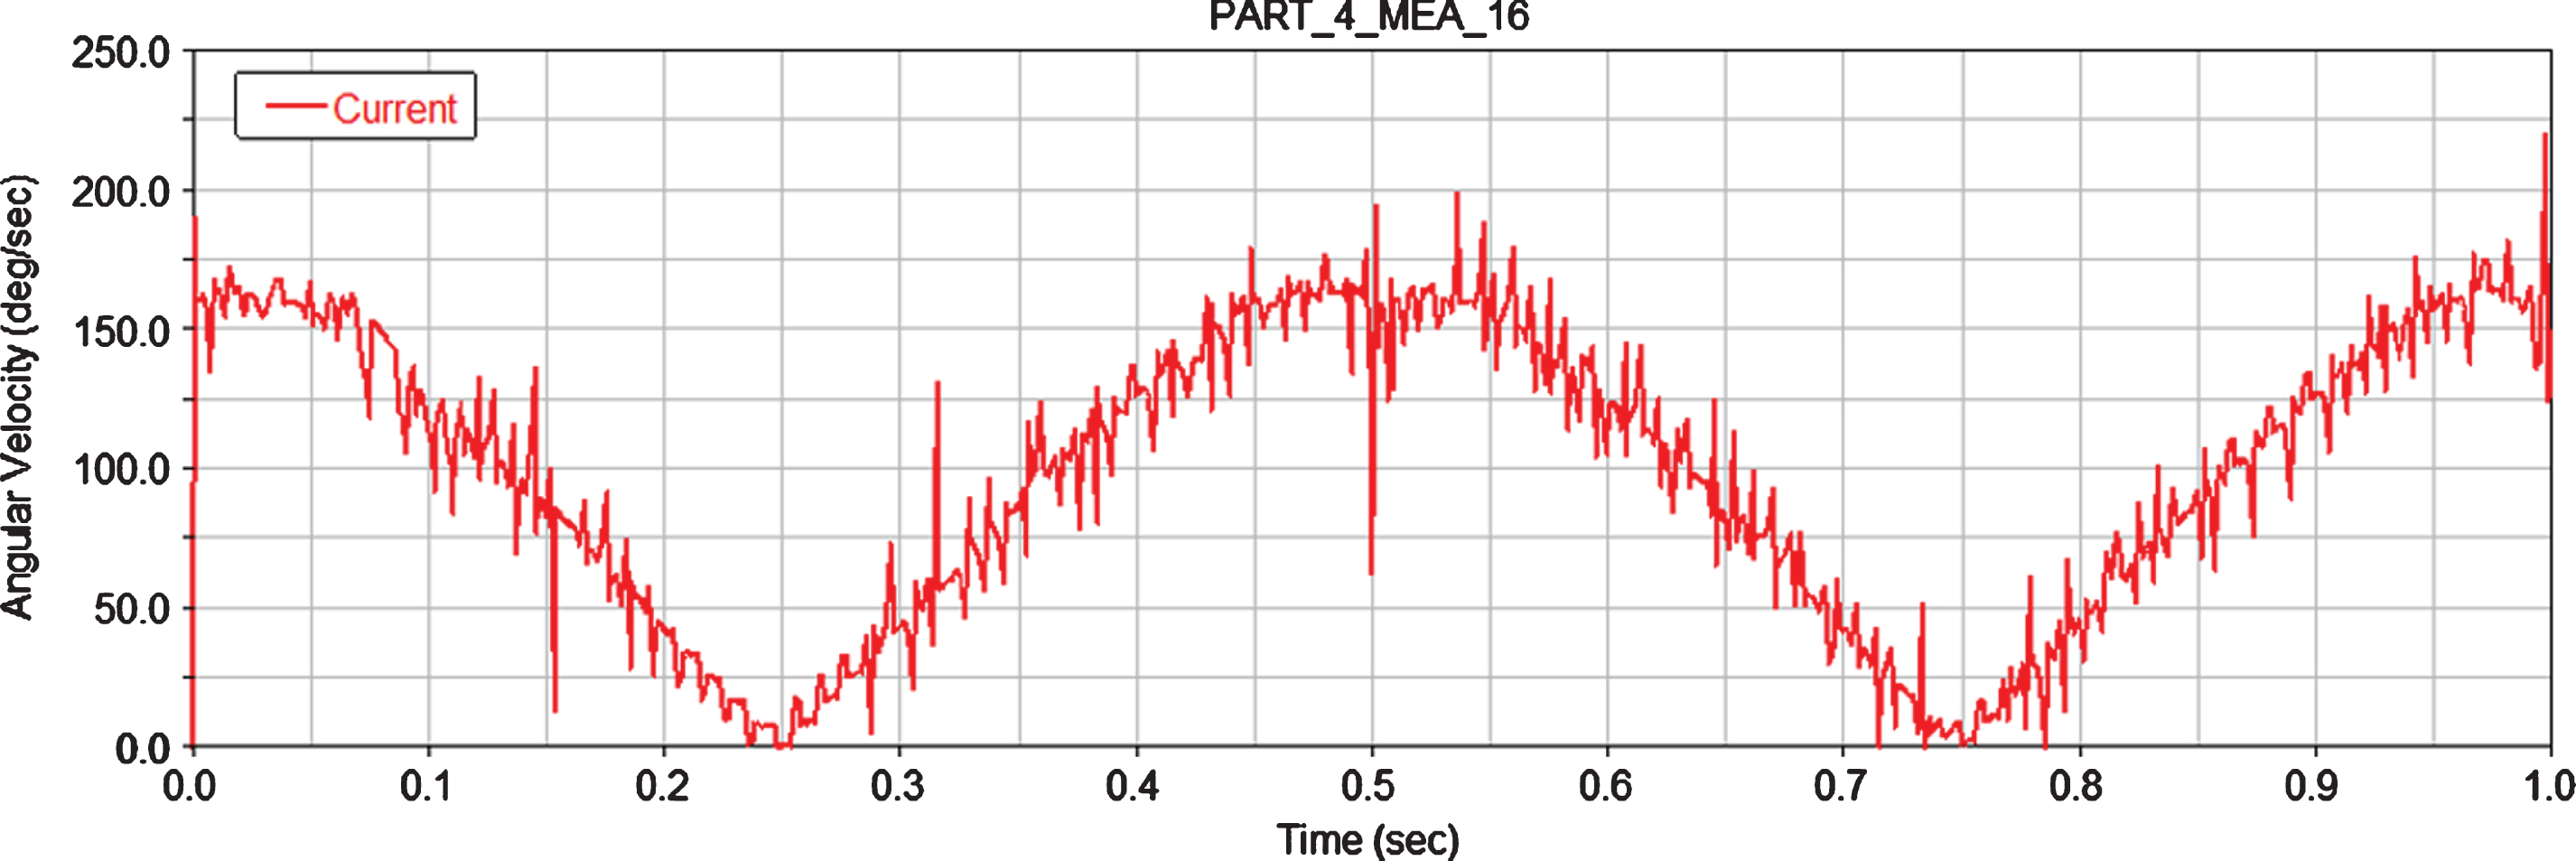
Angular rate of the fork.

Angular acceleration of the fork.
There is a gap between the ball and the raceway of the ball screw, which will cause collision between the balls and between the balls and the raceway. Also, the influence of lead screw torque fluctuation on the steady speed of the motor and control system is not discussed in this paper [21].
Conclusion
In this paper, the drive system optimization and dynamics simulation of high precision ball screw electric actuators are completed. According to the relationship between the load characteristics of the motor and the load characteristics of the actuator, the optimization method of the motor power is obtained, and the optimal transmission reduction ratio system of the design system is calculated according to the load moment equation, which provides a direct reference for the optimal design of the mechanical structure of the actuator. The actuator designed by the above optimization method has been tested and its performance meets the design requirements.
The dynamic characteristics of transmission between the ball screw and fork are simulated. It can be seen from the simulation results that the existence of the clearance of the transmission mechanism will lead to the discontinuity of the steering angle velocity of the rudder blade, make the system vibrate, and affect the stability of the system; the existence of friction makes the lead screw torque fluctuate, which becomes one of the sources of the loud noise of the motor. The simulation results show that the loud noise caused by clearance, friction, and regular hinge moment is quantitatively obtained. In the next step, we will combine the above load noise with the motor, controller, and control algorithm as a whole to carry out comprehensive analysis and research, to lay a foundation for the selection and optimization of the control algorithm.
Footnotes
Acknowledgments
Fund Project: Key R&D Program of Liuzhou City (2018BB3 0501) and Project of Hunan Science and Technology (2016RS4056).