
Abstract
Wearable robots must adjust the assist mode/intensity according to human motion during the motion assistance process. By decoding the surface electromyography (sEMG) signal, the standard deviation of the fractal dimension is used as a characteristic index of muscle contraction-relaxation ability, and explore the feasibility of using the standard deviation of the fractal dimension to estimate the human motor function and thus provide a basis for decision-making for the flexible control of wearable robots. First, the sEMG signals of several subjects with different motor functions were collected and their time-domain and frequency-domain features were extracted. The experimental results for one hour of walking showed that the time-domain and frequency-domain feature values increased with muscle fatigue. The trend has little to do with the inherent motor function of the human body; Second, due to the strong nonlinearity, time-varying, and strong complexity of the sEMG signal, the fractal dimension nonlinear method is used to characterize the complexity of the EMG signal that is closely related to muscle function. Besides, theoretical and experimental studies have been conducted to clarify the feasibility of the complexity of fractal dimension representation and to provide theoretical support for the further use of the standard deviation of fractal dimension to estimate human motor function. The experimental results of continuous walking for one hour show that, macroscopically, the fractal dimension of each muscle of the individual subject does not change significantly with walking time, which shows that the fractal dimension has nothing to do with exercise time and muscle fatigue; On the microscopic level, the value of the fractal dimension changes when the subject’s muscles contract and relax. Subjects with strong motor function have smaller fractal dimensions when their muscles contract than subjects with weaker motor function, and the opposite happens when their muscles relax, and it can be seen that there is a positive correlation between the difference in the fractal dimension during muscle contraction and relaxation and the muscle contraction-relaxation ability and the human body’s inherent motor function. The test results verify the feasibility of using the standard deviation of fractal dimension to estimate the intrinsic motor function of the human body.
Keywords
Introduction
As wearable devices such as exoskeleton robots and medical rehabilitation robots that are directly integrated with the human body, proactively understanding human movement functions and adjusting assist modes or strengths are vital to improving the human-machine interaction flexibility [1]. Human motor function refers to the functions and abilities to move organs in the state of movement in the whole of the human body and its various organ systems. It involves a wide range of aspects. People often use physiological indicators such as strength, speed, endurance, sensitivity, softness, and vital capacity for qualitative assessment. The determination of various physiological indicators depends on specific measuring instruments, and currently, there is no complete set of methods for assessing motor function.
Human bioelectrical signals are sums of potentials excited by neurons carrying human behavioral information when they are transmitted to relevant tissues/organs, and directly reflect human movement intentions and functions. Decoding human bioelectrical signals to obtain human motion information, and then giving robots the ability to understand human intentions and motor functions, has become one of the hot topics in human-computer interaction research. Bioelectrical signals that are currently widely concerned include electromyography (EMG), electroencephalography (EEG), and electrooculography (EOG). Because Surface EMG (sEMG) contains rich information, mature acquisition technology, and non-invasive acquisition, it has been favored by many researchers [2].
In the process of human-robot interaction based on sEMG, its core part is to decode human motion intention information through EMG signals, which usually involves three aspects: The first category is the recognition of human limb movements. This method classifies motion patterns by extracting feature parameters and machine learning algorithms to achieve the purpose of identifying human movements. It is widely used in the field of artificial limb control for disabled persons [3–5]; The second category is the evaluation and judgment of muscle fatigue and muscle strength. The amplitude of the sEMG signal is generally proportional to the strength of the muscle movement. Literature [6–8] used the time-frequency analysis of signals to estimate the periodic dynamic fatigue of muscles under increasing load. Reference [9] established a muscle strength prediction model using curve fitting, and considered the muscle strength under fatigue; The third category is the study of disease mechanisms and rehabilitation, such as the analysis of stroke, pain, and other diseases. Chen Wenmin and Song Hongmei discussed the relationship between physical pain and EMG signal characteristics [10, 11]. At present, EMG signal analysis methods mainly focus on time and frequency domain analysis. The time-domain characteristic indicators include integrated electromyographic (EMG), root mean square (RMS), and mean amplitude (MA); Frequency domain characteristic indicators include Mean Power Frequency (MPF) and Median Frequency (MFN), The above indicators are generally used to qualitatively describe the relationship between sEMG signal characteristics and muscle fatigue and muscle strength.
Since the sEMG signal is a nonlinear coupling in time and space of the bioelectric activity of a large number of moving units, its characteristics are very complicated. Therefore, nonlinear analysis methods have gradually gained attention. In [12], the nonlinear characteristics proposed by SampEn are used to distinguish spontaneous EMG signals from false domains and false background peaks. In [13], based on the chaos and non-linear characteristics of sEMG signals, an EMG signal characteristic pattern recognition method based on combined entropy and cluster analysis was proposed to classify the 4 actions of the hand. In [14], the correlation between the fractal dimension of the sEMG signal of the rectus femoris muscle and the height of the jump during the vertical jump was studied. Kai Wang [15] et al. Proposed a wavelet scale selection technique based on nonlinear correlation for estimating forearm extensor and flexor strength. There is no literature about the characteristics of EMG signals used to estimate human motion.
Therefore, it is urgent to use non-linear analysis methods and techniques to explore the correlation between the non-linear characteristics of sEMG signals and the state of motor function, and then dig up a method that can effectively estimate the function of the motor.
This paper uses the method of nonlinear analysis to explore the feasibility of using the standard deviation of the fractal dimension as a characteristic index of muscle contraction-relaxation ability and using this index for the estimation of human motor function. Experimental studies on several subjects have been performed to verify the effectiveness of the proposed method. First, the sEMG signals of the lower limb muscles of the subjects during walking were collected for pre-processing, and the time and frequency characteristics of the sEMG signals were analyzed with the change of exercise fatigue. The limitations of traditional time and frequency domain analysis methods on motor performance estimation were discussed; Third, the sEMG signal is analyzed non-linearly and the phase space reconstruction method is used to determine the chaotic characteristics of the sEMG signal, The nonlinear method of fractal dimension is used to characterize the complexity of sEMG signals closely related to muscle function. The characteristic index of the standard deviation of the fractal dimension is proposed to evaluate muscle contraction-relaxation ability during continuous exercise. Theoretical and experimental research is carried out to verify the effectiveness of this method.
The first chapter of this paper introduces the research background, purpose, and significance; the second chapter describes the sEMG signal acquisition and preprocessing methods; the third chapter studies the time and frequency domain characteristics of sEMG and its limitation on motion estimation; Chapter 4 studies the non-linear characteristics of EMG signals; Chapter 5 studies the feasibility of motion function estimation based on the standard deviation of fractal dimensions; Chapter 6 discusses and summarizes the full paper.
EMG signal acquisition and preprocessing
Laboratory equipment
The wearable EMG measuring device Due-Pro developed by the Italian company OT Bioeletronicas.n.c was used to collect myoelectric signals. Its appearance is shown in Fig. 1. The device has 8 wireless probes that can collect up to 14 EMG signals and 2 auxiliary signals (such as force and angle). The data is transmitted through Bluetooth communication, and the data is saved for later data processing by the MATLAB script program.

Due-Pro acquisition device.
A total of 15 healthy subjects with 20 to 25 years of age were recruited. Among them, 10 were males who were interested in sports and had exercise habits; 5 were females and had no exercise habits. Therefore, it can be assumed that there is a difference in motor function between male and female subjects. Male subjects have stronger motor functions and females have weaker functions. Set the subjects to walk on a treadmill with a running speed of 3 km/h, and collect the rectus femoris, lateral femur, medial femoris, semitendinosus, external gastrocnemius, internal gastrocnemius, and tibialis anterior muscle, biceps femoris EMG signal. The walking time is 60 minutes, and the signal is collected every 5 minutes, and the duration of each frame is 1 minute. The fixed sampling frequency of the device is 2048 Hz. The signal collection scene is shown in Fig. 2.

Signal acquisition scene.
Median filtering and band-pass filtering are used to pre-process the sEMG signal. The filtered sEMG signals of each muscle are shown in Fig. 3. In median filtering, the template length is set to 100, and the bandpass filtering parameters are 1 Hz at the left edge of the attenuation cutoff and 500 Hz at the right edge of the attenuation cutoff.

Filtered sEMG signal.
Time-domain feature
Extract the sEMG time-domain characteristic indicators EMG and RMS, and their calculation formulas are shown in Equations (1) and (2), respectively:
In the formula, EMG(t) is the electromyographic value of the signal at time t, xi is the electromyographic signal sampling value, and N is the length of the electromyographic signal.
Figures 4 and 5 show the normalized RMS and EMG of each muscle of a subject over walking time, respectively. The results showed that the time domain characteristics RMS and EMG of the eight muscles of the lower limbs all increased with walking time. This is because with the increase of exercise fatigue, to maintain the original exercise, more muscle fibers participate in the exercise, which makes the time domain characteristic value increase. It is worth mentioning that from the test results, the time-domain characteristics of all subjects can be observed to increase with exercise time, indicating that the time-domain characteristics RMS and EMG can effectively represent muscle fatigue, but cannot reflect the individual’s inherent motor function.

RMS characteristics of each muscle.

EMG characteristics of each muscle.
Extract the sEMG frequency-domain characteristic indicators MF and MPF, and their calculation formulas are shown in Equations (3) and (4), respectively:
In the formula, P(f) is the power spectral density of the myoelectric signal.
Figures 6 and 7 show the normalized MF and MPF of each muscle of a subject over walking time, respectively. The results show that the frequency domain characteristics of most muscles, MF and MPF, decrease with walking time, and the frequency domain characteristics of individual muscles increase. The difference may be related to external factors such as temperature and sweat. It is worth mentioning that the frequency-domain characteristics of all subjects have an increasing trend with exercise time, indicating that the frequency-domain characteristics MF and MPF can effectively represent muscle fatigue, but cannot reflect the individual intrinsic motor function.

MF characteristics of each muscle.

MPF characteristics of each muscle.
Fourier transform was performed on the sEMG with a 5-minute duration at the beginning and end of the walking exercise, respectively, to obtain the spectrum diagram shown in Fig. 8. In the figure, the red curve is the spectrum during fatigue, and the blue curve is the spectrum during non-fatigue. As the spectrum of fatigue shifts to the left, the frequency domain characteristics decrease, and the amplitude increases. The results also confirm the view that amplitude-frequency characteristics can be used to characterize muscle fatigue but not to characterize individual intrinsic motor function.

Spectral diagram of fatigue and non-fatigued states.
Chaotic features of sEMG
To explore the chaotic characteristics of sEMG, the coordinate delay method is used to reconstruct the phase space of sEMG signals, standard sinusoidal periodic signals, and random signals with a value of [-1, 1]. The method is to determine the d-dimensional phase space vector y(i) according to the different delay times τ of the time series signal {x (i) : i = 1, …, n}. The vector y(i) can be expressed as:
This paper takes the delay time τ= 16 and the embedding dimension d = 2.
Figures 9(a), (b), and (c) show the phase space reconstructions of the sEMG signal, random signal, and periodic signal, respectively. Different from periodic signals and random signals, the motion of sEMG signals is always limited to a limited area, the trajectory is never repeated and the shape is complicated, and the complexity of its motion is between periodic signals and random signals. This shows that the unstable factors in the sEMG signal drive the infinite extension of the state trajectory, the state trajectory is dense and traversed in the phase space, and the stability limits the state trajectory to a certain space, forming a certain hierarchical structure, with obvious elongation and folding Transformation characteristics. It shows that the sEMG signal has the typical characteristics of chaotic attractors. It can be seen that it is necessary to use a non-linear method to decode the sEMG signal and then excavate a characteristic index capable of characterizing human motor function.

Phase space reconstruction.
When the muscles contract, the motor unit discharges concentratedly, and the signal component is relatively single. When the muscles relax, the motor unit discharges randomly, and the signal components are more complex. It can be seen that the complexity of the sEMG signal is closely related to muscle contraction-relaxation ability. And because the muscle contraction-relaxation ability reflects the strength of the nervous system’s ability to control muscles, it can be considered that the muscle contraction-relaxation ability can be briefly described to reflect the body’s inherent motor function. This paper adopts a non-linear method of fractal dimension to characterize the complexity of the EMG signal and provides theoretical support for further exploring the feasibility of fractal dimension to characterize muscle contraction-relaxation ability.
The idea of “covering fractal dimension” is used to calculate the fractal dimension of the sEMG signal. Defined by the “covering fractal dimension”, use a box of size ɛ to take the covering fractal curve, and the minimum number of boxes required to complete the cover is N(ɛ). The calculation method of the fractal dimension D is shown in Equation (6).
To verify the feasibility of using the fractal dimension to characterize the complexity of the signal, and then to characterize the function of muscle retraction and human movement, hundreds of frames of coupling signals are formed by synthesizing different proportions of periodic signals and random signals, each of which has the same signal length. The fractal dimension of each coupled signal is obtained one by one by using the above method, and the result is shown in Fig. 10.
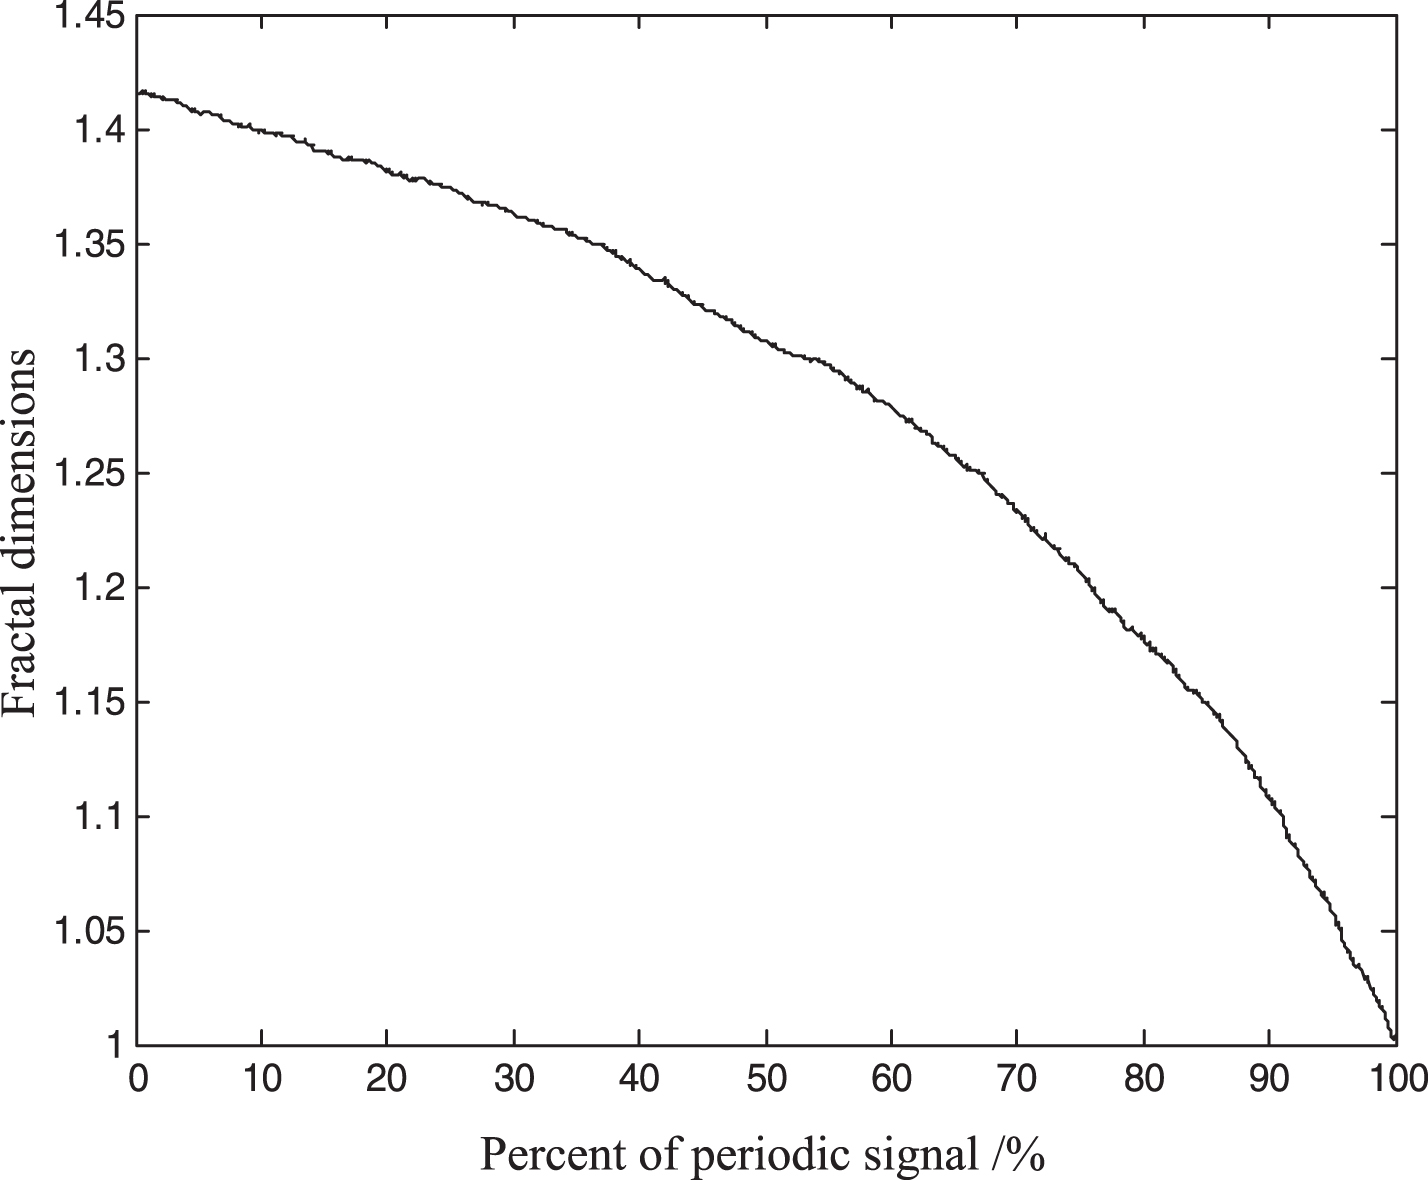
Fractal dimensions corresponding to different signals.
The horizontal axis of Fig. 10 represents the percentage of the periodic signal in each coupled signal, and the vertical axis represents the corresponding fractal dimension. The results show that the larger the proportion of the periodic signal in the coupled signal and the smaller the proportion of the random signal, the less complex components in the signal, the smaller the fractal dimension, and vice versa. When the proportion of the periodic signal approaches 100%, the value of the fractal dimension of the signal approaches 1. The results show that the fractal dimension can be used to characterize signal complexity, and provide a theoretical basis for further using fractal dimension to characterize muscle contraction-relaxation ability and human movement function.
The fractal dimensions corresponding to the EMG signal, periodic signal, and random signal are shown in Table 1. The results show that the periodic signal has the smallest fractal dimension and its value approaches 1. The signal component is single and the complexity is the smallest. The random signal has the largest fractal dimension and the signal complexity is the largest. The fractal dimension of the sEMG signal is between periodic and random signals. The results also verify the feasibility of using fractal dimension to characterize the signal complexity.
Fractal dimensions of sEMG, period, and random signals
Fractal dimension in continuous walking
The above method was used to calculate the fractal dimension of the sEMG signal of the eight muscles in the lower limbs during an hour of continuous walking. The change law of the fractal dimension of the sEMG signal of the eight muscles with exercise time was studied. To shorten the calculation time and ensure the reliability of the data, the sEMG signals of 5, 10, and 15 walking cycles were intercepted every 5 minutes to calculate the fractal dimension. Figure 10 shows the fractal dimension of the sEMG signal of each muscle during an hour of walking. The red lines, green lines, and blue lines represent the fractal dimensions corresponding to every 5, 10, and 15 walking cycles, respectively. Macroscopically, the fractal dimension of each muscle does not change significantly with the increase in exercise time. At the same time, the fractal dimensions of the five, ten, and fifteen walking cycles are the same, indicating that the fractal dimension of the EMG signal in the continuous walking movement changes gently, which shows that the fractal dimension reflects the individual’s inherent motor function. It is not related to exercise time and muscle fatigue.
Fractal dimension during muscle contraction and relaxation
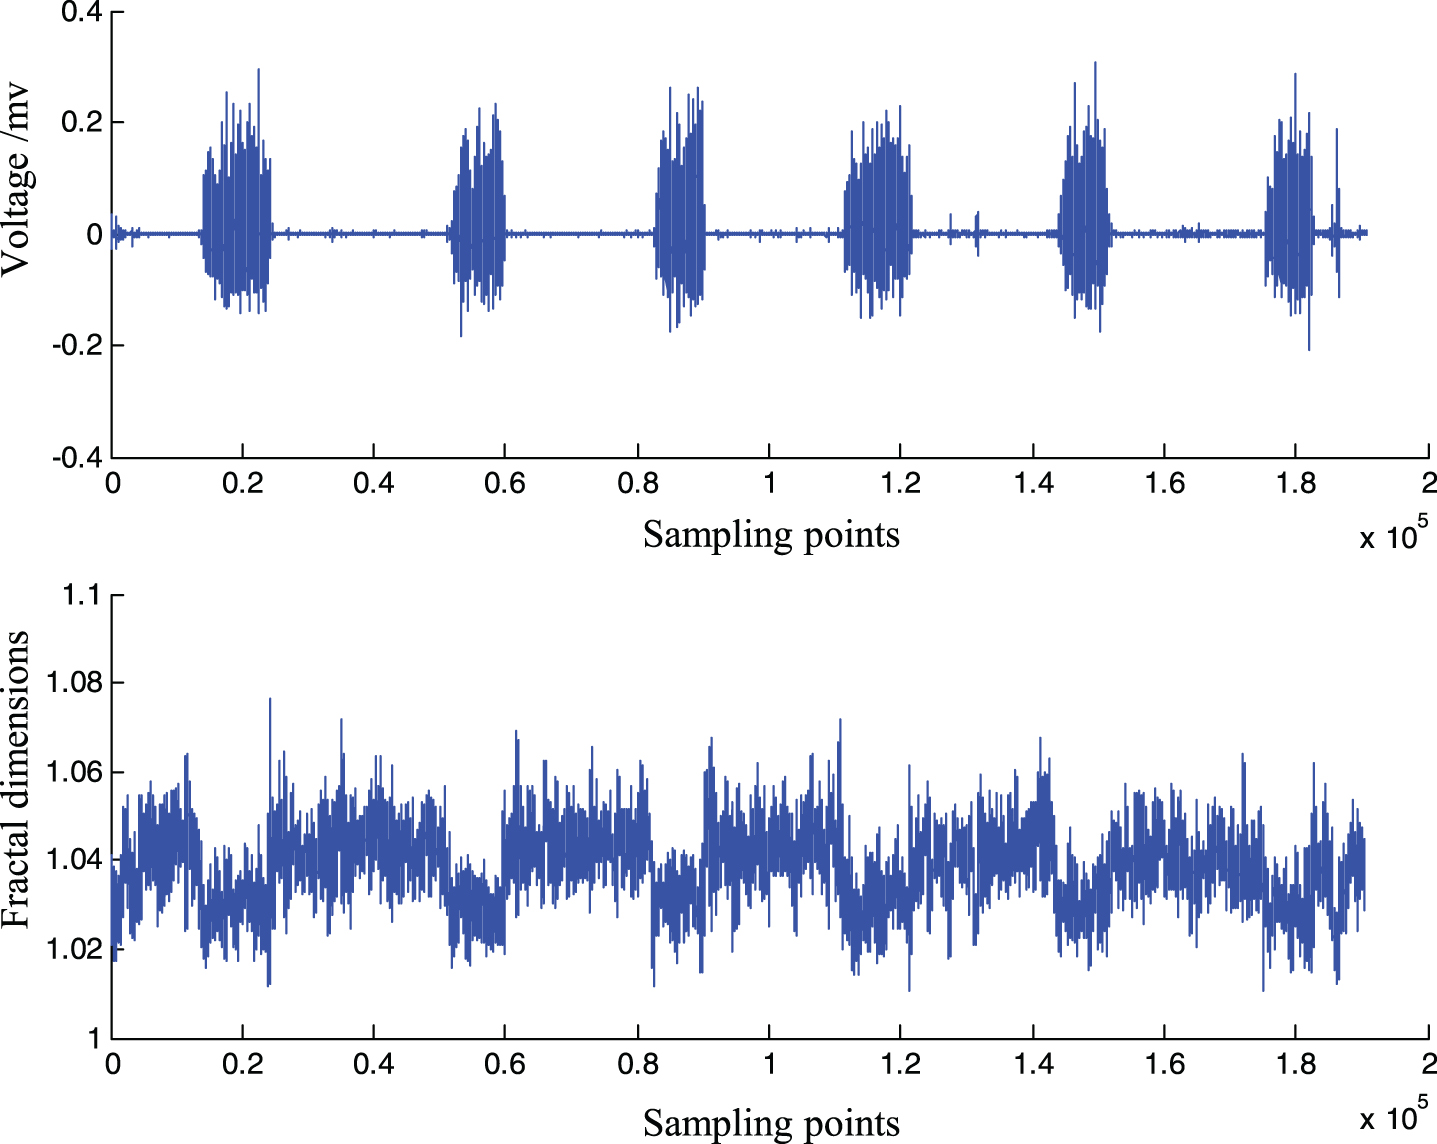
To explore the feasibility of the sEMG fractal dimension to characterize muscle contraction-relaxation ability, this paper calculates the fractal dimension of each subject when muscle contraction and relaxation. The original EMG signal and its fractal dimension of a subject are shown in Fig. 11. The results in Fig. 11 show that the fractal dimension of the sEMG signal becomes smaller and the complexity of the signal is lower when the muscle contracts and the fractal dimension becomes larger and the signal complexity is higher when the muscle is relaxed. This is because the muscle fibers discharge randomly when the muscles relax, and the muscle fibers discharge cooperatively when the muscles contract. In this paper, the fractal dimensions of sEMG signals during muscle contraction-relaxation in five subjects were further calculated. The results in Table 2 show that when all subjects contracted, the fractal dimension was smaller, and when the muscles were relaxed, the fractal dimension was larger. It is worth mentioning that male subjects who are assumed to have a strong motor function have a large difference in fractal dimension when the muscles contract and relax, while female subjects who are assumed to have a weak motor function have a small difference in fractal dimension. The results of this study indicate that the individual muscle contraction-relaxation ability is related to the difference in the corresponding fractal dimension during contraction-relaxation.
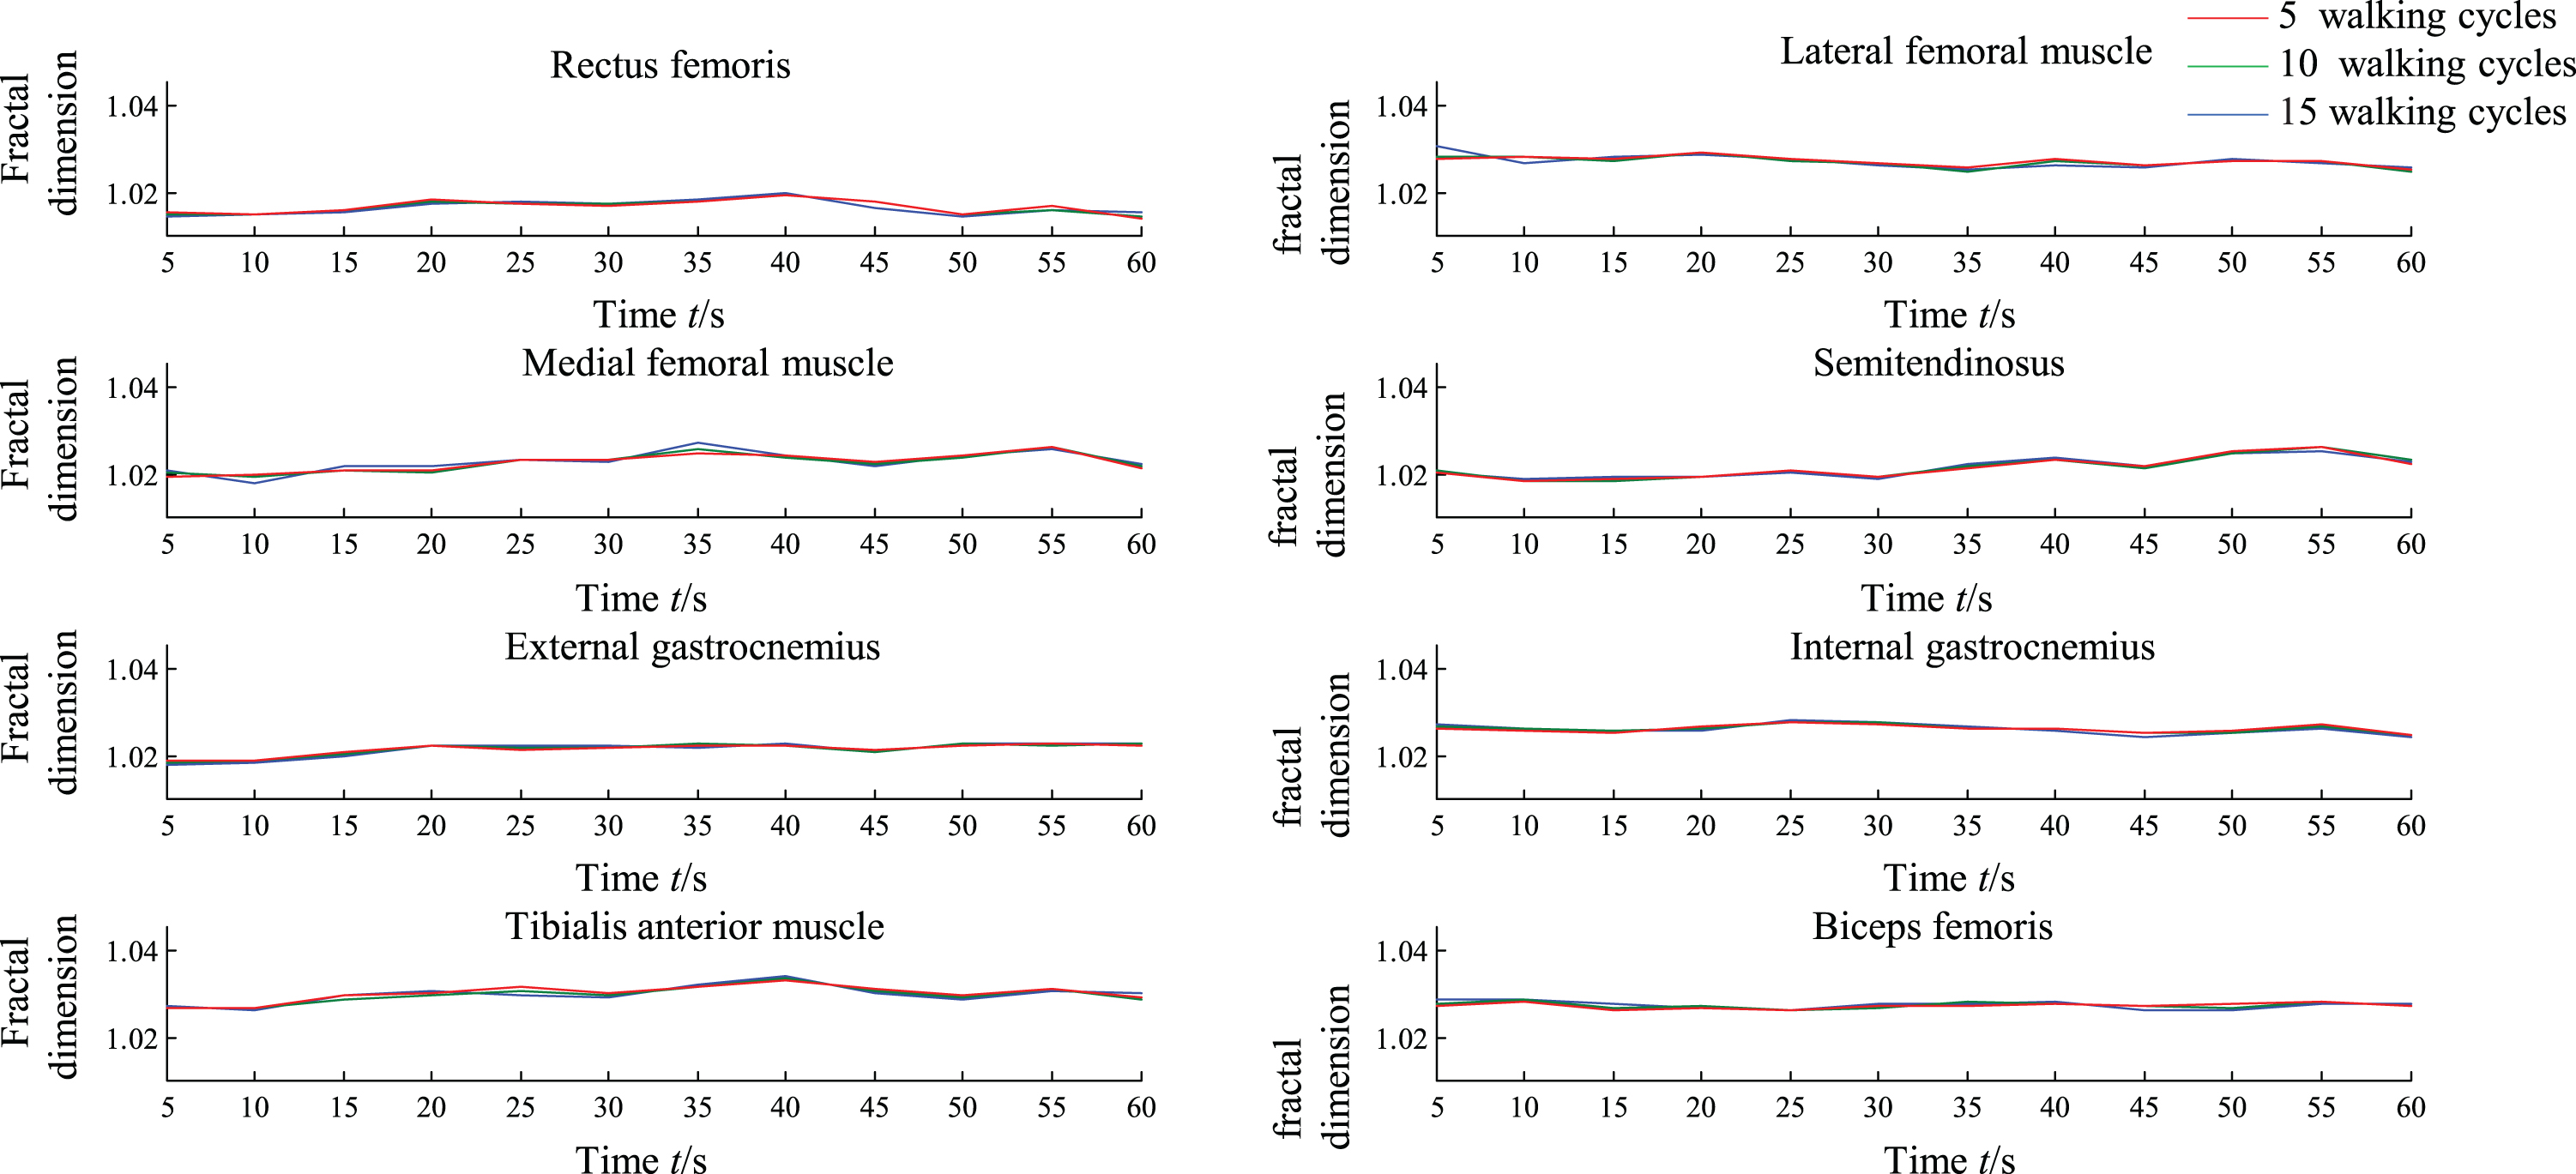
Variation of fractal dimension with exercise time.
Fractal dimensions of muscle contraction-relaxation in 5 subjects
It is implied that the stronger the human muscle’s contractility, the more concentrated the EMG signal component is because the muscle fiber discharge is more concentrated; when the muscle relaxes, the opposite is true; the stronger the muscle’s relaxation ability, the more complex the EMG signal component is.
The previous research results show that the individual muscle contraction-relaxation ability is positively correlated with the corresponding fractal dimension difference during contraction-relaxation. Therefore, it can be assumed that, for example, the greater the standard deviation of the fractal dimension of the sEMG signal during continuous exercise, the stronger the muscle contraction-relaxation ability, and the stronger the inherent motor function. To further verify the feasibility of using the standard deviation of fractal dimension to estimate the intrinsic motion of the human body, the standard deviation of the fractal dimension of the EMG signal in several walking cycles during continuous walking was further calculated.
A histogram of the standard deviation of the fractal dimension of 8 muscles of 15 subjects is shown in Fig. 13, where blue represents male, and red represents female. The results show that the standard deviation of the fractal dimension of the male is generally higher than that of the female. This result is in line with the selection criteria and assumptions of the subjects, that is, according to men who have long-term sports hobbies and women do not have long-term sports hobbies, it can be assumed that men’s motor performance is higher than women’s, and the standard deviation of the fractal dimension of men is greater than the women. The results verify the feasibility of using the standard deviation of fractal dimension to characterize muscle contraction-relaxation ability and then to characterize motor function. Besides, the standard deviation of the fractal dimension of the different muscles of the subject is different, indicating that there is also a difference in the strength of the muscle function of the subject, which is also consistent with the current human understanding of muscle function.
The EMG signals of the rectus femoris muscles and their fractal dimensions of two pairs of four subjects were further compared. The results are shown in Fig. 12. The left side of the figure shows data for two female subjects, and the right side shows data for two male subjects. The results showed that the muscle contraction of the male subjects was more concentrated, and the overall contraction and relaxation of the EMG signal was stronger. The standard deviations of fractal dimensions for male subjects 1 and 2 were 0.0107 and 0.0085, and the standard deviations of fractal dimensions for female subjects 1 and 2 were 0.0077 and 0.0051. The standard deviation of the fractal dimension of the male subjects is greater than that of the female subjects. This result confirms the feasibility of using the standard deviation of the fractal dimension to characterize the muscle contraction-relaxation ability.
Change in the fractal dimension of muscle contraction-relaxation.
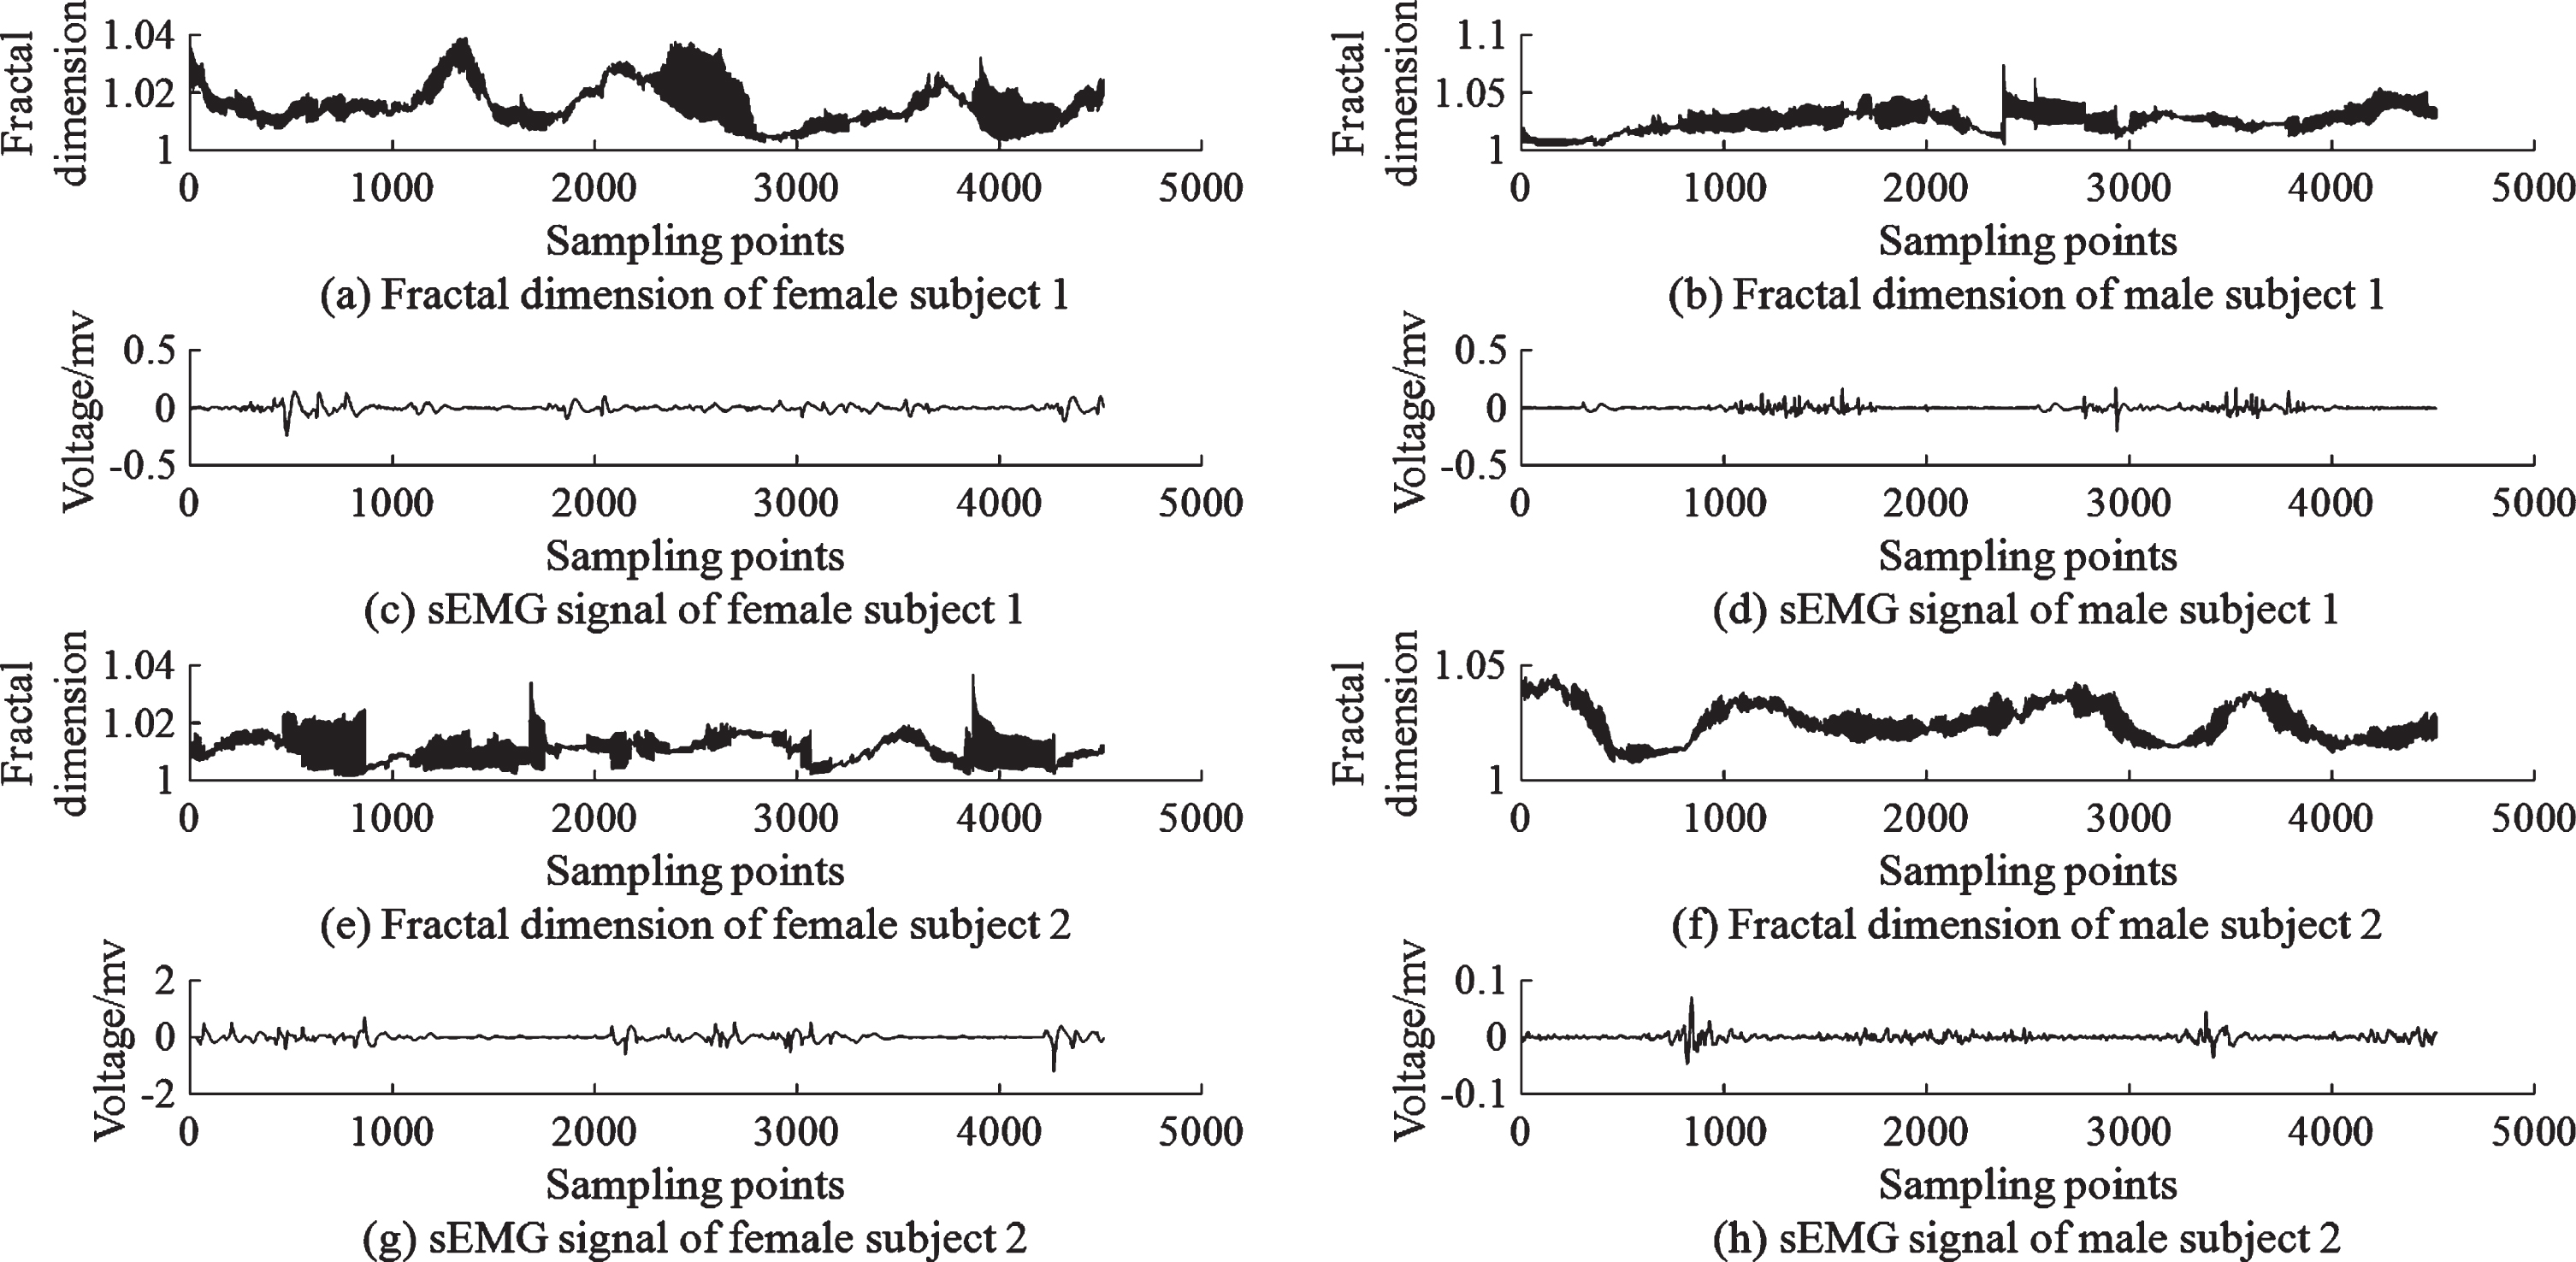
Comparison of walking exercise of different subjects.
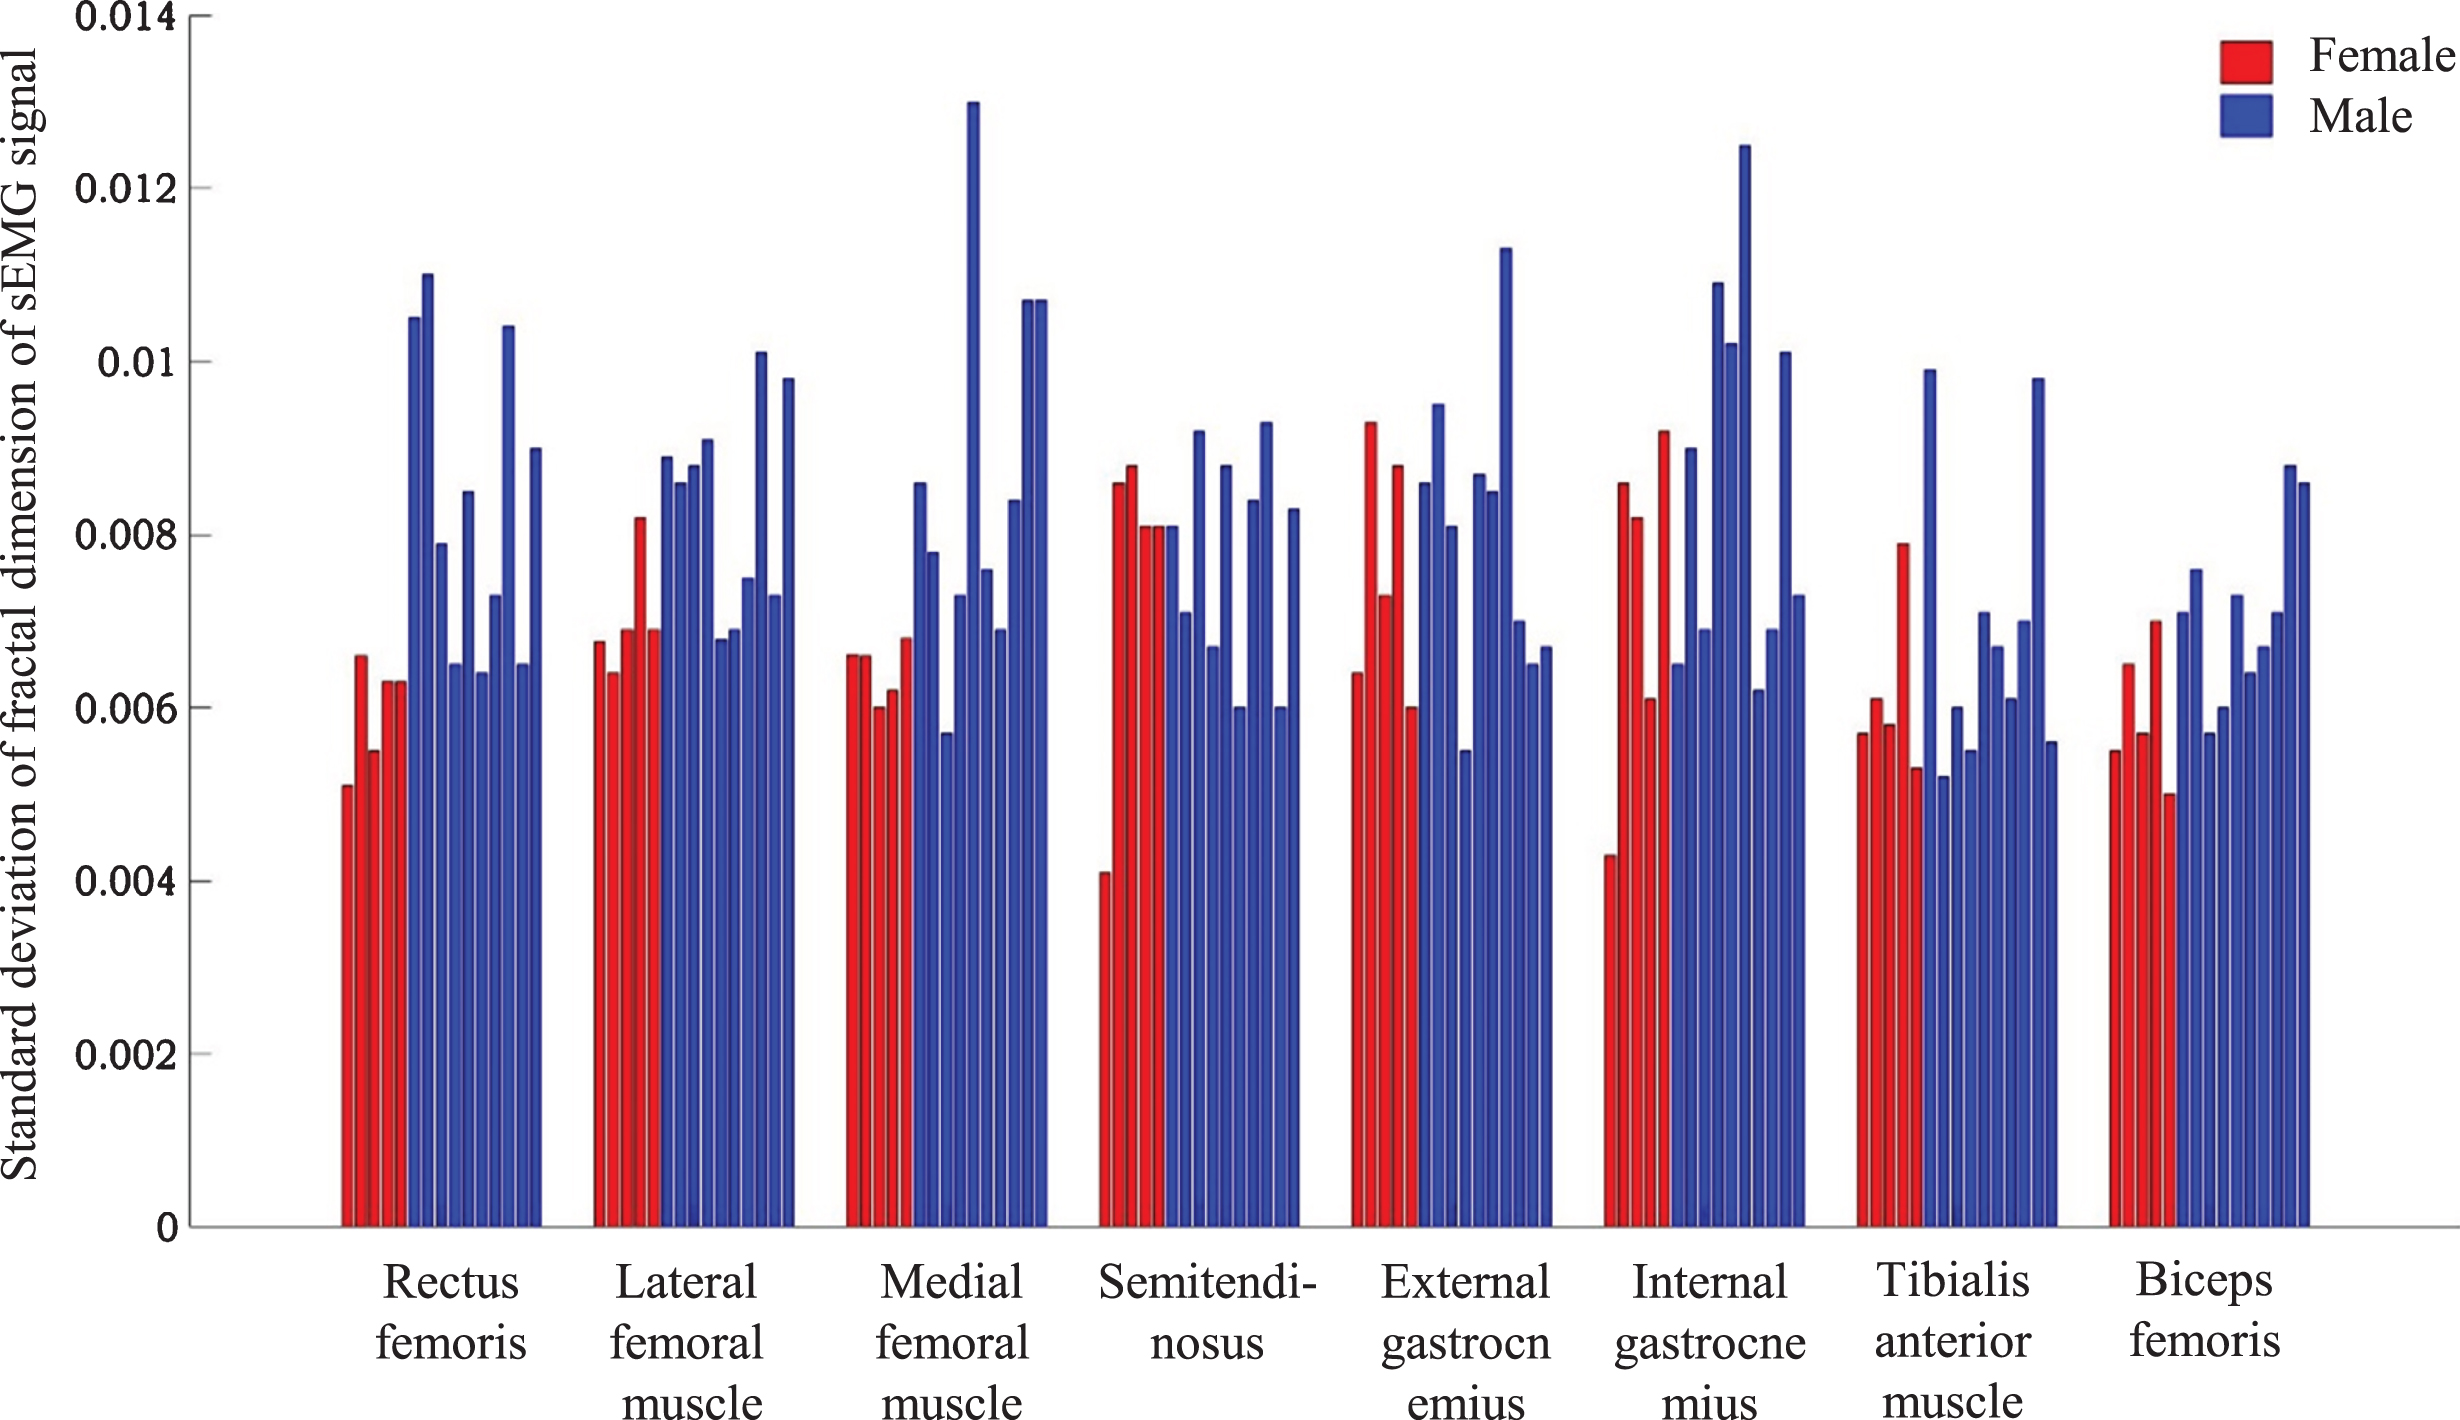
Standard deviation of the fractal dimension of each muscle of 15 subjects.
The wearable robot adjusts the assist mode/intensity according to the function of the human body during the motion assistance process, which is the key to achieving human-machine integration. By decoding the surface electromyography (sEMG) signal, the standard deviation of the fractal dimension is proposed as a characteristic index for evaluating muscle contraction-relaxation ability, and then it provides a decision basis for the wearable robot to reasonably estimate the human body’s motion function and perform flexible control. The experimental research of the testers verified the effectiveness of the proposed method.
First, the EMG signal was collected for one hour of continuous walking for preprocessing. The time and frequency characteristics of the sEMG signal were analyzed with the change of exercise fatigue. The general trend indicates that although traditional time-domain and frequency-domain analysis methods can effectively characterize muscle exercise fatigue, they have limitations in estimating motor function.
Secondly, due to the strong nonlinearity, time-varying, and strong complexity of sEMG signals, the fractal dimension non-linear method is used to characterize the complexity of sEMG signals that are closely related to muscle function. Theoretical and experimental studies have been conducted to verify the feasibility of using fractal dimension to represent the complexity and to provide theoretical support for further using fractal dimension standard deviation to estimate human motor function.
Furthermore, the fractal dimensions of the sEMG signal of the eight muscles of the lower limbs during one hour of continuous walking were calculated, and the variation of the fractal dimension of each muscle with exercise time was studied. The results show that, on a macro scale, the fractal dimension of each muscle does not change significantly with the increase in exercise time. It can be seen that the fractal dimension reflects the individual’s inherent motor function and has nothing to do with exercise time and muscle fatigue.
To explore the correlation between the sEMG fractal dimension and the muscle contraction-relaxation ability, the fractal dimension of each subject’s muscle contraction and relaxation was calculated. Since the muscle contraction-relaxation ability reflects the strength of the nervous system’s ability to control muscles, it can be considered that the muscle contraction-relaxation ability can be briefly described to reflect the body’s inherent motor function. The results show that microscopically, when the muscles contract, the fractal dimension is smaller, and when the muscles are relaxed, the fractal dimension is larger. The fractal dimension difference of the muscle contraction-relaxation of the male subject assumed to be strong in motor function is larger than the fractal dimension difference of the female subject assumed to be weak in motor function. The results of this study indicate that the individual muscle contraction-relaxation ability is related to the difference in the corresponding fractal dimension during contraction-relaxation.
To further verify the feasibility of using the standard deviation of the fractal dimension to estimate the intrinsic motor function of the human body, the standard deviation of the fractal dimension of the EMG signal in several walking cycles during continuous walking was calculated. The histogram of the standard deviation of the fractal dimension of 8 muscles in 15 subjects showed that the standard deviation of the fractal dimension of men was generally higher than that of women. This result is in line with the selection criteria and assumptions of the subjects, that is, according to men who have long-term sports hobbies and women do not have long-term sports hobbies, it can be assumed that men’s motor performance is higher than women’s, and the standard deviation of the fractal dimension of men is greater than the women. The results verify the feasibility of using the standard deviation of fractal dimension to characterize muscle contraction-relaxation ability and then to characterize motor function.
Footnotes
Acknowledgments
This work was supported by the National Natural Science Foundation of China (51505048), Natural Science Foundation Project of CQ CSTC (cstc2019jcyj-msxmX0292), and a Science and Technology project of the Chongqing Municipal Education Commission (KJZD-K201900702).