
Abstract
This article first studies and designs the college English test framework and performance analysis system. The author analyzes a large number of data collected by the system in three dimensions: using data mining title association models, using machine learning to merge college English score prediction models, and finally diagnosing on the basis of the sexual evaluation model, the author designed and implemented a test paper algorithm based on the association rules of the question type, and carried out relevant verification from the three aspects of test paper time, test question recommendation and improvement according to scores. Finally, according to the needs analysis, the author uses the diagnostic evaluation model and related test paper algorithm to design and implement the diagnostic evaluation model, which is added to the college English diagnostic practice system. It can be obtained through comparative experiments that the paper-based algorithm based on the diagnostic evaluation model proposed in this paper can effectively give better practice guidance and test question recommendation to the learner’s learning status and knowledge point problem obstacles, and can effectively improve learning. The achievements of the authors have broad application prospects and research value.
Introduction
With the development of computer multimedia technology, media such as words, images and sounds provide learners with unprecedented conditions for online learning. Coupled with the assistance of big data and artificial intelligence technology, online learning has become an important learning method. It is also a field of attraction for many domestic and foreign universities and enterprises to study [1]. In the learning process, because there are differences in learner’s ability level and learning progress, as well as obstacles to learning and understanding, personalized diagnosis and evaluation of the learning process is an effective method to enhance learning ability and improve learning level [2]. The assessment of the learner’s ability level before or during learning is called a diagnostic evaluation [3]. In traditional classroom teaching, teachers often evaluate students based on test results and the specific performance of students inside and outside the classroom, as well as teachers’ own teaching experience. Students can improve their learning process and correct deviations in learning with the help of teachers [4]. In an online learning system, learners need to set learning goals, choose learning strategies, and adjust their learning pace while learning. Fundamentally, this model of autonomous learning requires more effective evaluation and accurate feedback.
With the rapid development of specific technologies in the computer field in recent years, a large number of online learning platforms have emerged on the Internet. These platforms have broken through the limitations of paper materials, so that online learning and practice have become more flexible and free in time and space. In addition, these platforms also collect and record the learning situation of many learners through the database, which provides data for learners to carry out staged diagnosis and evaluation. But after trying these practice systems, it is not difficult to find that the use of these practice systems can still do the traditional mode of making questions and viewing solutions [5]. The feedback information provided to learners can only stay at a certain social wish, test solution and translation analysis. Such feedback information lacks pertinence and directivity, neither can it reflect the advantages of big data in the era of artificial intelligence, nor can it provide learners with objective diagnostic evaluation and effective learning suggestions, which will inevitably cause certain deviations in learning effects. The author found on the ground that someone using a college English diagnostic practice system found that nearly 90% of college students believe that the current system’s practice mode is monotonous, and they just repeat the process of doing practice questions and viewing test question solutions [6]. The students of this school expect that the system will provide detailed post-assessment, accurate study guidance and accurate test questions after online practice to help them improve their scores and pass the exam quickly and effectively.
The online learning platform should make use of the large amount of data collected in actual use for analysis and explore the unknown information within the data to achieve the defects of system analysis and the lack of personal experience [7]. Data mining and machine learning are currently popular research areas, which can help explore new knowledge and predict future events. As the core content of the discovery of unknown information in the database, it mainly analyzes the data from multiple angles, statistics and reasoning to explore the answers to actual questions, discover the internal connections between events, and use the data to conduct future events, forecasting etc. [8].
Therefore, in view of the problem of the lack of diagnosis and evaluation in the online learning platform, the author believes that the current popular data mining and machine learning technology should be used to process and study the real data collected in the system, and then the university English diagnostic evaluation model is designed accordingly. And according to the diagnostic evaluation model, a personalized and targeted test question recommendation algorithm is proposed, so as to meet the individual needs of the majority of learners and quickly and effectively improve the ability of learners.
The main work and research contents of this article are as follows: First, the establishment of diagnostic evaluation model. Through a large amount of data collected in actual use, these data are analyzed in three dimensions: learner learning status assessment, question type association analysis, college English score prediction, and the above three models are added to the current knowledge points of the system. The model ultimately constitutes a relatively complete and highly reliable diagnostic evaluation model. Second, the design and implementation of two test paper algorithm based on diagnostic evaluation model. After researching and analyzing the existing test question recommendation algorithm of the system, a diagnostic evaluation model was released. Based on the question type association rules, a test paper generation algorithm based on question type association rules was proposed. The design ideas and steps of this algorithm were introduced and designed a comparative experiment for related verification and analysis.
Materials and methods
Data mining and association analysis
In recent years, the majority of scientific researchers have paid more and more attention to the field of data mining, and are eager to convert a large amount of disordered data into useful knowledge and information. Here, data mining will also be used to analyze the association rules of question types. Mining is the process of combining data analysis and processing to find some unknown information in an ordered data set [9].
There are six types of data mining tasks: association analysis, cluster analysis, classification, prediction, time series mode, and deviation analysis. We will use association analysis technology to study the relevance of the question type. The process of discovering unknown internal rules in a large data set is called association analysis. By viewing the sales data of goods stored in the background of the supermarket, association analysis is used to mine items that customers often buy together [10]. In this way, the supermarket can increase the probability of selling different types of goods at the same time by changing the place where the goods are placed. Various spatial data mining challenges and its applications are reviewed on spatial data mining [11]. Deep neural network is utilised for finding flood disaster on basis of IoT and big data [12]. A novel scheme for smart grid amongst internal adversaries for efficient and privacy preserving of data [13]. Social system is utilised for service composition in field of cyber physics [14]. Data mining risk assessment is carried based on the IoT information platform [15].
In association analysis, the two standards of support and confidence are usually used to evaluate the rules. The support is the frequency of the data set. The definition formula of support is as follows:
The confidence level is the probability that b appears in the set containing a. It can also be said that the confidence level is a regular conditional probability. The definition formula of Confidence is as follows:
Setting the minimum support degree is a rule to eliminate the substitution of accuracy rate, because if the support degree of a certain rule is very low, then the accidental interference of this rule cannot explain the actual meaning. We usually don’t care about the rules with low accuracy, so we need to set the minimum support to exclude these rules.
At the same time, in order to better improve the accuracy of association rules, the author improves the dating to judge the effectiveness of association rules. The degree of lift represents the ratio of the probability that includes both a and b, and the probability that there is b without a, and the definition formula is as follows:
When the promotion degree is 1, it means that a and b are independent and irrelevant, so only when the promotion degree is 1, the mining association rules are valid rules. Therefore, in the specific excavation work, the association rules with lifting degree less than or equal to 1 should be removed.
The key step of the Apriori algorithm is to use recursive technology to convert the interchange item set in two stages. It is a very influential algorithm to replace the rule set.
The basic idea of the algorithm is: It is found that all the sets with excessive degree not less than the minimum support degree. Generate association rules that satisfy minimum placement reliability and minimum support at the same time. Generate all the rules that have a back item and only contain the items in the set. Remove the minimum and minimum confidence rules.
The algorithm uses recursive methods to generate sets.
The current college English test system has six practice algorithms: real test exercises, random test questions, test questions, test questions, knowledge points, test points, and knowledge points. Among these six algorithms, except for following the maximization of knowledge points and associating rules based on knowledge points, they are relatively simple algorithms for generating test papers, and usually require learners to set parameters themselves for test paper preparation [16]. It provides the function of grouping test papers by question type. The group test function requires the user to select the type and number of question types to practice the test paper. However, not all users are aware of their own question-type mastery, so the group test mode does not guide users to learn well. As one of the characteristics of the system, knowledge points should be combined with knowledge points and question types, in order to improve the user’s learning effect and quickly improve the score. Therefore, based on the association rules of the question type and the knowledge point system, a test paper generation algorithm based on the association rules of the topic model is proposed. The flow chart of the algorithm based on topic model association rules is shown in Fig. 1.
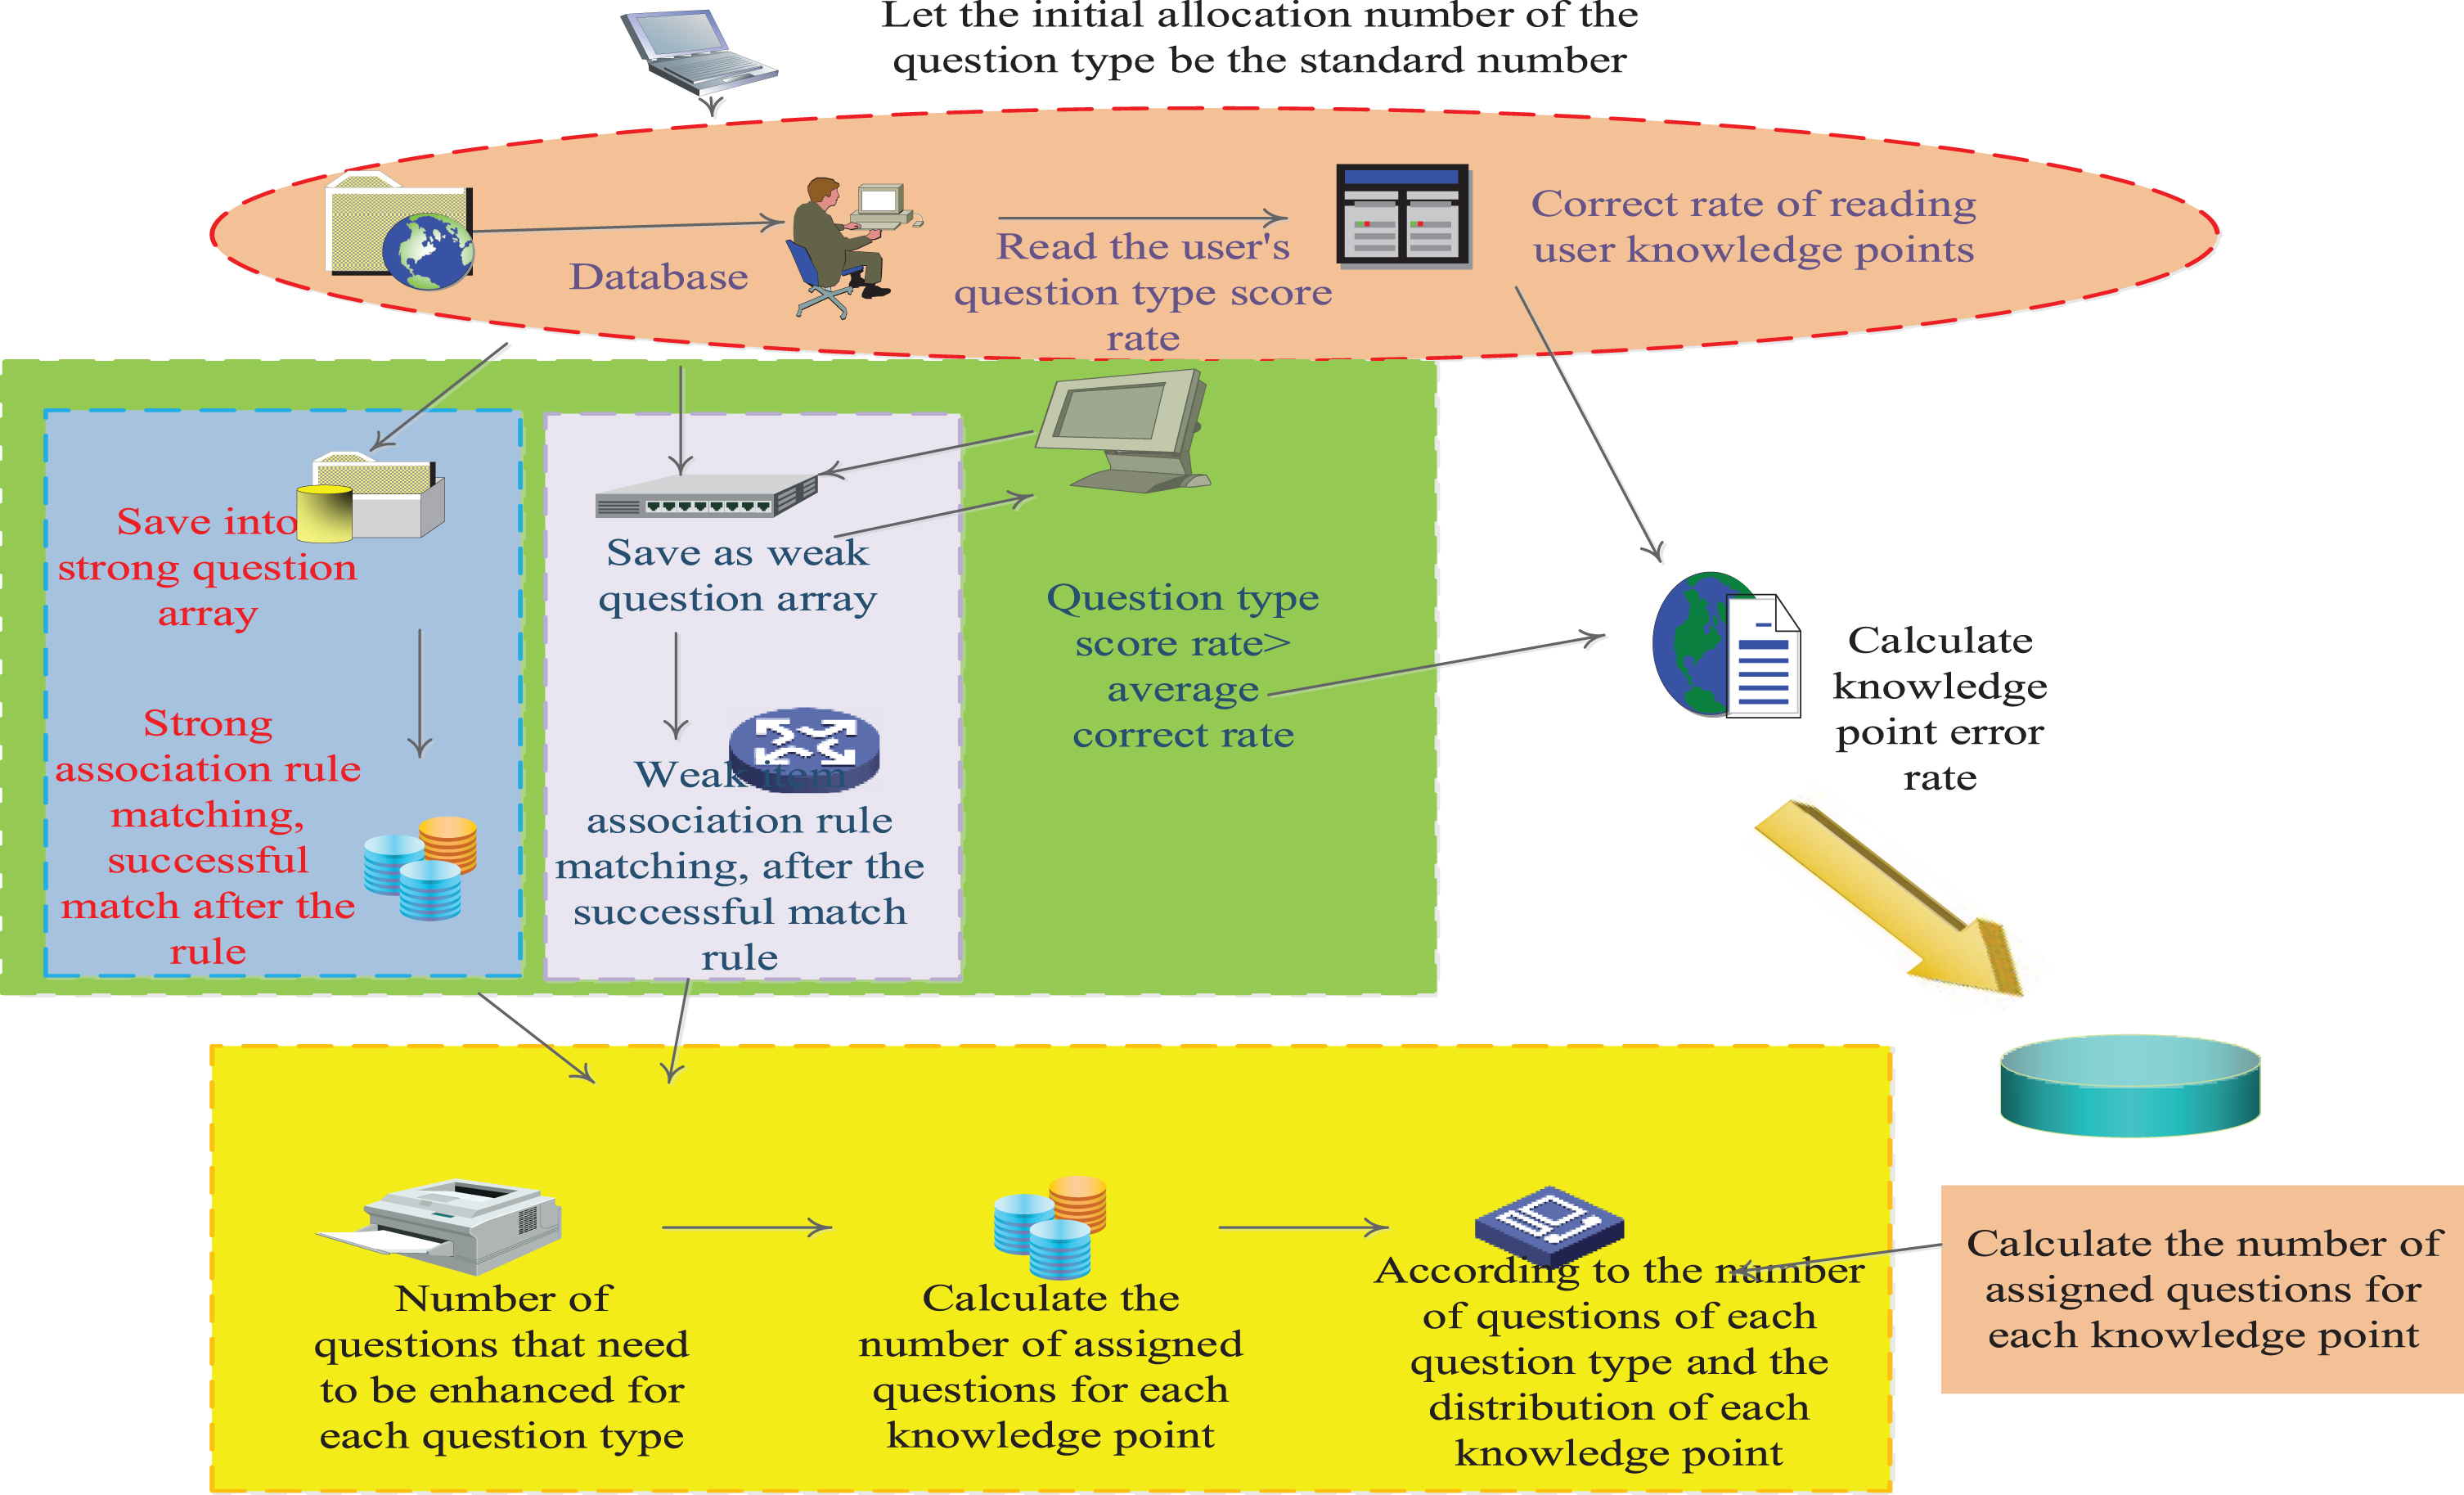
Flowchart of the algorithm for generating test papers based on the association rules.
The test paper-based algorithm based on the association rules of the question type has the following goals: Determine the number of questions for each question type according to the level of reproduction rate of each question type. The potential strong question types are expected from the question types with high popularity rate, and the number of test questions is reduced. Question types with low rates predict potential weak item types and increase the number of test questions. Determine the number of test questions for each knowledge point according to the accumulation rate of each knowledge point, allocate replacement test questions for knowledge points with high prominence rate, and assign test questions for knowledge points with low rate.
According to the goal of the paper-grouping algorithm of the basic topic type association rules, the design idea of the algorithm is briefly described below [17]: the flow chart of the algorithm for increasing the number of topics for each topic type is shown in Fig. 2.
Flow chart for increasing the number of questions for each question type.
According to the aggregation rate of each question type of the user, set the strong item type Siwith a prevalence rate greater than or equal to the average distribution rate of the question type, and set the weak item type Wi with an occurrence rate less than the average prominence rate of the question type. The strong item type Siand the weak item type Wiwere used to count the number of occurrences of the potential strong item typePSi and the potential weak item typePWi using the item type association rule table. Set the initial allocation number of each question type to the standard number of fourth-level test questions, and the total number of questions N is 60. Each question type needs to increase the number of test questions Ai is PWi-PSi, Ai < 0 does not increase the question. Therefore, the total number of questions N is According to the error rate Wi of each knowledge point of the user, calculate the number of assigned questions for each knowledge point.
Prediction model verification
This article mainly uses two evaluation criteria, root mean square error (RMSE) and root mean square log error (RMSLE). If the difference between the maximum and minimum values in the data set is large, the RMSE will be dominated by some larger values. This will cause even if many values are predicted accurately, but because some larger value are not accurate, the RMSE will become very big. Correspondingly, if the prediction of some smaller values is biased, the RMSE may be smaller than before [18]. RMSLE can solve this problem by first taking the logarithm of the true value and the predicted value and then solving the RMSE.
The calculation formulas of RMSE and RMSLE are as follows:
Obs i is the predicted value, and Model i is the true value.
After the program runs, the comparison between the predicted value obtained by using the prediction model and its actual value in the validation set is shown in Fig. 3. RMSE and RMSLE are based on the question type association rule algorithm.

Comparison between the pre-side value and the actual value.
In Fig. 3, the abscissa is the number of users, and the ordinate is the user’s English test score. As can be seen from Fig. 3, except for individual outliers, most of the predicted values are not much different from the true values, which are within a reasonable range.
In order to evaluate whether the test question recommendation based on the diagnostic evaluation can effectively target the user’s actual learning situation, and whether the test algorithm can effectively improve the user’s performance, the author designed an experiment to evaluate the algorithm in the test paper time, test question recommendation and achievements in three aspects [19].
The author chose two sophomore classes under the guidance of the same teacher in colleges and universities using this system to conduct comparative experiments, which are the experimental class and the control class [20]. The initial grades of the students in these two classes are comparable and they will take the exam. Among them, the control class learns according to the normal teaching arrangement, and the experimental class will use the two methods to complete 6 sets of test questions in addition to the normal teaching arrangement.
The distribution chart of the number of students in the first grade English test scores of these two classes is shown in Fig. 4. In Fig. 4, the abscissa is the student’s score interval, and the ordinate is the number of students in each interval. The data for the experimental class is a blue bar, and the data for the control class is a red bar. It can be seen from Fig. 4 that the distribution of English scores of the two classmates in each score interval is not much different, and the number of people in each score interval is within 5 people. This shows that the English proficiency levels of the two classmates are very close, and experiments can be conducted.
Distribution map of real face class and control class.
The processes of the two-test paper forming algorithms based on diagnostic evaluation are relatively complicated, so the test paper time must be tested. The author ran 10 times each of the two test algorithms in the local test environment and the server production environment, and recorded the running time of each time. Finally, all the test paper times
were averaged. The time situation is shown in Table 1.
Based on two evaluation algorithms for diagnostic evaluation
Based on two evaluation algorithms for diagnostic evaluation
According to the principle in the performance test, when the client receives a response within 2 seconds, the user will feel that the web page is opened quickly; when the client receives a response within 2–5 seconds, the user will feel the speed of opening the webpage is okay, and it is quite satisfactory; when the client gets a response within 5–10 seconds, the user will feel that the speed of opening the webpage is slow; when the client gets a response after 10 seconds, the user will feel the speed of the webpage, users will leave the page.
As can be seen from Table 1, in the local test environment, because there is no bandwidth limitation, the response speed of the two test algorithms is less than 2 seconds, which fully meets user needs; in the server production environment, because of bandwidth limitations and server configuration, etc. The reason is that the composition time of the two composition algorithms is also slightly longer than 2 seconds, and does not exceed 3 seconds, which is also in line with user needs.
At the same time, the author designed a questionnaire on the composition time of the two paper composition algorithms, and conducted a questionnaire survey on the students in the experimental class to understand how satisfied the students are with the speed of paper composition in the actual use process. The specific situation is shown in Fig. 5.

Score satisfaction score.
The score in Fig. 5 refers to the user’s satisfaction with the speed of the two test paper composition algorithms, where each score is defined as: 1 is extremely poor, 2 is poor, 3 is average, 4 divided into satisfaction, 5 points are very satisfied [21]. It can be seen from Fig. 5 that all students’ satisfaction scores on the composition time of the two composition algorithms are more than 3 points, and there is no evaluation of 1 or 2 points. The average composition time of the two composition algorithms is also more than 3.7 points, which proves to a certain extent that the speed of the two test paper algorithms is more in line with user needs.
Test question recommendation verification is to verify whether the recommended test questions based on the diagnostic evaluation test algorithm meet the user’s learning needs. The verification of test questions will be verified in terms of the quality of test questions and the number of test questions [22]. The quality of test questions mainly checks whether the algorithm of the test questions is in line with the user’s knowledge points and the number of test questions.
After one semester of use, the students in the experimental class are already very familiar with the test paper function based on the learner’s learning state and the test paper function based on the question type association rules, so they are asked to test the quality and test questions of the two test paper algorithms [23]. The number is used for satisfaction evaluation, and the evaluation data is shown in Fig. 6.
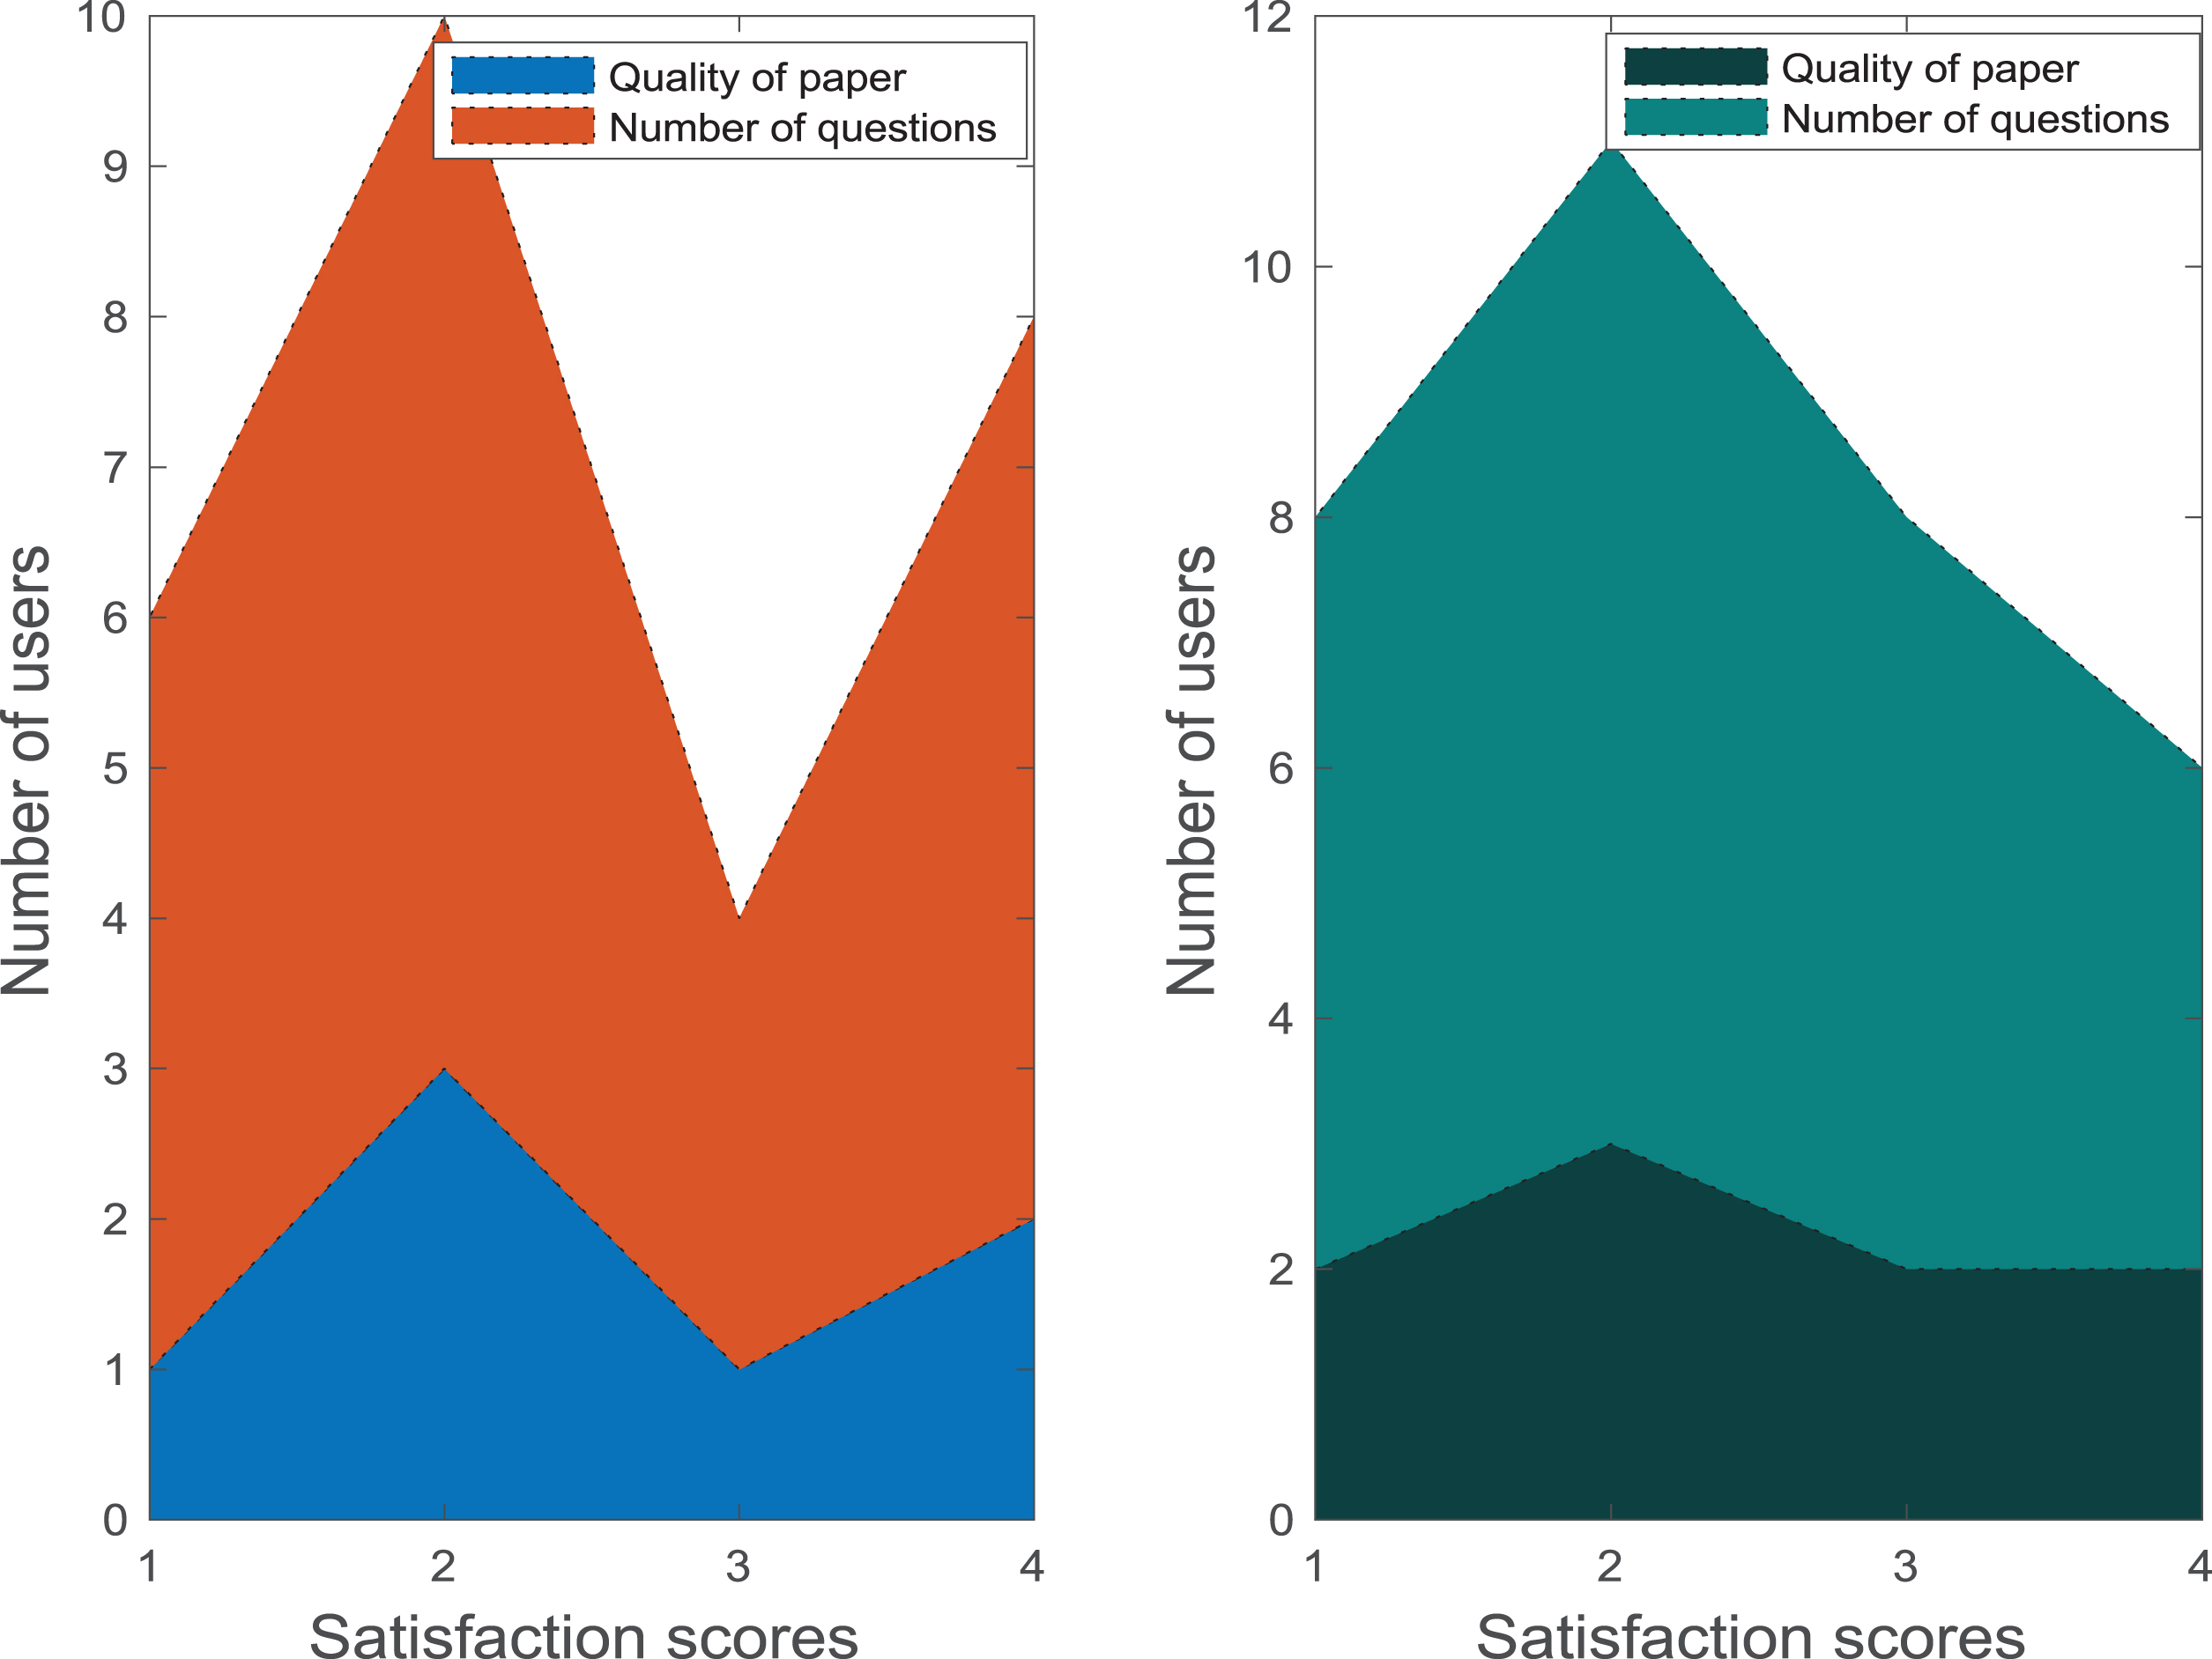
Examination question quality and number of questions.
The score in Fig. 6 refers to the user’s satisfaction with these two test-setting algorithms, where each score is defined as: 1 is extremely poor, 2 is poor, 3 is average, and 4 is satisfactory, 5 points is very satisfied. It can be seen from Fig. 6 that most students scored more than 3 points on the quality of the test questions of these two test paper algorithms, and no students rated the number of test questions of these two test paper algorithms below 3 points, and the average scores of the test question quality score and the average score of the number of test questions both exceed 3.5 points, which is close to a satisfactory score. This proves to a certain extent that the quality of the test questions and the number of test questions of the two test paper algorithms are more in line with user demand.
In the test question recommendation verification, we let the user evaluate the test paper-based algorithm based on diagnostic evaluation through questionnaires, and whether these two test paper algorithms can really improve the score rate of user practice questions and user performance, need statistics [24, 25]. The test data of the experimental class students and the English test scores of the experimental class and the control class are verified.
The author extracted the practice data of the experimental class students from the database, including the score rate of each question type and knowledge point and compared with the average score rate of the system. The specific situation is shown in Figs. 7 and 8. It can be seen from Figs. 7 and 8 that the students in the experimental class only have 1.2 synonymous paraphrases, 1.4 implied meaning inference knowledge points and reading choice question types, the score rate is slightly lower than the system average score rate, and the scores of other knowledge points and question types. The rate of experimental class is higher than the average score rate of the system. Among them, the score rate of 4 knowledge points is more than 20% higher than the average score rate of the system. It can be seen that after using two diagnostic evaluation model-based test paper generation algorithms, the score rate of most knowledge points and question types of the experimental class students is higher than the average score rate of the system, which shows that the experimental class students are using after the test paper algorithm, the mastery of the question types and knowledge points is more thorough than that of the original system users. This proves to a certain extent that the two test assessment algorithms based on the diagnostic evaluation model can effectively target the user’s question types and knowledge point obstacles, and can provide users with more accurate test questions.
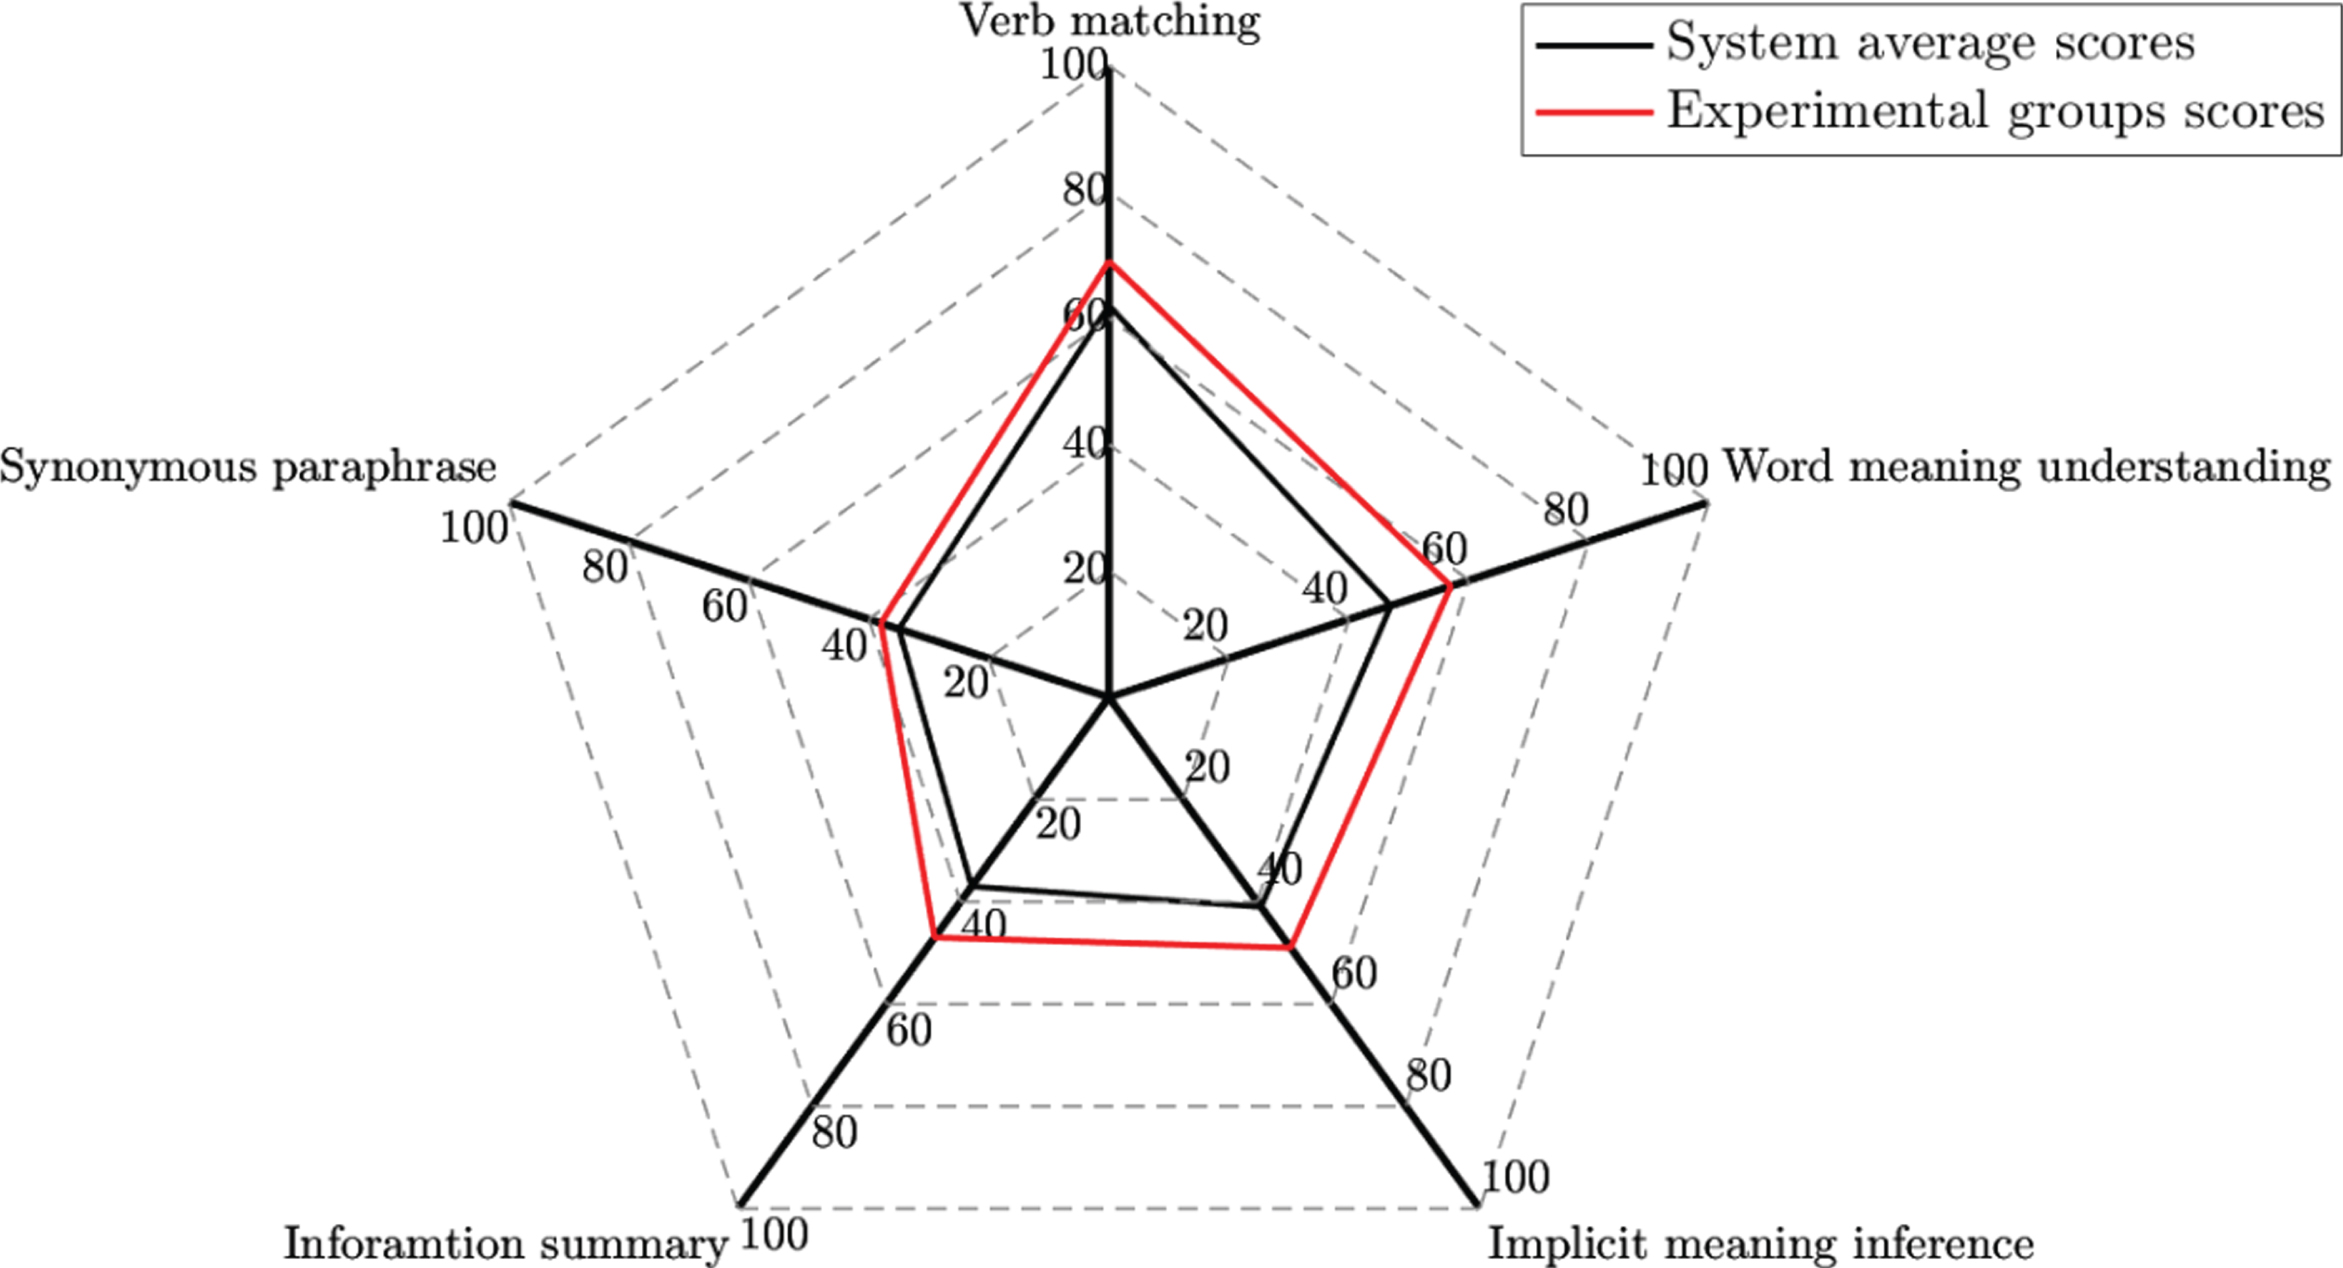
Comparison of question type scoring rates.

Comparison of score points of knowledge points.
In addition, after the results of the fourth-level examinations were announced, the author also counted the average grades of the fourth grade and the proportion of the number of passers of the four grades in the experimental class, the control class and the whole school. The specific situation is shown in Table 2.
Average English scores and tests passed
According to the statistical results in Table 2, we can see that the average score of the experimental class is 372 points and 36.8% of the students passed the exam, the average score of the control class is 337 points and 18.3% of the students passed the exam. The school’s average score for this exam is 361 points and 22.7% of the students passed the exam. From the above data, it can be seen that the average score of the experimental class is 35 points higher than that of the control class, and the proportion of passing people is also 18% higher. The average grade of the experimental class is also 11 higher than the average grade of the whole school, and the proportion of passersby is also 14% higher.
This result verification experiment can verify the actual effect of two diagnostic test-based paper-building algorithms to a certain extent. Through the comparison of the results of the experimental class and the control class, it can be seen that although the initial level of the students in the experimental class is the same as the control class, after using the diagnostic evaluation system, the score has slightly improved and the number of passers has increased. At the same time, the average score of the experimental class is also higher than the average score of the whole school, and the passing rate is also increased compared with the whole school, so it can be proved to some extent that the actual use of the two test paper-based algorithms based on diagnostic evaluation.
After analyzing the personalized learning system, this article explores the shortcomings of the current college English testing framework, and conducts research from three aspects of learning status evaluation, question type association analysis and college English score prediction, plus the existing knowledge points of the system association rules jointly build a diagnostic evaluation model, and then based on the diagnostic evaluation model, a test paper-based algorithm based on question-type association rules is proposed. These two algorithms improve the system’s test paper-making function and can target users’ learning status and knowledge points. Type mastering situation and question type association rules personalized guidance and test question recommendation. Through comparison experiments, it can be seen that this algorithm is closer to the learner’s own learning situation than the original simple test paper mode, and the model of learning state evaluation model, difficulty allocation scheme and question association rules is added, which can be effectively effective. According to the learner’s personal situation, we can effectively carry out test questions and quickly improve English performance.
Footnotes
Acknowledgments
This work was supported by the Project: General Project of Philosophy and Social Sciences in Guizhou Province “A study on theConstruction of Information Learning Community for basic language Teachers in GuizhouProvince”(No: 18GZYB60).