
Abstract
In ideological and political teaching, students have more serious problem behaviors in the classroom, including distracted, dazed, inattentive, and sleeping. In order to improve the efficiency of ideological and political teaching, based on artificial intelligence technology, this paper constructs a real-time monitoring system for ideological and political classrooms based on artificial intelligence algorithms, and builds model function modules according to the actual needs of ideological and political teaching monitoring. Moreover, this study makes reasonable calculations on the information monitoring and information transmission parts and installs a different number of monitoring equipment in different fixed locations according to the needs of signal monitoring. In addition, this paper designs a control experiment to study the system performance and verify the parameters from multiple aspects. The research results show that the system model constructed in this paper is stable in ideological and political teaching and has certain effects.
Introduction
The ideological and political teaching process is relatively boring, and students’ thoughts are prone to wandering. In the era of artificial intelligence, we can use artificial intelligence methods to monitor the teaching process in real time, which can effectively improve the ideological and political teaching effect. Therefore, it is necessary to study the intelligent online monitoring system matching with ideological and political teaching [1].
Student classroom problem behavior refers to the behavior that students appear in the classroom, which does not meet the school’s code of conduct and affects teachers’ teaching and reduces teaching efficiency. Students’ classroom behavior will undoubtedly affect classroom teaching activities and reduce teaching efficiency. Moreover, it will affect students’ learning activities, and even affect students’ physical and mental health [2].
In order to improve teaching efficiency and ensure that teachers can manage the classroom, there are researches on classroom problem behavior, which can build a bridge between teachers and students to form a good teacher-student relationship and can effectively reduce and prevent problem behavior. Paying attention to the problem behaviors of students in the classroom and exploring the causes of the problems can not only provide insight into the students’ current psychological state, but also provide a basis for subsequent improvement and guidance [3].
Related work
The literature [4] explored the application scenarios under the changing environment of teaching scenes through experiments on wireless sensors in WiFi, Bluetooth and HTTP. Moreover, it also pointed out the advantages, disadvantages and complexity of the three methods, and gave corresponding suggestions for different application scenarios, which provided reference for sensors used in classroom monitoring systems. The literature [5] discussed the design concept and process of the carbon allotrope sensor in terms of low cost and reliability, and the advantages of its use. It has broad application prospects in the field of environmental monitoring in the future. The literature [6] put forward the design idea of classroom remote monitoring system based on sensor nodes, which can realize the monitoring of classroom environment parameters. By analyzing these classroom environment data, intelligent regulation is realized, and teaching efficiency is also effectively improved. Based on wireless sensor network technology, literature [7] designed and developed a teaching history traceable real-time monitoring system. Based on wireless sensor network technology, designed and developed a teaching history traceable real-time monitoring system. Through distributed monitoring, tracking and analysis of students’ classroom status, sensor nodes are deployed. Moreover, it uses an event detection engine, and defines event tracking and monitoring of students. By analyzing these monitoring data, it can finally realize the prediction of teaching quality, and adjust teaching strategies in teaching. Based on the Arduino microcontroller, the literature [8] designed and developed a sensor node that supports the WiFi interface mode, which can send the collected environmental monitoring data to the gateway. The literature [9] designed and developed a Web-oriented teaching monitoring system based on WSN technology. Through the Web interface, the nodes in the wireless sensor network can upload data, and the Web application intercepts the thresholds set by the collected environmental data. If it exceeds the set range, it will push the environmental data warning and monitoring results to the user via email. The literature [10] designed and implemented a teaching environment monitoring system based on wireless sensor networks. This system collects teaching environment information through sensor nodes. The Raspberry Pi acts as a local server, and it is responsible for receiving and processing the data, and finally provides a visual interface, which is relatively user-friendly, but the visualization effect is not good. The literature [11] designed and implemented a wireless sensor network architecture for a teaching environment. It is a low-cost, good-practice monitoring system. By monitoring key environmental data, scientific monitoring of the teaching environment is achieved, and management costs are effectively reduced.
With the continuous improvement of the level of information, the intelligent measurement and control system of the teaching environment has achieved tremendous development in technology and scale. However, there is still a big gap in stability, completeness of supporting facilities, modernization level and intelligence level [12]. The literature [13] installed the Internet of Things system in the teaching environment, and monitored the student learning status, student emotions, student movements and other parameters of the experimental teaching environment in real time, and organized the data obtained by the teaching environment. Then, it classified each group of environmental data according to the classroom teaching environment requirements. In view of the characteristics of the large amount of data for the recognition of the characteristics of the teaching environment and the difficulty of the recognition process, literature [41] used smart sensors and other equipment to establish a teaching environment monitoring system based on the Internet of Things technology to provide technical support and decision-making reference for the construction of a smart teaching environment. On the issue of monitoring the ideological and political teaching environment, the literature [15] used wireless sensor technology, 4 G communication technology to monitor the teaching environment, and used the host computer software to view and manage the data, which provides help for improving the efficiency of classroom teaching management and helps to improve the teaching effect. Data security in DNA based cloud computing using various artificial intelligence models [16].
Relative positioning mathematical model
In the differential positioning mode, the base station and the rover weaken most of the common errors by finding the difference, so the accuracy of the differential positioning is relatively high. In particular, real-time dynamic carrier differential has the advantages of high precision and fast speed, and has become the most commonly used method in engineering applications. The schematic diagram of relative positioning is shown in the following Figure [17–19]:
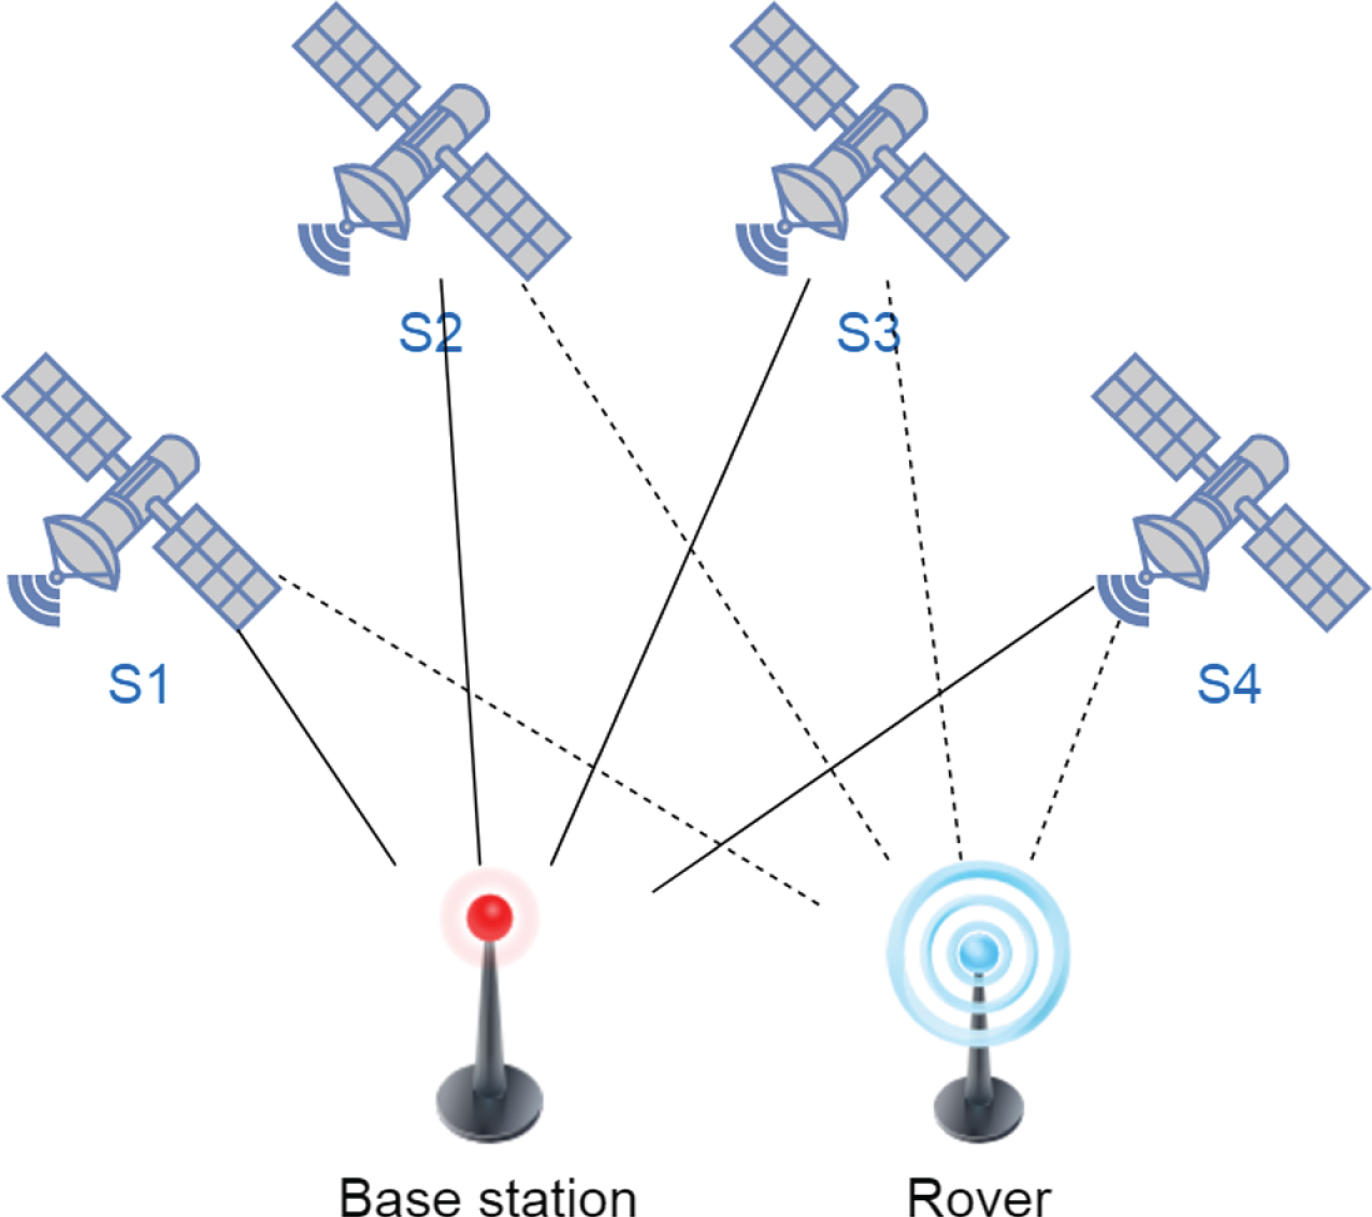
Schematic diagram of relative positioning.
It can be seen from the above schematic diagram that the phase of the carrier signal broadcast by the satellite at a certain time is φ
S
, and the signal is captured by the receiver after a period of time, the phase is φ
R
, and the distance is ρ = λ (φ
S
- φ
R
). At the same time, (φ
S
- φ
R
) contains two parts which are N integer weeks and Fr (φ) less than one week. The observation equation of carrier phase measurement is as follows [17]:
In the formula, ρ is the geometric distance between satellites, λ is the carrier wavelength, and (X
i
, Y
i
, Z
i
) is the space coordinate of satellite i. Meanwhile, (X, Y, Z) is the receiver coordinate, c is the speed of light, and
It can be seen from the above formula (1) that there are many unknowns in the observation equation. If all of them are used as the parameters to be estimated, more observations are required, which is not conducive to the solution of the equation. In relative positioning, the base station and the rover observe the same set of satellites, eliminate the common error by finding the difference, and improve the calculation accuracy and solution efficiency [20].
The commonly used differential method is to first perform single difference between receivers at different stations, then perform double difference between different satellites, and finally perform triple difference between different epochs. We assume that at a certain moment t1, the two receivers i and j simultaneously observe the satellite p, the observation equation of the two is as follows [21–23]:
The parameter in the formula has the same meaning as the formula (1). Finding the difference between the two can obtain:
For convenience, formula (3) can be abbreviated as:
It can be seen from the above formula that after finding a difference between the receivers of the station, the number of observation equations decreases and various errors become relative errors. Then, the difference between the reference star and the non-reference star of the station is calculated again to obtain the double difference equation. We assume that two stations observe satellites p and q at the same time, and the double-difference observation equation can be obtained from formula (3) as follows [24]:
After simplification, formula (5) is:
The result after quadratic difference is called double-difference observation. It can be seen from formula (6) that the receiver clock difference after the second difference is eliminated. Similarly, at the same time, if these two stations simultaneously observe the two satellites at another time t2, the three-difference observation equation is as follows:
After simplification, we can obtain:
Since the observation equation is not linear, the adjustment cannot be directly solved. Therefore, the observation equation needs to be linearized, and after the Taylor series expansion of formula (8), the following results are obtained:
In the formula, k, l, and m are the cosine of the direction from the station position to the satellite position.
All the common-view satellites of the rover and the reference station establish the observation equation according to the above formula, and then obtain the corresponding error equation matrix. According to the principle of indirect adjustment, the least squares solution is used to obtain the position parameters of the rover [25].
GNSS satellite-side errors are mainly errors caused by the hardware equipment on the satellite and errors caused by the movement state of the satellite.
Satellite ephemeris error
In the positioning process, the spatial position of the satellite needs to be obtained, and the satellite position is calculated by broadcasting the ephemeris. The difference between the satellite and its true position is called the satellite ephemeris error. The influencing factors of ephemeris error include the location and number of monitoring stations, perturbation model and orbit determination technology. Its influence on the carrier phase differential positioning can be explained by the following formula:
In the formula, ρ is the geometric distance from the station to the satellite, B is the distance from the rover to the reference station, and dp is the ephemeris error. Meanwhile, dB is the error caused by the ephemeris error. In the application of landslide monitoring engineering, the baseline length is usually less than 5 km, the accuracy of the broadcast ephemeris is about 2 m, and the resulting baseline error does not exceed 0.1 mm.
The satellite clock is a key device for positioning, navigation and timing. The quality of the satellite clock has an important impact on the results of landslide monitoring. Satellite clocks are usually high-precision atomic clocks such as rubidium clocks, cesium clocks, and hydrogen clocks. They work steadily in the space working environment, but they still have some system errors, especially satellite clocks that work for a long time. Even a small-time error will become very large after being amplified by the speed of light, so the clock difference term must be corrected. Commonly used correction formulas are as follows:
In the formula, t0 is the reference epoch time, a0 is the clock difference at time t0 in the satellite, and a1 is the speed of the clock difference change at time t0 in the satellite. At the same time, a2 is the acceleration of the clock difference change at time t0 in the satellite. At present, the accuracy of broadcast ephemeris clock error is about 5 15 ns, and the ranging error is about 1.5 4.5 m. The three clock difference parameters in formula (11) are calculated by the ground master station and used by the broadcast ephemeris broadcast user, which can be eliminated by differential in relative positioning.
In GNSS positioning, the geometric distance of the satellite is often referred to as the distance between the antenna phase center of the station signal receiving device and the satellite-side signal transmitting device. The satellite antenna phase center error refers to the deviation of the satellite mass center and the antenna phase center. This value can be corrected by visiting the IGS (International GNSS Service) official website to download the corresponding antenna file.
In the process of satellite signal transmission through the atmosphere and into the receiver, the signal will be subject to a lot of interference and have some impact on the observed value. These errors are mainly related to the atmosphere and signal reflection.
(1) Ionospheric delay error
The atmosphere generally 50 to 1000 kilometers from the ground is called the ionosphere. When the signal passes through this area, the propagation speed and propagation path will be affected, causing the geometric distance between the satellite and the receiver to be inaccurate and then affecting the positioning accuracy. The effect of the ionosphere on the signal delay is shown in formula (12):
In the formula, N e is the electron density, that is, the number of electrons per unit volume, and f is the signal frequency.
(2) Tropospheric delay error
The atmosphere generally 50 kilometers or less from the ground is called the troposphere. The composition of the troposphere is complex. The satellite signal will refract when passing through this area. Meanwhile, the tropospheric error is the main part of the atmospheric error caused by the signal. The tropospheric delay is usually divided into two parts: the dry component related to atmospheric temperature and pressure and the wet component related to atmospheric height and humidity.
(3) Multipath error
When the receiver of the station receives satellite signals, a part of the main signal comes directly from the satellite, and a small part of the satellite signal enters after being reflected by the reflector. These two parts of the signal will produce interference effects that affect the observed value. This part of the deviation is called multipath error, and the specific process is shown in the Figure below.
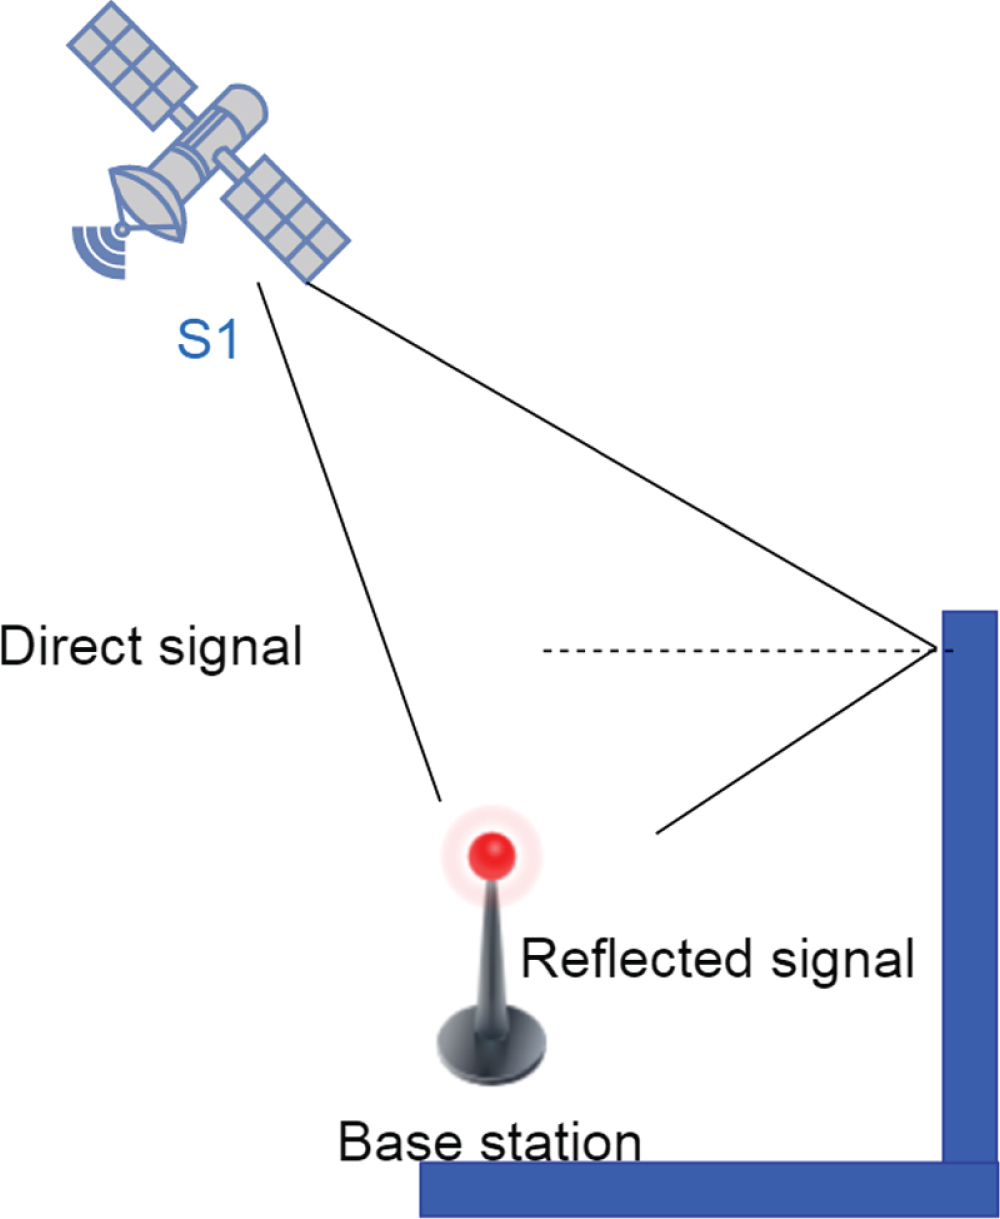
Schematic diagram of multipath.
The effect of multipath error on positioning is shown in the following formula:
In the formula, Δφ = 4π sin β/ - λ. β is the incident angle, and h is the vertical distance from the receiver antenna to the reflecting surface. When Δφ is maximum, the influence of multipath on carrier phase can reach 5 cm, and its impact on the pseudorange is greater. The multipath error is the main source of error in landslide monitoring.
In the GNSS positioning process, there are also some errors other than the above errors, such as the earth rotation error and the relativistic effect error.
(1) Earth rotation error
The coordinate system used in the calculation of landslide monitoring data uses the protocol earth coordinate system, and the satellite position at the time of receiving the satellite signal obtained by the receiving device has a rotational relationship with the position when the satellite transmits the signal. This error is mainly related to the rotation of the earth. The effect of the earth’s rotation is shown in the following formula:
In the formula, ω is the earth’s rotation angular velocity, δ ρ is the distance change from the satellite to the receiver; When the satellite altitude cut-off angle is 15°, it will have centimeter-level influence on the baseline measurement, so it must be corrected.
(2) Relativistic effect error
The relativistic effect is mainly due to the different motion states of the atomic clock on the satellite and the receiver clock on the earth station, resulting in a relative clock difference in the clock oscillation. The distance measurement error caused by the relativistic effect can reach a maximum of 6.8 meters, which must be considered in high-precision positioning. The relativistic effect can be corrected by using the following formula:
In the formula, c is the speed of light, r s is the position vector of the satellite at the reference time, and v s is the speed vector of the satellite at the reference time.
The core of the fixed ambiguity of the LAMBDA method is to first reduce the ambiguity parameters, which greatly reduces the interaction between the ambiguity parameters and effectively improves the search efficiency of the ambiguity. After an integer solution is obtained in the new search space, it is transformed into the original space to obtain the final solution. The main process is as follows:
In the formula, N is the initial ambiguity floating point solution, z is the conversion matrix, and N0 is the initial ambiguity integer solution. Meanwhile, Q N is the initial variance-covariance matrix; The lines with superscripts are the corresponding values in the new space after the correlation is reduced.
The conditions for determining the ambiguity in the new space are:
After searching to get the ambiguity, you need to test it to confirm whether it is fixed correctly. The commonly used test method is ratio value test:
In the formula,
6 System model construction
This system is mainly composed of several parts such as information collection part, data communication and processing, data analysis and data visual display. The system function module structure is shown in Fig. 3.

System function module composition.
The overall architecture of the wireless monitoring system is shown in Fig. 4. It is mainly divided into two parts, one is the monitoring equipment and the other is the back-end system, and then through the bridge of the public network, the front-end monitoring equipment and the back-end software system are organically combined.

Overall system framework diagram.
The main function of the pre-receiver (hardware) part of this design is to collect the field strength and signal-to-noise ratio of the signal at the monitored point. It is actually a hardware development. The front-end receiving equipment (hardware) is mainly able to process and store the relevant data collected through the receiving module and transmit the data to the background monitoring system through the mobile phone APP (GPRS module) and the public network. The front-end receiving device (hardware) is mainly composed of receiving processing module and processor module. In addition, data transmission needs to go through the public network, and the mobile phone APP (GPRS) module needs to be developed. The design scheme is shown in Fig. 5.

Design framework diagram of the monitor.
The design of the background management system is to develop software. According to the market demand analysis, the background software is designed in summary. After the test, the system enters the detailed design, conducts integration tests, and finally starts coding and testing each unit. The software development model using the “V” model in this background software system is shown in Fig. 6. At present, the data returned through the mobile phone APP and the public network is stored in the database module, and the data is analyzed and processed. The specific design scheme is shown in Fig. 7. The background management system mainly includes a database module, a query module, a map information module and an alarm module. Of course, we can also add some expansion modules according to the development of technology and market demand.

“V” model diagram.

Design framework diagram of background management software.
On the basis of the above model construction, this paper studies and analyzes the performance of the model, conducts system data statistics by designing control experiments, and performs quantitative processing by statistical methods. The model constructed in this paper is integrated into teaching, and the status of students in teaching is counted. A total of 50 sets of data are set, and the recognition results are shown in Table 1 and Fig. 8.
Statistical table of the recognition results of the student status

Statistical diagram of the recognition results of the student status.
From the results in Fig. 8 above, we can see that the system constructed in this paper performs well and performs well in the student status recognition test. On this basis, the feedback effect of the system is tested, and the accuracy of the feedback information is analyzed. The results are shown in Table 2 and Fig. 9.
Statistical table of accuracy rate of feedback information (%)
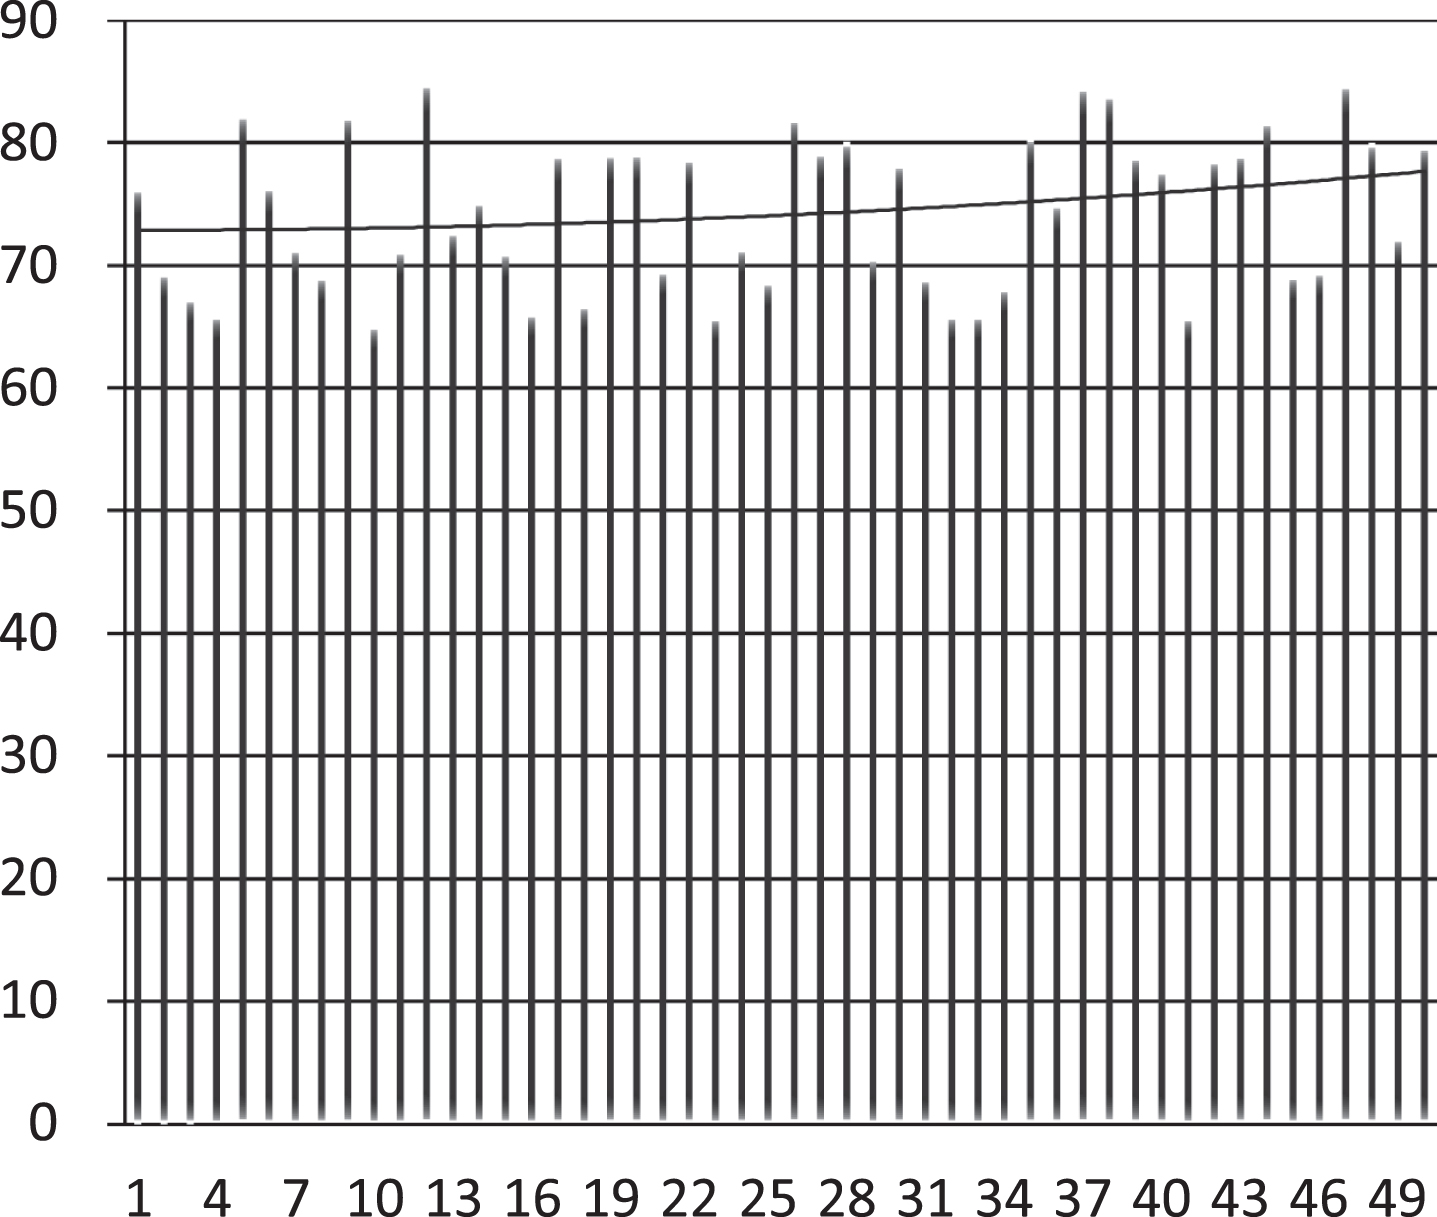
Table 2 Statistical diagram of accuracy rate of feedback information (%).
As can be seen from the statistical graph shown in Fig. 9, the accuracy of the feedback information is high, which can meet the actual teaching. Therefore, the system constructed in this paper has good performance and can be applied to practice.
In ideological and political teaching, students have more serious problem behaviors in the classroom, including distracted, dazed, inattentive, and sleeping. In actual teaching, teachers are unable to recognize students’ status through human observation, which is the cause of various classroom problem behaviors. In order to improve the efficiency of ideological and political teaching, based on artificial intelligence technology, this article builds a real-time monitoring system for ideological and political classrooms based on artificial intelligence algorithms. This system mainly includes several components such as information collection part, data communication and processing, data analysis and data visual display. The overall structure of the wireless monitoring system is mainly divided into two parts, one is the monitoring equipment and the other is the back-end system, and then through the bridge of the public network, the front-end monitoring equipment and the back-end software system are organically combined. Moreover, the main function of the pre-receiver (hardware) part of this design is to collect the field strength and signal-to-noise ratio of the signal at the monitored point. In addition, this paper designs a control experiment to study the system performance. The research results show that the system constructed in this paper has good performance.