
Abstract
In order to build a virtual urban planning model and improve the effect of urban planning, this paper builds a virtual urban planning design model based on GIS big data technology and machine learning algorithms, and proposes a solution that combines multiple features. With the development of polarized SAR in the direction of high resolution, a single feature often cannot fully express the detailed information of ground objects, resulting in poor classification results and low accuracy. The combination of multiple features can express feature information well. In addition, this paper uses the ELM method to plan SAR ground object classification, uses an extreme learning machine classification algorithm with fast learning speed and good classification effect, and uses ELM as a classifier. Finally, this paper designs experiments to explore the performance of the model constructed in this paper from two aspects: detection accuracy and planning score. The research results show that the model constructed in this paper meets the expected goals.
Introduction
As a strategic goal of urban development and a powerful means of rational allocation and macro-control of urban resources, the overall urban planning plays an extremely important position and role in the promotion of urbanization. However, there are still many problems in the formulation and implementation of the overall urban planning in my country. The overall plan is a macroscopic and complex giant system. The implementation of the overall plan requires the coordination of multiple departments such as transportation and environmental protection. However, due to the influence of the deformed view of political performance, the planning method of “emphasizing preparation and neglecting implementation” makes the implementation far from planning. For a long time, urban development has focused on the consideration of material space, while ignoring the deeper reasons behind urban development. Moreover, urban development lacks awareness of social and political aspects. For these reasons, there are fewer rigorous and reliable evaluations of the effectiveness of the implementation process of urban planning in China, and fewer studies on dynamic monitoring of urban development. The overall plan needs to establish a working mechanism of “preparation-implementation-evaluation-modification” to truly improve the authority and scientificity of the plan, and it is also an institutionalized solution to the problem of “rigid solidification” [1].
Remote sensing technology and geographic information technology have developed extremely rapidly since the 1970 s and have been widely used in agriculture, forestry, civil engineering, geology and other industries. In the dynamic monitoring of the implementation process of the city master plan, with the help of RS and GIS information acquisition technology and decision support system to effectively monitor the development of the city, to grasp the sustainable development of the city in time, and to improve the management level of the city has gradually become one of the current research hotspots of urban planning [2].
Through GIS big data analysis, it can effectively promote urban planning to shift from focusing on preparation to focusing on implementation. It is no longer sustainable to rely solely on the continuous preparation of various levels of planning without considering the dynamics of urban development. It is necessary to strengthen the monitoring and evaluation of the implementation process of the urban master plan, adopt the scientific analysis and research methods that combine qualitative and quantitative analysis to dynamically monitor the planning, and establish a reasonable dynamic monitoring and supervision system. At the same time, it is necessary to promote the transformation of planning thinking from “static” to “dynamic” and the transformation from focusing on urban and rural planning preparation to focusing on planning implementation [3].
Related work
As a pioneer in the field of GIS development, western developed countries realized the importance of combining GIS technology with urban planning and management earlier. As a more professional spatial platform that provides information and information services for urban construction, planning, management and development, geographic information systems have been valued and used earlier by Western developed countries. Such an understanding is undoubtedly closely related to the degree of material civilization of the Western countries. It is estimated that 70% to 80% of the data processed by local governments in daily business are related to geographic location [4], and this ratio is also quite alarming. At present, more and more European and American countries have successively introduced GIS technology into their own countries to serve in the management of urban planning and design, military deployment, and national defense applications within the country under the control of the state and local governments [5]. Following this pace, it covers some developed countries in the Americas, Australia, East Asia, and Western Europe, with capitalist countries as the overwhelming majority, and the United States, Japan and Australia as representative countries [6]. In foreign countries, GIS technology is used in every corner of the urban planning management system, and has a strong universality. However, due to the differences in national politics, regional economy, science and technology development foundation, application requirements and many other aspects, the application level of GIS technology in different countries is quite different [7]. In different countries, representative application examples abound. The literature [8] used GIS as a support in a research project analyzing the landscape changes at the eastern end of the Upper Peninsula of Michigan, USA. The literature [9] used GIS decision support system in the process of planning and analyzing park green space. The literature [10] uses GIS to evaluate landscape sensitivity. The literature [11] combined GIS technology with three-dimensional virtual reality, created three-dimensional effects with the help of ArcViewGIS platform and visualization software, integrates overlay analysis, and conducted auxiliary evaluation for the building environment. In the context of global heated discussions, many countries have begun to formulate plans for a digital earth suitable for their own basic conditions. Whether to start the design of the “digital earth” or not has developed rapidly has become an important aspect of the national development strategy, and has become another new field in which countries compete with each other [12]. Literature [13] mentioned that the digital earth itself is a virtual system. The existence of this virtual system is based on the theoretical support in the discipline of geography, and the “latitude and longitude network", that is, the basic focus in the application of GIS technology is geographic coordinates. Due to the special shape of the earth, the basic coordinate system of the graticule used by each country will also be adjusted according to the specific geographic conditions of the country, and it is not a globally unified absolute standard coordinate system. This also explains the importance of establishing a “digital earth” based on the geographic coordinate system of the country where it is located. Only by establishing a “digital earth” system that is conducive to the use of the motherland, can we obtain data analysis results that are more suitable for domestic conditions in practical areas such as multi-resolution analysis and interpretation, ground object coordinate correction, and multi-dimensional restoration of real scenes. The results of these treatments will, in a sense, play a very important role in the country’s security and stability, the construction of the national defense field, the blooming of charm on a global scale, and the competition among countries in the world. At the same time, it also represents a country’s informatization strength and development advantages [14]. In the United States, geographic information systems have been regarded by local governments as an indispensable technology in their work. The proportion of cities and regions that use geographic information systems for work support in the United States has also increased rapidly, and geographic information systems have been fully and widely used in various functional tasks [15]. At present, the urban planning management information system of the United States has gradually developed from the initial stage of vigorous development and gradually entered the stage of rational development. With the gradual construction and improvement of the basic system, a number of expert decision support systems have emerged during this period. At the same time, some experts and scholars have begun to focus on the details of the system platform product design, such as the construction cost of the information system, the economic and social benefits generated after the system is completed, and how to realize the sharing of data and analysis results after the system platform design is completed [16].
In European countries such as the United Kingdom, geographic information system technology also plays a very important role in the field of urban planning and management, and has achieved a high degree of popularity. However, the high popularity does not mean the improvement of the application level. GIS technology is still mainly used to complete the basic mapping tasks in the planning work and the approval tasks in the planning process. At the same time, various local governments did not conduct data collection and project analysis in accordance with unified national standards when establishing data system platforms, which led to the embarrassing situation of a large number of systems but incompatible with each other and unable to be used in series. Although in the production process, the principle of cost reduction and flexible operation accelerated the construction of local-level systems in a sense, it also deviated from the national unified standardized data format and standard processing method, which affected the overall standardization process [17].
The literature [18] implemented a set of WebGIS client based on Cesium, and analyzed and studied the principles of scene rendering, vector element visualization and map terrain visualization using Cesium. Moreover, on this basis, it used Cesium to design, implement and test the WebGIS client module, and realize GIS function modules such as layer directory tree and geographic network module. The literature [19] used Cesium to develop a set of 3D earth GIS environment platform. After studying the compression and transmission mechanism of vector data, it connected the server with the Cesium engine, and displayed the basic geographic information data and thematic geographic data on the WebGL platform through the server. Moreover, it used demographic data as an example, and uses provinces as a classification standard to perform a three-dimensional visualization of the demographic data. The literature [20] studied the 3D visualization of real terrain based on Three-js. On the basis of analyzing and researching the tile data, using the elevation value extracted from the data, it used the Three-js interface to visualize the three-dimensional terrain, and created an organization to generate a 4-layer LOD model.
The literature [21] combines the characteristics of two-dimensional spatial data with planning data, which mainly provides data support for law and administrative management. As municipal departments and urban planning bureaus rely more and more on these data, they propose that these data can be used for three-dimensional visualization management, Based on 3D visualization tools and 3D spatial database to construct the urban object space framework: The literature [22] proposed that the two-dimensional planning data generated in the previous urban planning process can be fully used and converted into three-dimensional spatial data for display through laser ranging technology. After analyzing a large number of theoretical and production projects, the literature [23] combined the development of visualization technology and the application of three-dimensional planning theory to propose that the most important issue of three-dimensional planning is to clarify the application scenarios, functions and display methods of planning data, regardless of technical conditions. The literature [24] put forward the concept of digital city. Digital city is a new type of urban space that combines urban geographic information with other urban information and stores this information on a computer network to provide users with remote access services. With the rise of this concept and the rise of the geographic information industry, the construction of urban planning informatization has entered the digital city industrial chain and has become an important link in the digital city industrial chain. Moreover, three-dimensional urban planning has become a mainstream technology.
Feature parameter selection
Image feature extraction mainly includes decomposition scattering matrix, C-based matrix and T-based matrix. The two kinds of C matrix and T matrix are used frequently and frequently.
(1) Freeman-Durden decomposition
The often-said Freeman decomposition was proposed by Freeman and Durden in 1988, and it is an incoherent decomposition method. Its idea is to establish three models of scattering mechanisms for the T matrix or C matrix under certain constraints, which can be decomposed into the following forms, including: Volume scattering; Second scattering; Surface scattering.
In the above formula, a is a variable related to secondary scattering, and b is a variable related to surface scattering. By establishing a system of equations, we can find the parameters required by this decomposition method. The solution process of each dissipated energy is as follows:
At the same time, Freeman decomposition can also get a special parameter, that is the total SPAN power, which is a constant.
According to past experience, uneven ground can be expressed by surface scattering, crop targets covering a large number of leaves can be expressed in the form of volume scattering, and urban targets can be expressed by even scattering. Establishing such a one-to-one correspondence makes the decomposition change more sufficient and becomes an important acquisition method for feature extraction.
(2) Cloude decomposition
This refers to the method of decomposing a coherent matrix with positive semi-definite characteristics to obtain parameters. This method can ensure that the eigenvalues remain constant under different polarization bases, that is, satisfy the basis invariance. The coherence matrix has the following relationship with the eigenvalues and the corresponding eigenvectors:
The eigenvalues in the above formula satisfy the constraints of λ1 ⩾ λ2 ⩾ λ3, and they are all real numbers. By observing the formula, we get that the coherence matrix can be represented by the sum of three matrices. In order to seek to express the randomness of the scattering of the media, Cloude et al. proposed the physical quantity of scattering entropy H (Entropy). It is expressed as follows:
The scattering entropy H (greater than or equal to 0 and less than or equal to 1) represents the random process of scattering coal from isotropic scattering to completely random scattering. If H is very small, it means that the vector corresponding to the largest eigenvalue is sufficient to express the feature’s attributes. This situation is called depolarization. If H is high, it means that all feature vectors should be considered. When the entropy value is 1, it is a random noise.
Although the scattering entropy can reflect the scattering properties of the ground objects in the same area, it does not reflect the contribution of the other two features for the medium and low entropy (λ1 > λ2, λ3). Therefore, a parameter anti-entropy A is proposed to supplement the problem that cannot be solved above. The definition of anti-entropy is as follows:
It can be seen from the above formula that anti-entropy A can express the corresponding relationship of smaller scattering components. It has been proved that anti-entropy A can distinguish the old and new frozen layers well. If the anti-entropy value is zero, it can be seen from the above formula that there are two eigenvalues of the same size. There are the following reasonable explanations: one possibility is that the three eigenvalues to be solved are equal, the anti-entropy A is the supplement of the scattering entropy H, and the other situation shows that there are two values close to 0. From a priori experience, if the scattering entropy is greater than 0.7, anti-entropy A is often needed to further exert its effect.
The mean value of the scattering angle a is expressed in formula (10):
At this point, we can get the set of eigenvalues of H, A, α and λ1, λ2, λ3 through Cloude decomposition.
In recent years, ELM, as an emerging machine learning method, has become a popular research direction under the continuous research of many researchers all over the world. The extreme learning machine mainly has the following four characteristics. The problem that ELM theory has not solved in the field of neural networks and machine learning is whether the learning process needs to adjust the hidden layer nodes. Different from previous methods, this theory proves that for most neural networks and learning algorithms (such as hidden layer activation as a function Fourier series, biological learning, etc.), hidden layer nodes do not need to be adjusted iteratively at all. However, the early work did not provide the theoretical basis of random hidden layer node feedforward neural network. ELM belongs to both general single hidden layer feedforward network and multi-hidden layer feedforward network (including biological neural network). The same structure of ELM can be used for feature learning, clustering, regression and two-class/multi-class classification problems. Unlike ELM, SVM and Least Squares Support Vector Machine (LS-SVM) tend to get sub-optimal solutions. At the same time, SVM and LS-SVM did not consider the feature representation of the hidden layer in the multilayer feedforward network.
ELM learning algorithm
Based on the SLFN model, Huang Guangbin and others proposed the ELM learning algorithm in order to solve the long training time of traditional neural network algorithms.
In the ELM algorithm, the weights connecting the input layer and the hidden layer are randomly selected, and the weights connecting the hidden layer and the output layer are determined by the least-norm least square solution. Although the ELM algorithm has a faster learning speed and better generalization ability compared with the traditional neural network theory, the algorithm needs to manually determine the network structure, that is, the number of hidden nodes. For a single hidden layer forward neural network, the number of hidden nodes directly affects the generalization ability of the network. If the number of hidden units is too large, not only will over-fitting and poor generalization ability occur, but also the computational complexity will increase significantly. However, if there are too few hidden units, not only the approximation of the ELM algorithm cannot be guaranteed, but also under-fitting and large statistical deviations will be caused, resulting in large training errors and poor generalization ability. In addition, under the premise of achieving the same goal, it is obvious that the fewer the number of hidden units in the network, the lower the calculation time and the higher the effectiveness of the relevant learning algorithm. Therefore, how to determine the optimal network structure has become a main research direction of the ELM algorithm.
We assume that there is a simple SFLN model that satisfies N inputs, M outputs, and contains L hidden layer nodes. For different samples (x
i
, t
i
), a standard mathematical model is:
The above formula represents the weight vector between the i-th hidden node and the input node.
The above formula represents the weight vector connecting the i-th hidden node and the output node, and (·) represents the inner product.
If this network can approximate N samples with 0 error, that is to say, the following formula is true, then there is formula (17) that holds:
The above equations are equivalent to:
This matrix H is the hidden output matrix of the network. Huang Guangbin believes that for an arbitrary tight input sample set, when the input weights and biases of the feedforward neural network are randomly set and there is a non-zero continuous differentiable activation function, SLFN can approximate any continuous function. It means that the input weights and biases can be set at will or can be given at one time, and no adjustment is needed during the training process.
In the ELM learning algorithm, when the output weights and deviations are randomly set, the hidden layer H matrix is determined. Therefore, training becomes a problem of solving the least squares norm solution of the output weights, which is equivalent to finding:
According to the theory of least squares, it can be solved as follows:
H+ is the Moore-Penrose generalized inverse of H.
Therefore, the main learning steps of ELM are summarized as follows: It determines the structure of the neural network; It sets node parameters randomly; It calculates the hidden layer output matrix H; Its solution to the least square norm solution;
It calculates the output corresponding to the test sample;
Classification prediction
The difference between ELM and SVM and SLFN
1. Comparison between ELM and SVM For multi-classification problems, SVM needs to use multiple classifiers, while ELM only needs one network model to complete multi-classification. Because the purpose of ELM learning is to minimize the training error, it is likely to be over-optimized; The output weight of ELM is obtained by solving least squares, so its stability is poor. A lot of experiments have proved that from the perspective of stability, the SVM method is better than the ELM method, and there will be slight fluctuations when using the ELM method. However, the accuracy of the ELM learning algorithm is still acceptable, especially its fast learning speed. This learning feature makes it an absolute advantage.
2. Comparison of ELM algorithm and SLFN based on gradient: In dealing with complex network problems, ELM is much stronger than traditional methods and promotion capabilities. ELM can hardly need to learn and has an amazing learning speed. It is enough to solve the output weight β alone.
The development technology adopted by the urban planning management information system is NET technology, and the programming development environment adopts VisualStudio.net software. In order to improve the security of the urban planning management information system, the network architecture adopted by the system is the C/S network architecture. The software structure diagram of the concrete system is shown as in Fig. 1.
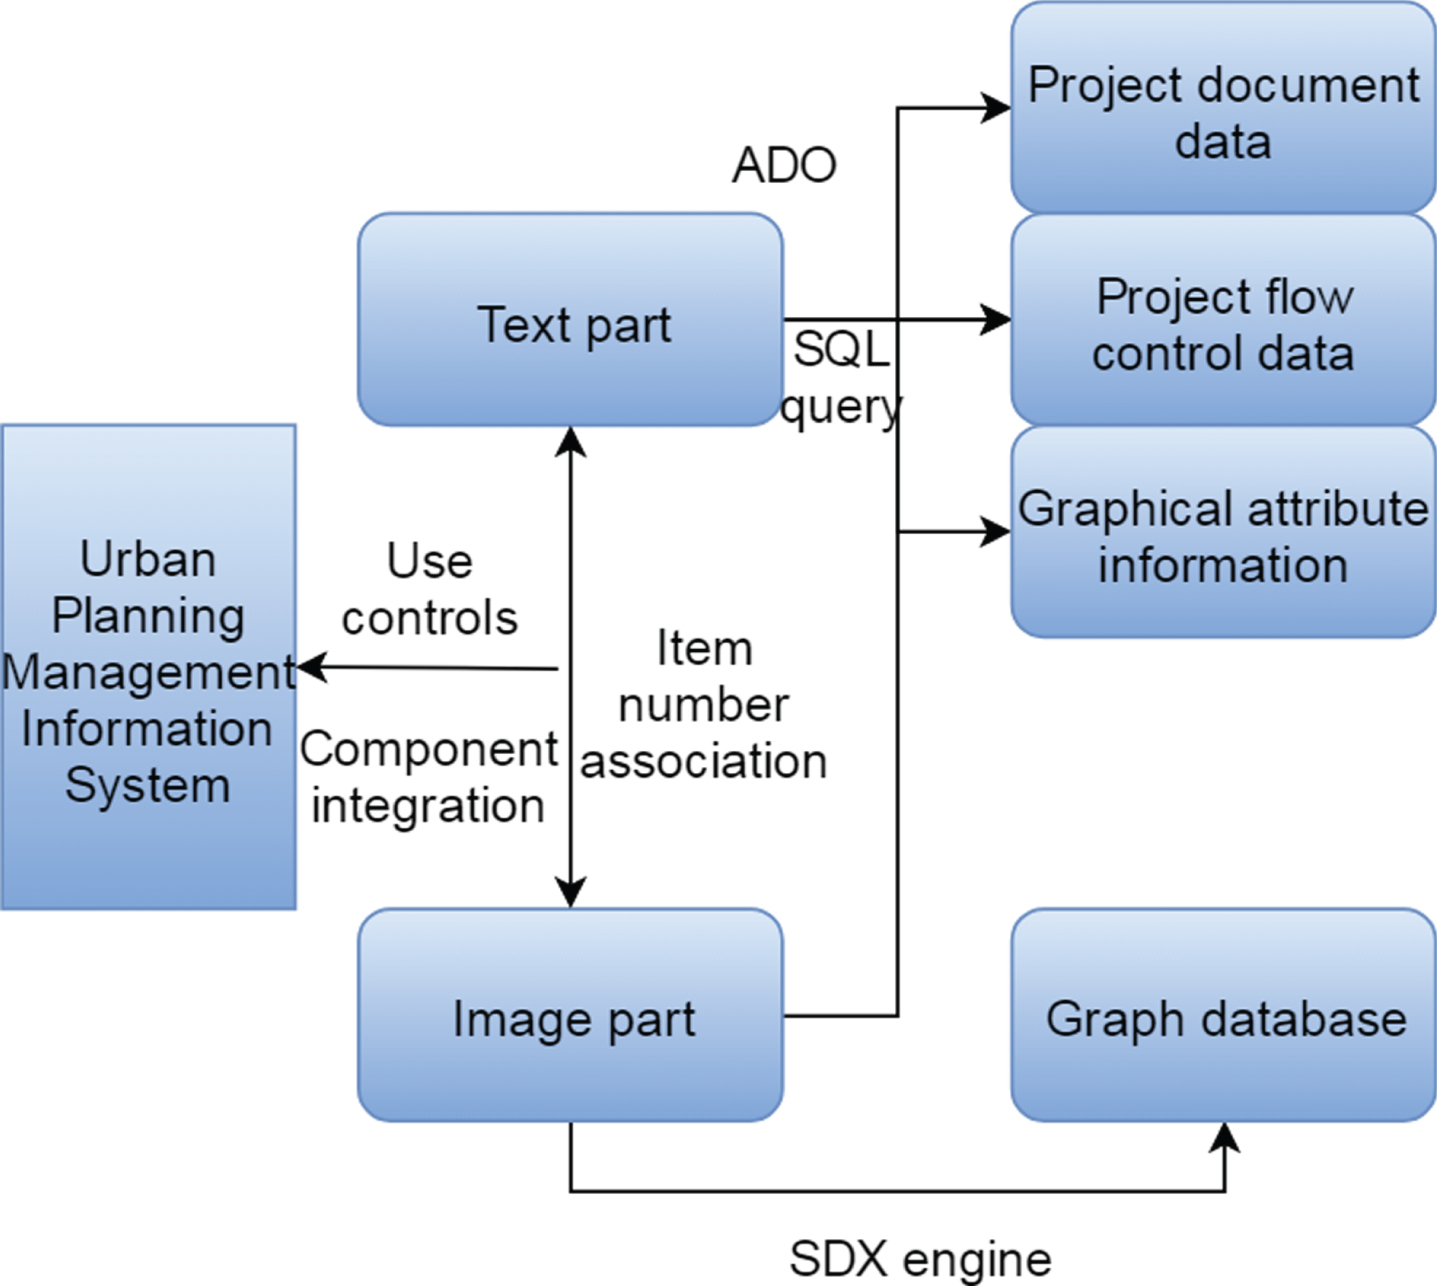
The overall software structure of the system.
From the overall software structure of the system in Fig. 2, it can be seen that the processing content of the urban planning management system is mainly for two aspects of information management: one is text data information, and the other is graphic data information.

Database logical classification.
After the overall architecture of the system is designed, the next step is to design the database for data information storage. From the software engineering process, it is determined that the specific database storage design is mainly divided into two aspects: conceptual structure design and physical structure design. The roles of the two stages are different. The conceptual structure design is to determine the entity information of the urban planning management system, and then determine the relationship between the entity information, so as to perform detailed database table design based on the determined E-R diagram to realize the storage of various data information. For the urban planning information management database, Oracle database is used to store the data information. The logical classification of the specific database is shown in Fig. 2.
The urban planning management system uses Oracle database. When narrating database objects in detail, the key objects in the Oracle database include content such as schemes, table spaces, and database entities. The main function of the table space is to store the data information of the city planning. The plan is a collection, which mainly stores the content of sequences, stored procedures, views, packages, etc. For the urban planning information management system, when specific database instances are described, there are mainly two table spaces created, which are used for storage of spatial database and attribute database information. The schematic diagram of the database technology application of the specific Oracle database is shown in Fig. 3.
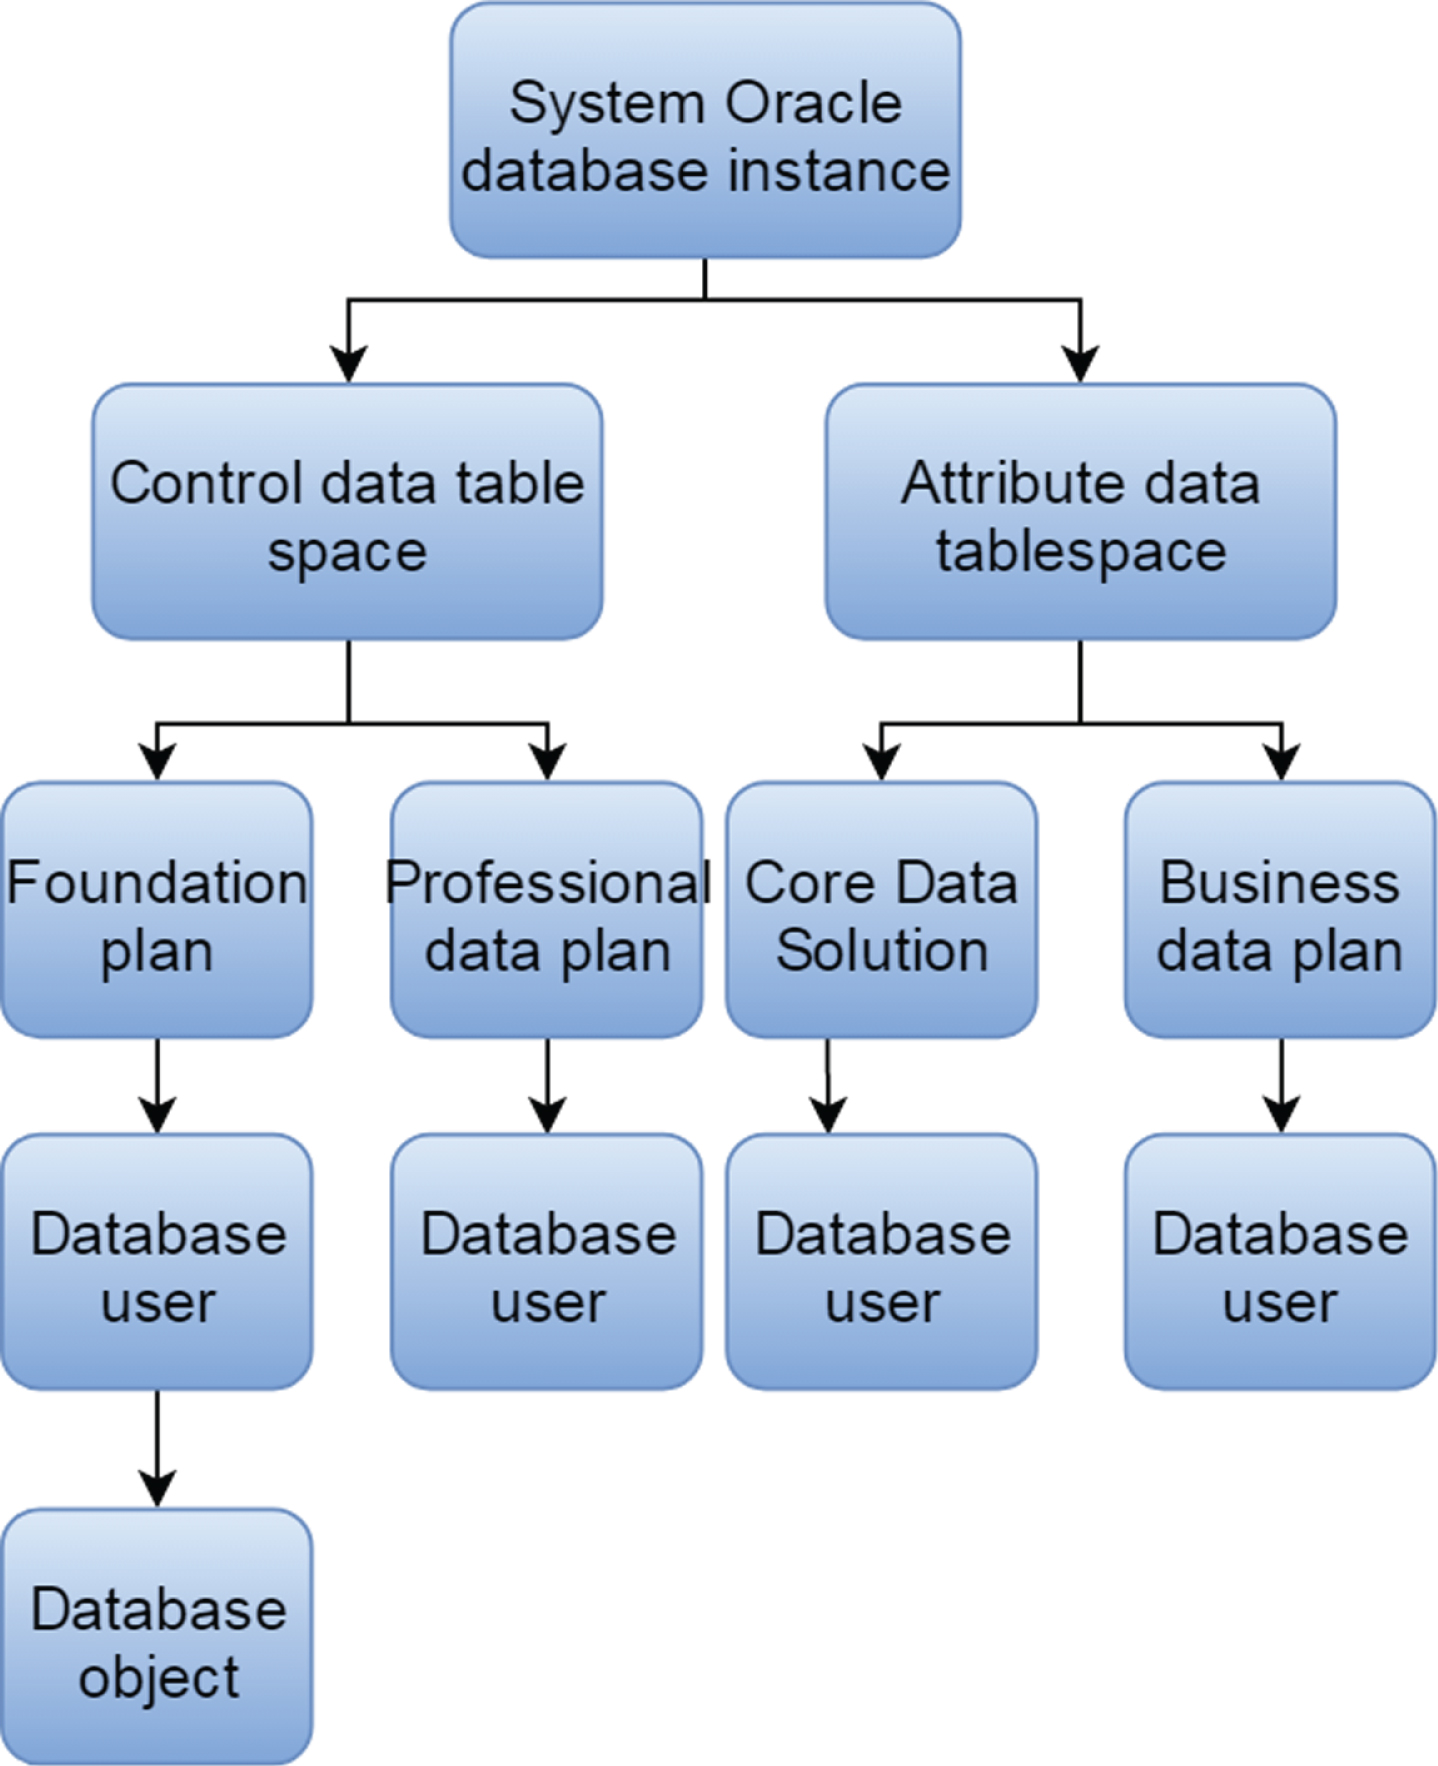
Application of Oracle database technology.
In the database design of the urban planning management information system, it mainly includes two aspects, namely the conceptual structure design and the physical structure design. The conceptual structure design mainly focuses on the content of the system’s database entity design, mainly from the user’s perspective to determine the entity information of the system database. Moreover, it analyzes the attribute content included in the database entity in combination with the specific business process of city planning, so as to determine the data information that needs to be stored eventually. After designing the conceptual structure, the next task is to design the physical structure. The detailed database table is designed mainly based on the entity and attribute content of the database, and the specific information of the field name, data type, empty and length of each database table is given. The specific spatial data and attribute data are related as shown in Fig. 4.

Association of spatial data and attribute data.
In the urban planning information system, the first task is to design the logical structure of the system and determine the logical structure of the system data information. The data logical division content of the specific urban planning management information system is shown in Fig. 5.
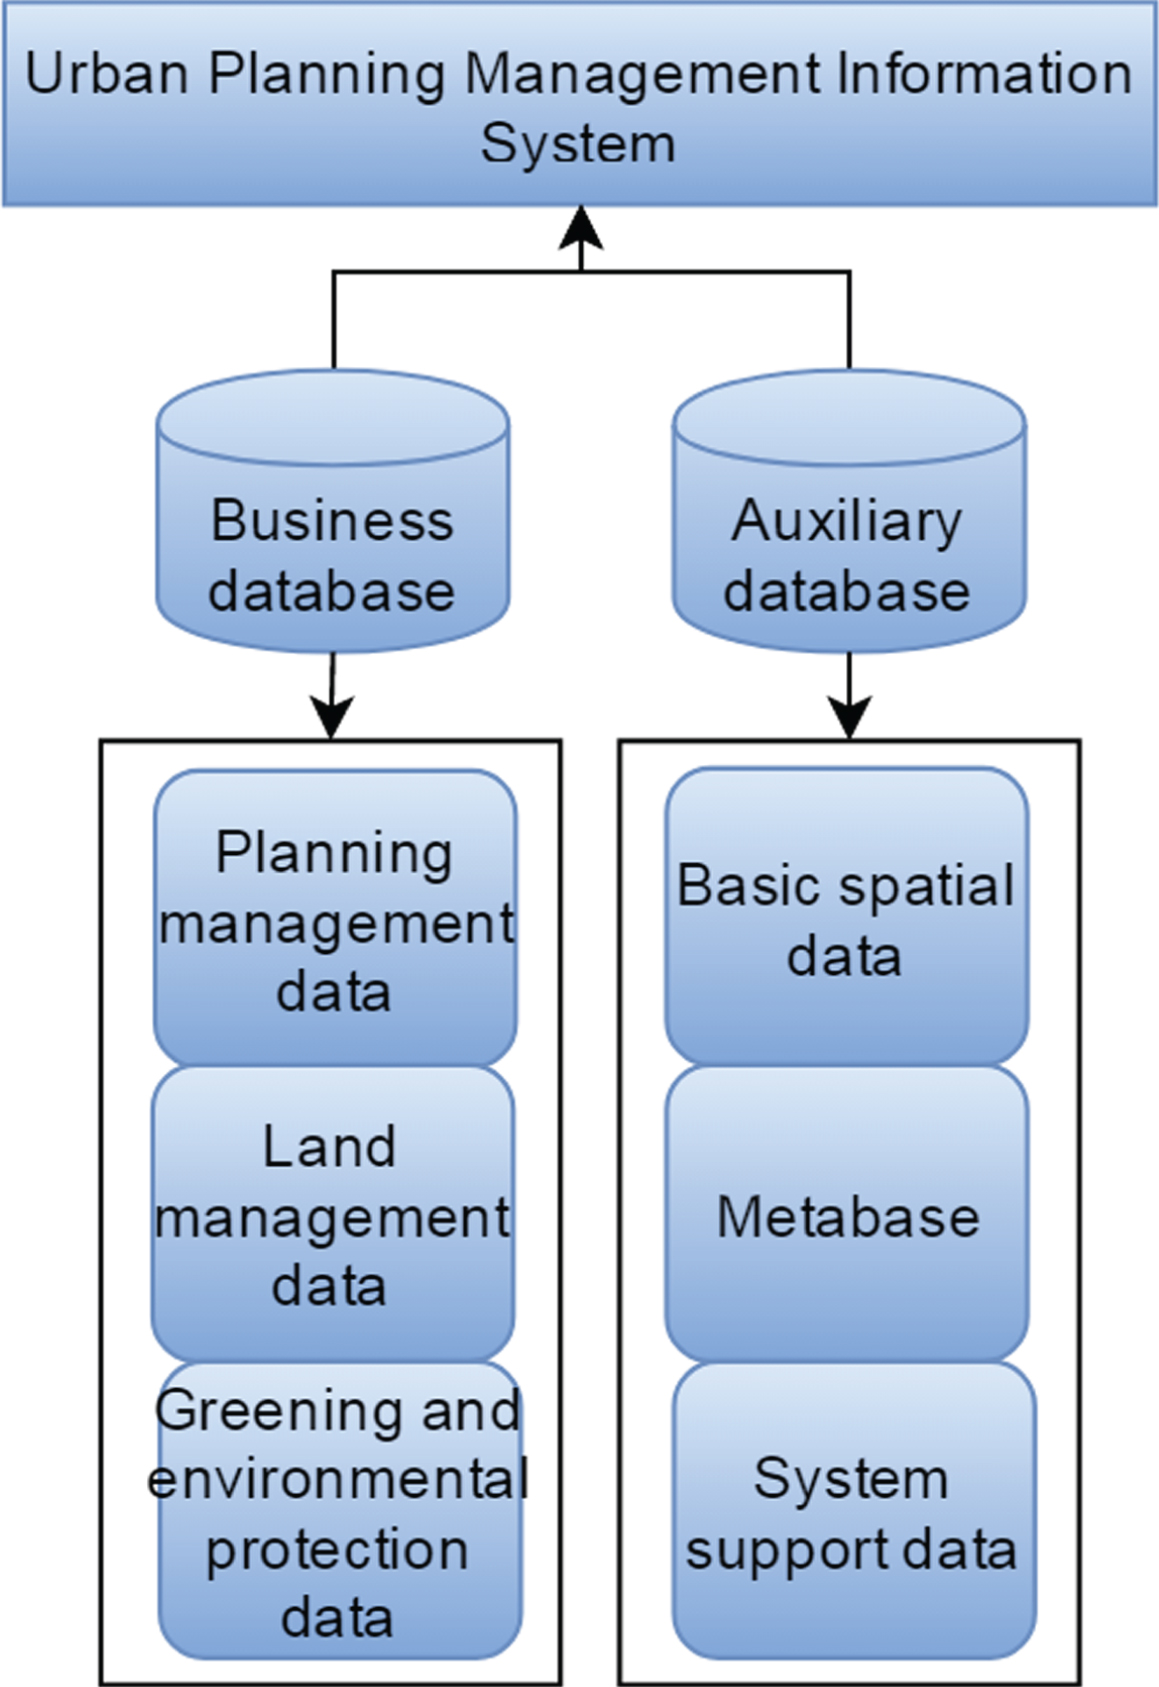
Logical division of urban planning management information system database.
The daily management module is mainly for the staff to carry out the function of case file inquiry and statistics. By querying the statistical results, users can reasonably arrange their own working hours in the order of priority according to the different needs of each file, so as to maximize work efficiency and work results.
When an application program accesses a data source, the necessary steps include three steps: First, the program is registered through the component, and the content of the registration includes the name of the data source, the specific storage data information type, and the corresponding driver. After registering a specific data source, this information needs to be configured in the application. Finally, the application is deployed. When the user specifically clicks on the request, the required data information is accessed through ODBC to meet the user’s needs. The detailed operation content can be seen from the schematic diagram of network file access in Fig. 7, which is divided into two operation contents of client and server.
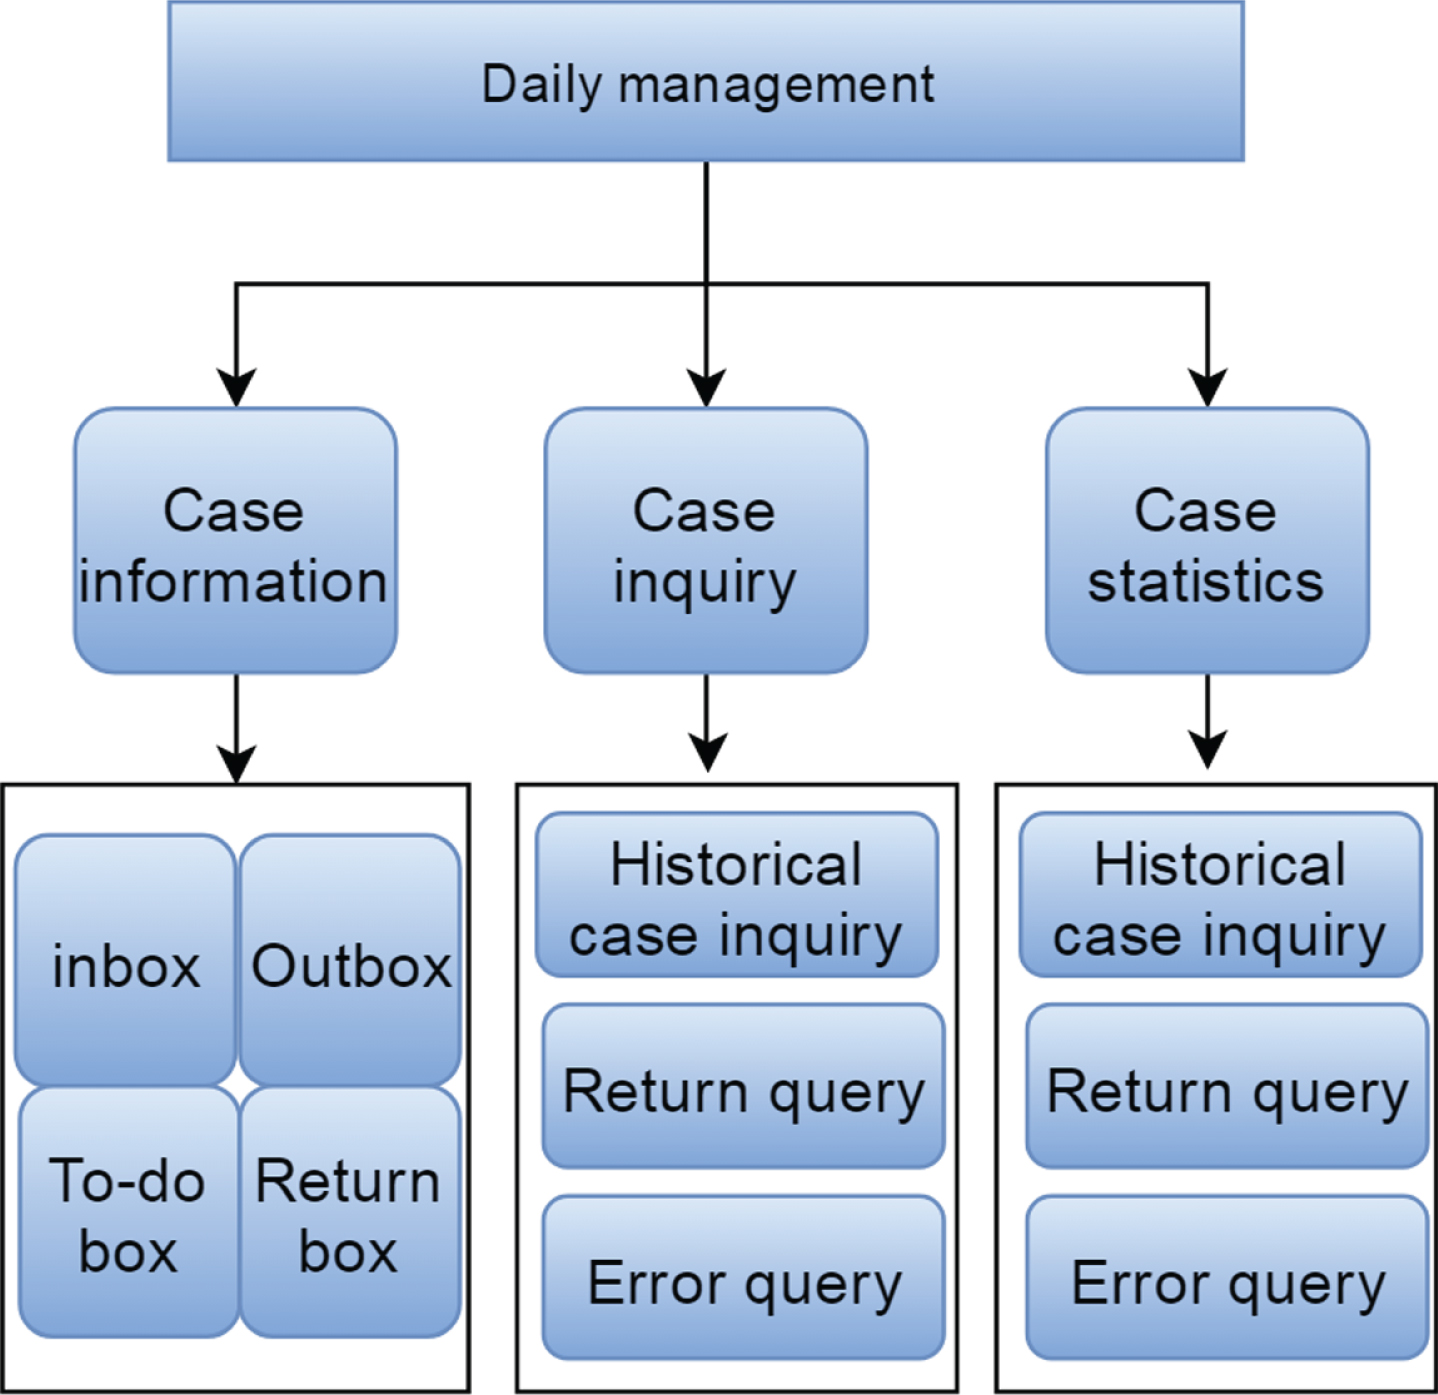
Daily management function module.
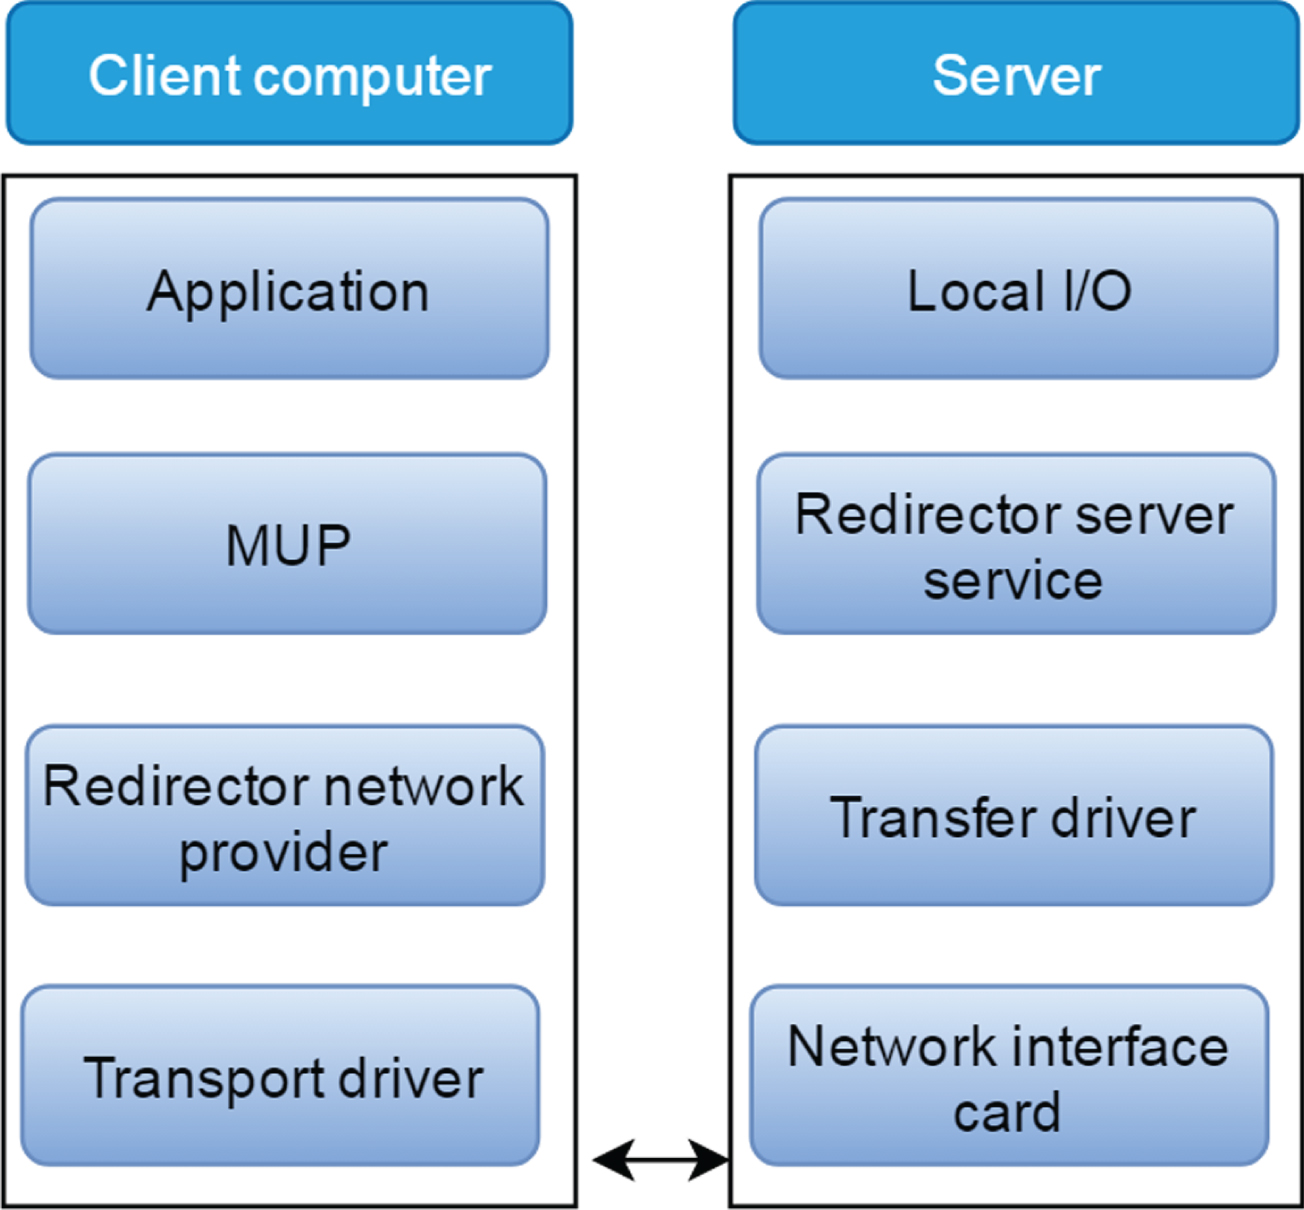
Schematic diagram of network file access.
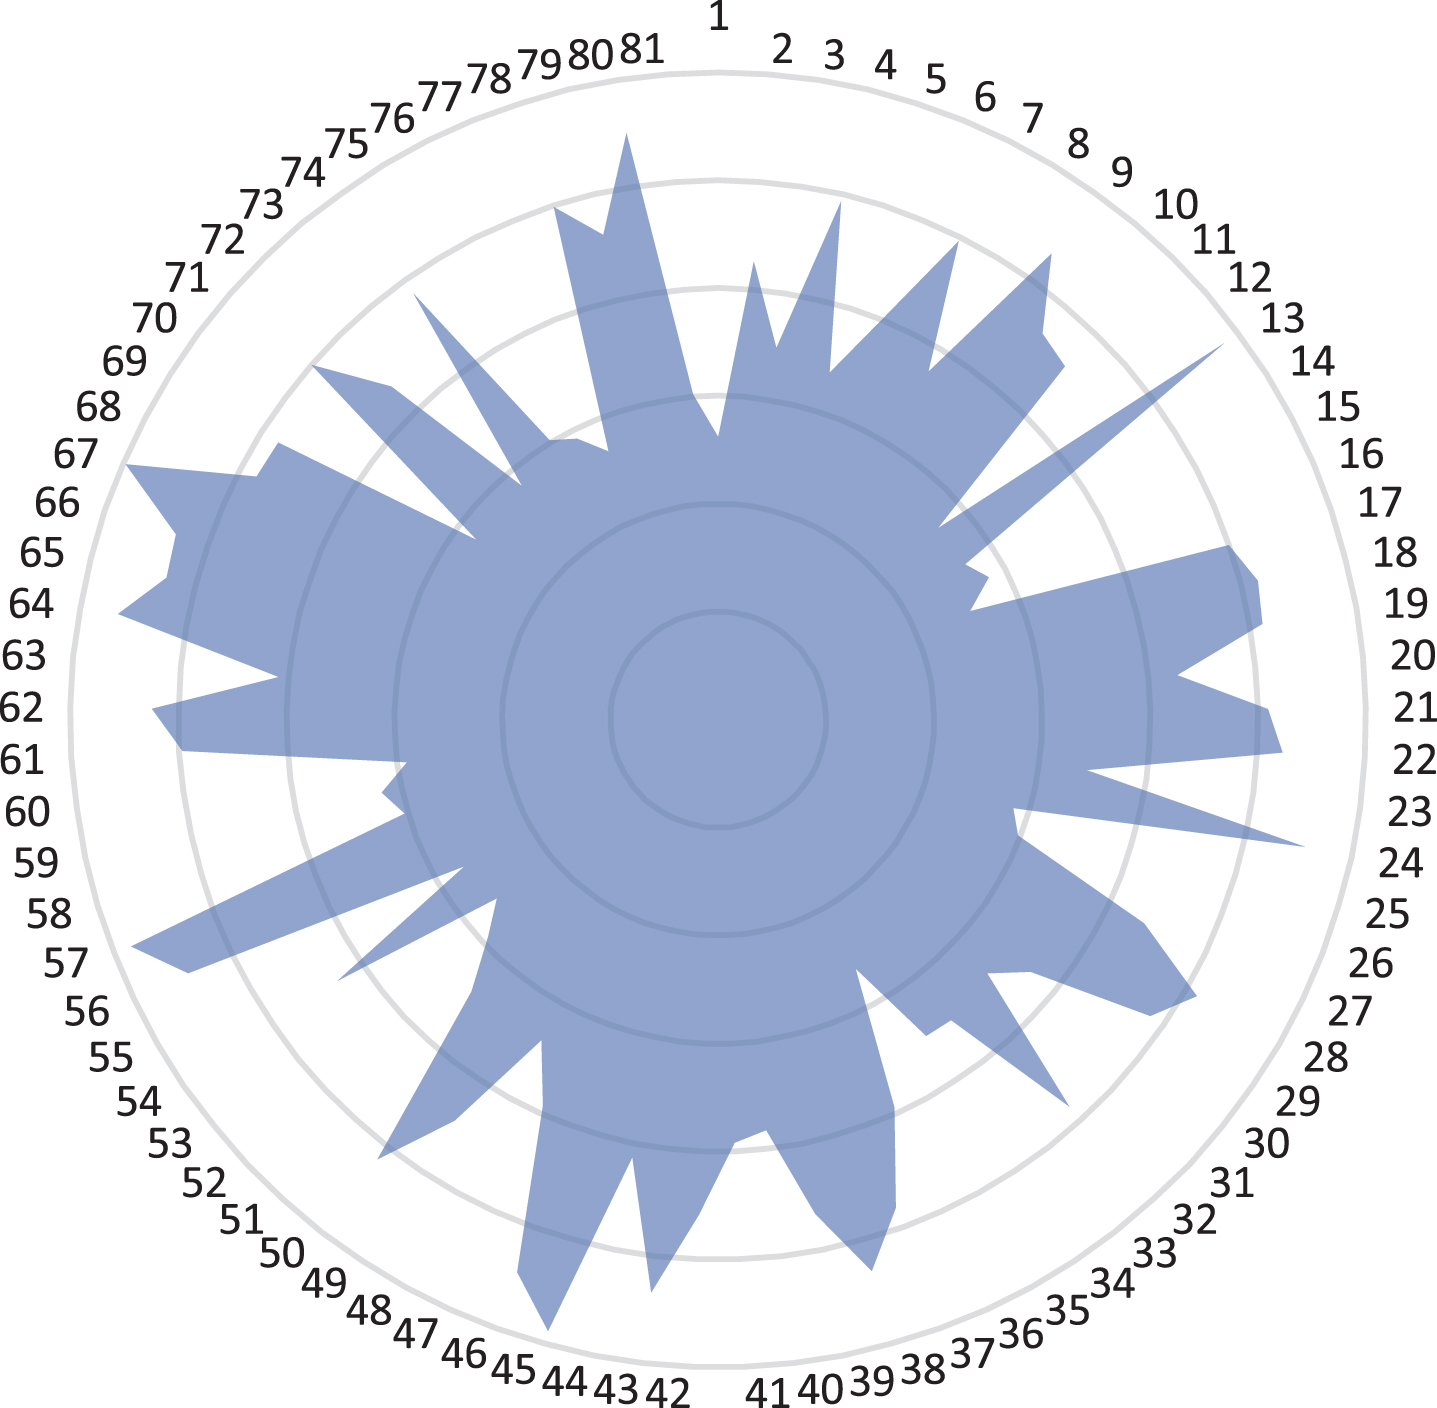
After constructing the model in this paper, the performance of the model is verified. Combining actual needs, this paper uses GIS to monitor the urban environment in a certain area, and conducts virtual planning and design on the basis of monitoring. Therefore, this paper scores the accuracy of environmental monitoring and planning effect. First, this paper analyzes the accuracy of environmental monitoring. A total of 81 sets of data are collected from a certain area, and the collected data are compared with actual statistical data. The results are shown in Table 1 and Fig. 8.
Statistical table of accuracy rate of system monitoring environmental information
Statistical table of accuracy rate of system monitoring environmental information

Statistical diagram of accuracy rate of system monitoring environ-mental information.
From the above analysis results, we can see that the model constructed in this paper has high accuracy in monitoring information. Next, this paper scores the effect of the model’s virtual planning, and the results are shown in Table 2 and Fig. 9.
Statistical table of the scores of urban planning virtual design
Statistical diagram of the scores of urban planning virtual design.
From the above simulation analysis, it can be known that the model constructed in this paper meets the expected goals, so the system constructed in this paper can be used as an aid in the actual planning.
This article combines GIS big data technology and machine learning to construct a virtual design model of urban planning, and constructs the functional structure of the model based on actual needs. The characteristic of a certain single property obtained from the scattering mechanism of ground objects usually cannot express all the information. Even if a classifier with very good performance is selected, it will show the situation of error and misclassification. The polarization SAR system has allowed the image to develop in the direction of high resolution, making the features of the ground objects richer. The proposed multi-feature integration method can effectively reduce the probability of misclassification and misclassification, and can solve this problem. Moreover, through the comparison of simulation experiments, it is known that under the condition of using the same classifier, compared with a single feature, the performance of multi-feature integration is good. In view of the traditional neural network model that needs to set many hidden layer parameters, and it also has the disadvantage of long training time, this paper tries to use the extreme learning machine classification algorithm with fast learning speed and good classification effect as the classifier. Finally, this paper designs experiments to study the performance of the model constructed in this paper. The research results show that the model constructed in this paper meets the expected goals.